
Nov 04, 2026
Altcoins Lead October's Decline
Monthly Attribution - October 2026
The CME CF Crypto Market Index fell 9.32% in October, the smallest decline in the index family, with Bitcoin supplying 57% of the decline while falling less than the index itself. The month ran in two legs that ordered the family in opposite directions. Before the theft of about $6.36 billion from Binance hot wallets that began at 20:05 UTC on October 29, Bitcoin was down 3.55% on the 4:00 p.m. New York fixings while Ether, XRP and Solana were down 13% to 15%, so the Bitcoin-heavy indices fell least. After the theft Bitcoin lost 4.07%, more than Ether or XRP, and the order turned for the CF Diversified Broad Cap Index and the Services and Sectors category indices, which lost less than Crypto Market in the second leg. Because the first leg was larger, Bitcoin's 7.47% decline was smaller than that of any of the five indices that hold it.
Market Recap
Lower yields did not mean easier conditions for risk. The Federal Reserve held its target range at 3.75% to 4.00% on October 28, with two officials dissenting in favor of a hike, after September CPI came in at 3.7% and producer prices posted their largest monthly gain since March 2022. The 10-year Treasury yield still fell, from 5.29% at the end of September to 4.94% on October 30, as weak September payrolls (29,000 jobs against about 84,000 expected) cut the odds of an October hike. Equities weakened around AI spending, with the Nasdaq Composite down 5.2% for the month and falling 2.6% on October 22 after Meta's capex report and 2.8% on October 30 after Intel's guidance. Brent settled at $116.72 on October 23 as Middle East supply risk rose.
Crypto's selling came in two stages. The first coincided with fund redemptions and forced selling. US spot Ether ETFs recorded net outflows of $1.59 billion in October, with redemptions in all but three sessions, and US spot Bitcoin ETFs recorded net outflows of $515 million. The October 7 to 8 leverage flush, with about $1.08 billion of liquidations in the 24 hours to October 9, took Bitcoin down 4.56% and Ether 8.63% on the CF New York fixings, and about $939 million of liquidations followed on October 15. By the October 29 fixing Ether, XRP and Solana were 13% to 15% lower while Bitcoin was down 3.55%.
The second stage was the theft of about $6.36 billion from Binance hot wallets that began at 20:05 UTC on October 29, five minutes after the 4:00 p.m. New York (20:00 UTC) fixing. TRM Labs attributed it with high confidence to North Korea's TraderTraitor group, and Binance suspended withdrawals and said it would cover all losses. Bitcoin's October 30 fixing was 5.31% lower, and US spot Bitcoin ETFs recorded their largest October outflow, $643 million, that day, in the same session as the Nasdaq's 2.8% decline. From the October 29 fixing to month end BNB, Solana, Bitcoin and Ether lost between 3% and 5%, and XRP, the first asset moved, lost 2.37%. Rates did not set the direction of the month. The first leg tracked Ether redemptions and long liquidations, and the price response to the theft was market-wide rather than concentrated in the assets taken or in Binance's token.
Bitcoin Fell Less Than the Index, Yet Supplied 57% of the Decline
The CME CF Crypto Market Index fell 9.32%, almost all of it from Settlement assets. Bitcoin returned -7.47% and contributed -5.29% on a 70.80% weight, 57% of the decline, with Ether the next largest drag at -1.85%. Chainlink, Uniswap and Aave fell harder but carried under 1% of weight between them, so the Services and Sectors categories cost only 0.14 percentage points. Programmable assets also fell harder than Non-Programmable, -13.02% against -8.10%, but on less than a quarter of the weight. Across the index suite, returns ran from -9.32% for this index to -19.71% for the CF Services Category Index, and the ordering largely tracked how much Bitcoin each index held.
Crypto Market: Where the Return Came From
The CME CF Crypto Market Index holds 12 constituents, and Bitcoin, at about 71% of weight, decided most of the result. Ether, XRP and Solana each fell more than twice as far as Bitcoin, at -15.78%, -16.03% and -18.78%, so the rest of the basket lost 13.78% as a group on 29.20% of weight.
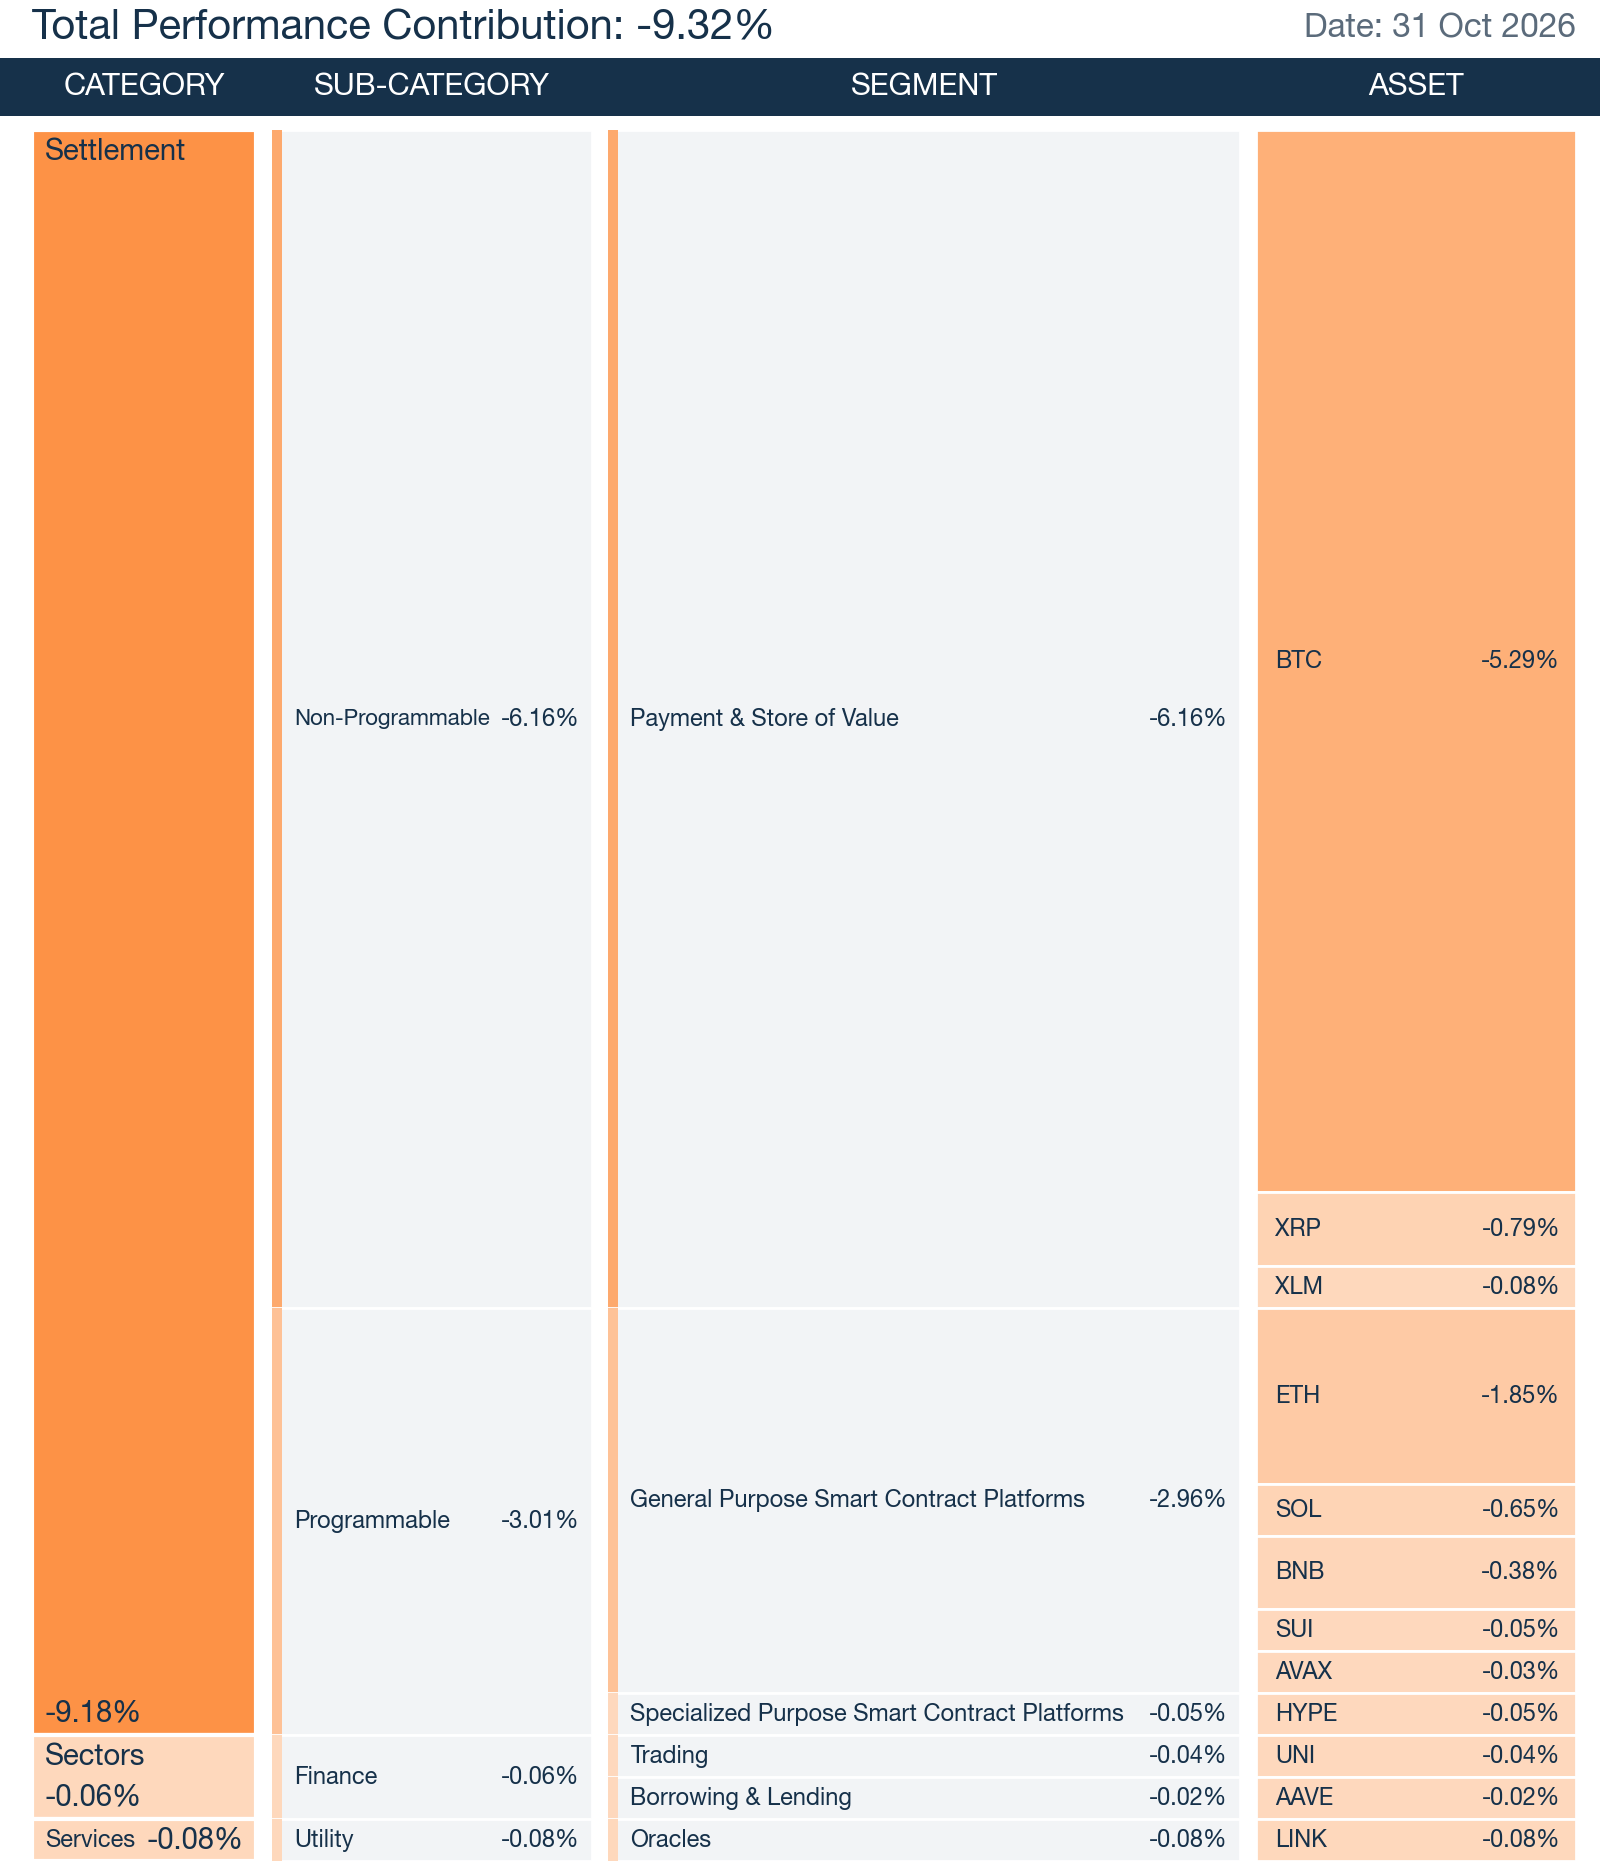
Most of the gap to Bitcoin opened before the theft. The index was 5.53% lower at the October 29 fixing against 3.55% for Bitcoin, then lost 4.01% after it against 4.07% for Bitcoin. All 12 constituents fell. Hyperliquid, at -1.82%, was the only one to fall less than Bitcoin, and Stellar, at -25.12%, fell furthest.
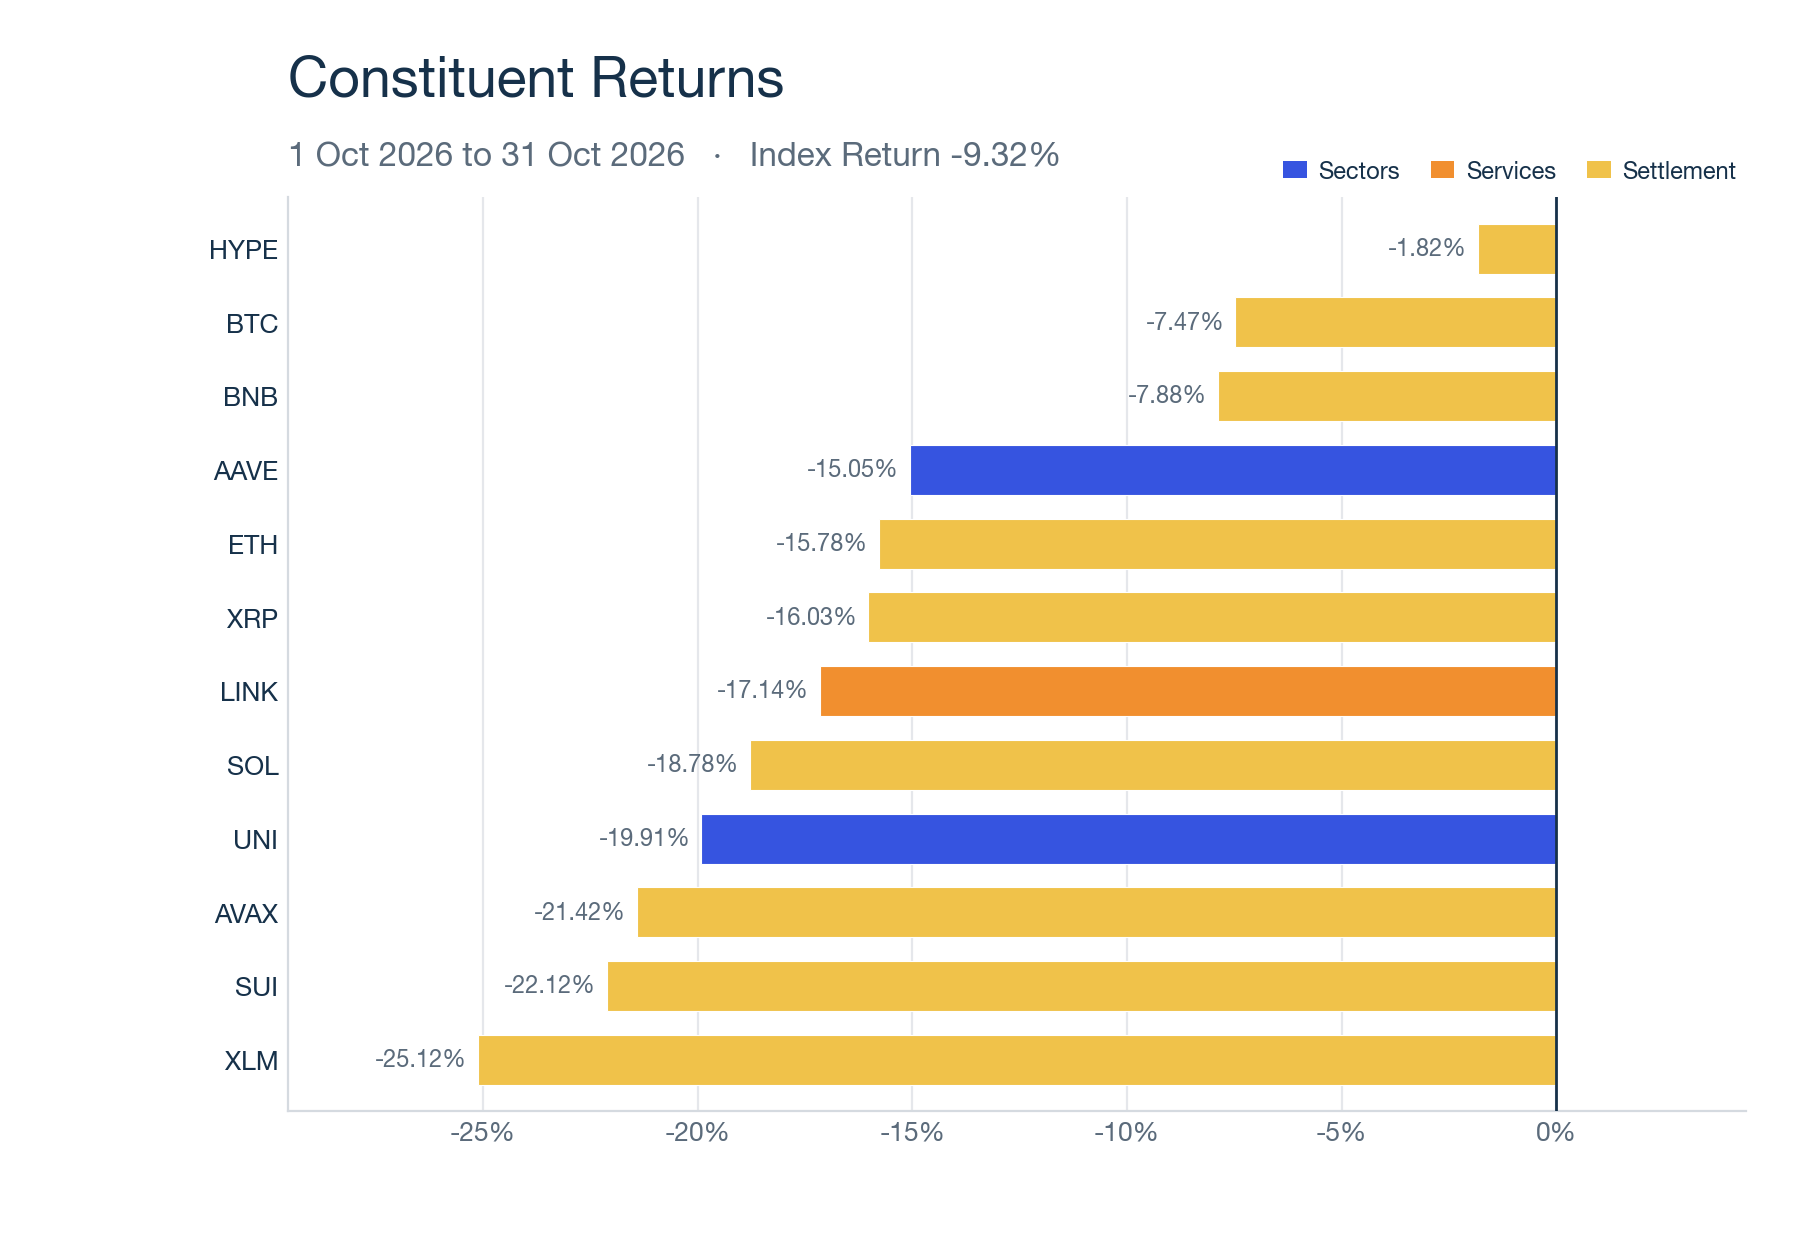
No CF index reconstituted in October, so weights carried over from the September 30 close. Bitcoin's weight in the index rose to 72.24% from 70.80% by month end as altcoins fell further.
Across the Capitalization Series
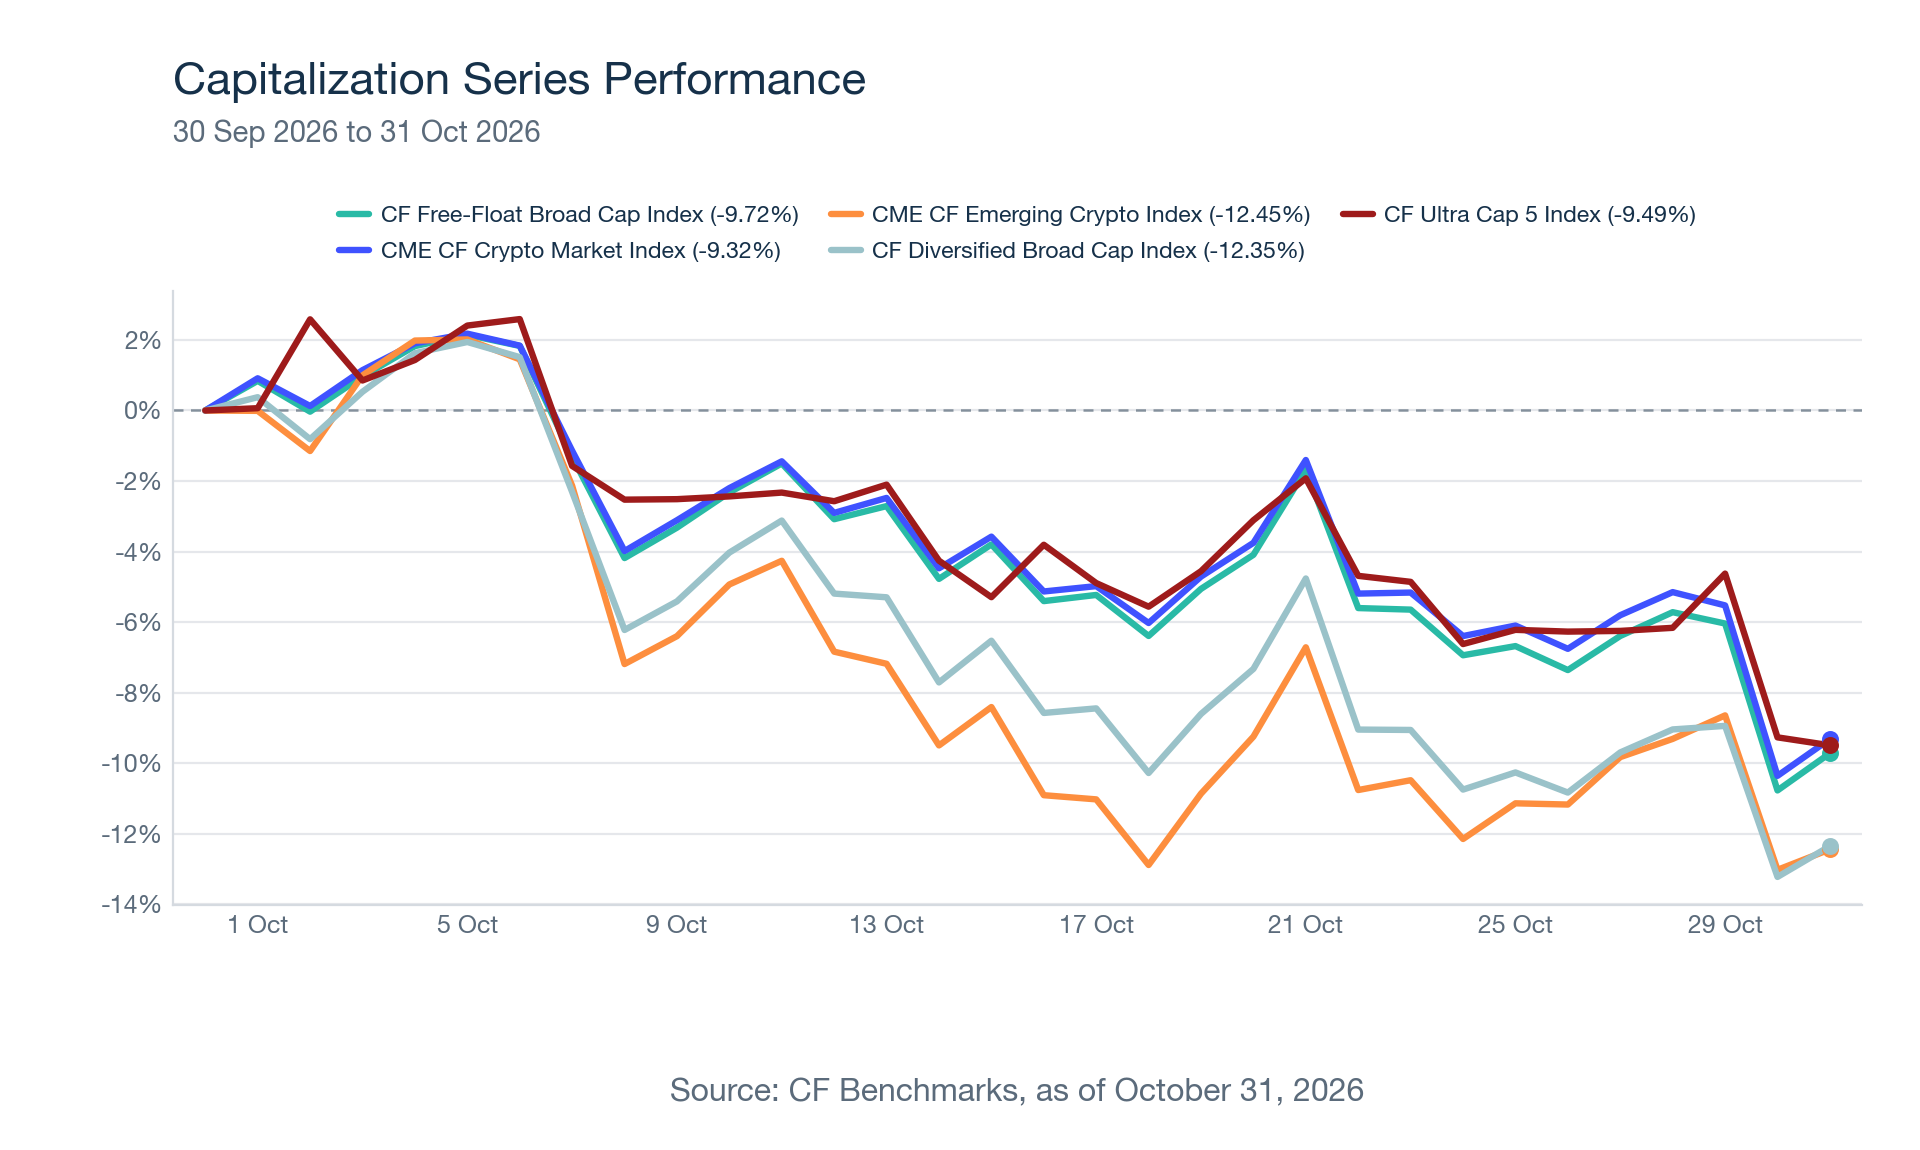
The CME CF Crypto Market Index returned -9.32% in October, the CF Ultra Cap 5 Index -9.49%, the CF Free-Float Broad Cap Index -9.72%, the CF Diversified Broad Cap Index -12.35% and the CME CF Emerging Crypto Index -12.45%. The three indices with the most Bitcoin fell least, and the two with the least fell most.
The CF Ultra Cap 5 Index is the most Bitcoin-heavy of the family at 75.05% and fell 9.49% on its own London fixings, where Bitcoin returned -7.78% against -7.47% in the other indices. Hyperliquid, at +1.84% on that basis, was the only holding to rise.
The CF Free-Float Broad Cap Index holds 35 names and fell 0.40 percentage points more than Crypto Market. Its 31 holdings beyond the four largest lost 12.47%, against 8.07% for the eight beyond them in Crypto Market, because BNB and Hyperliquid, which fell least, made up most of those eight. Only Pepe and LayerZero rose.
The CF Diversified Broad Cap Index holds the same 35 names but caps Bitcoin at 36.49%, which made Ether, at 19.06% of weight, its largest drag at -3.01%. The index trailed Crypto Market by 3.41 points to the October 29 fixing, then lost 0.27 points less after the theft, as Bitcoin fell more than most of the altcoins it overweights.
The CME CF Emerging Crypto Index holds no Bitcoin or Ether and fell almost exactly as much as Diversified, with XRP, Solana and BNB supplying 84% of the decline while BNB and Hyperliquid, 43% of its weight, fell least.
Across the Classification Series
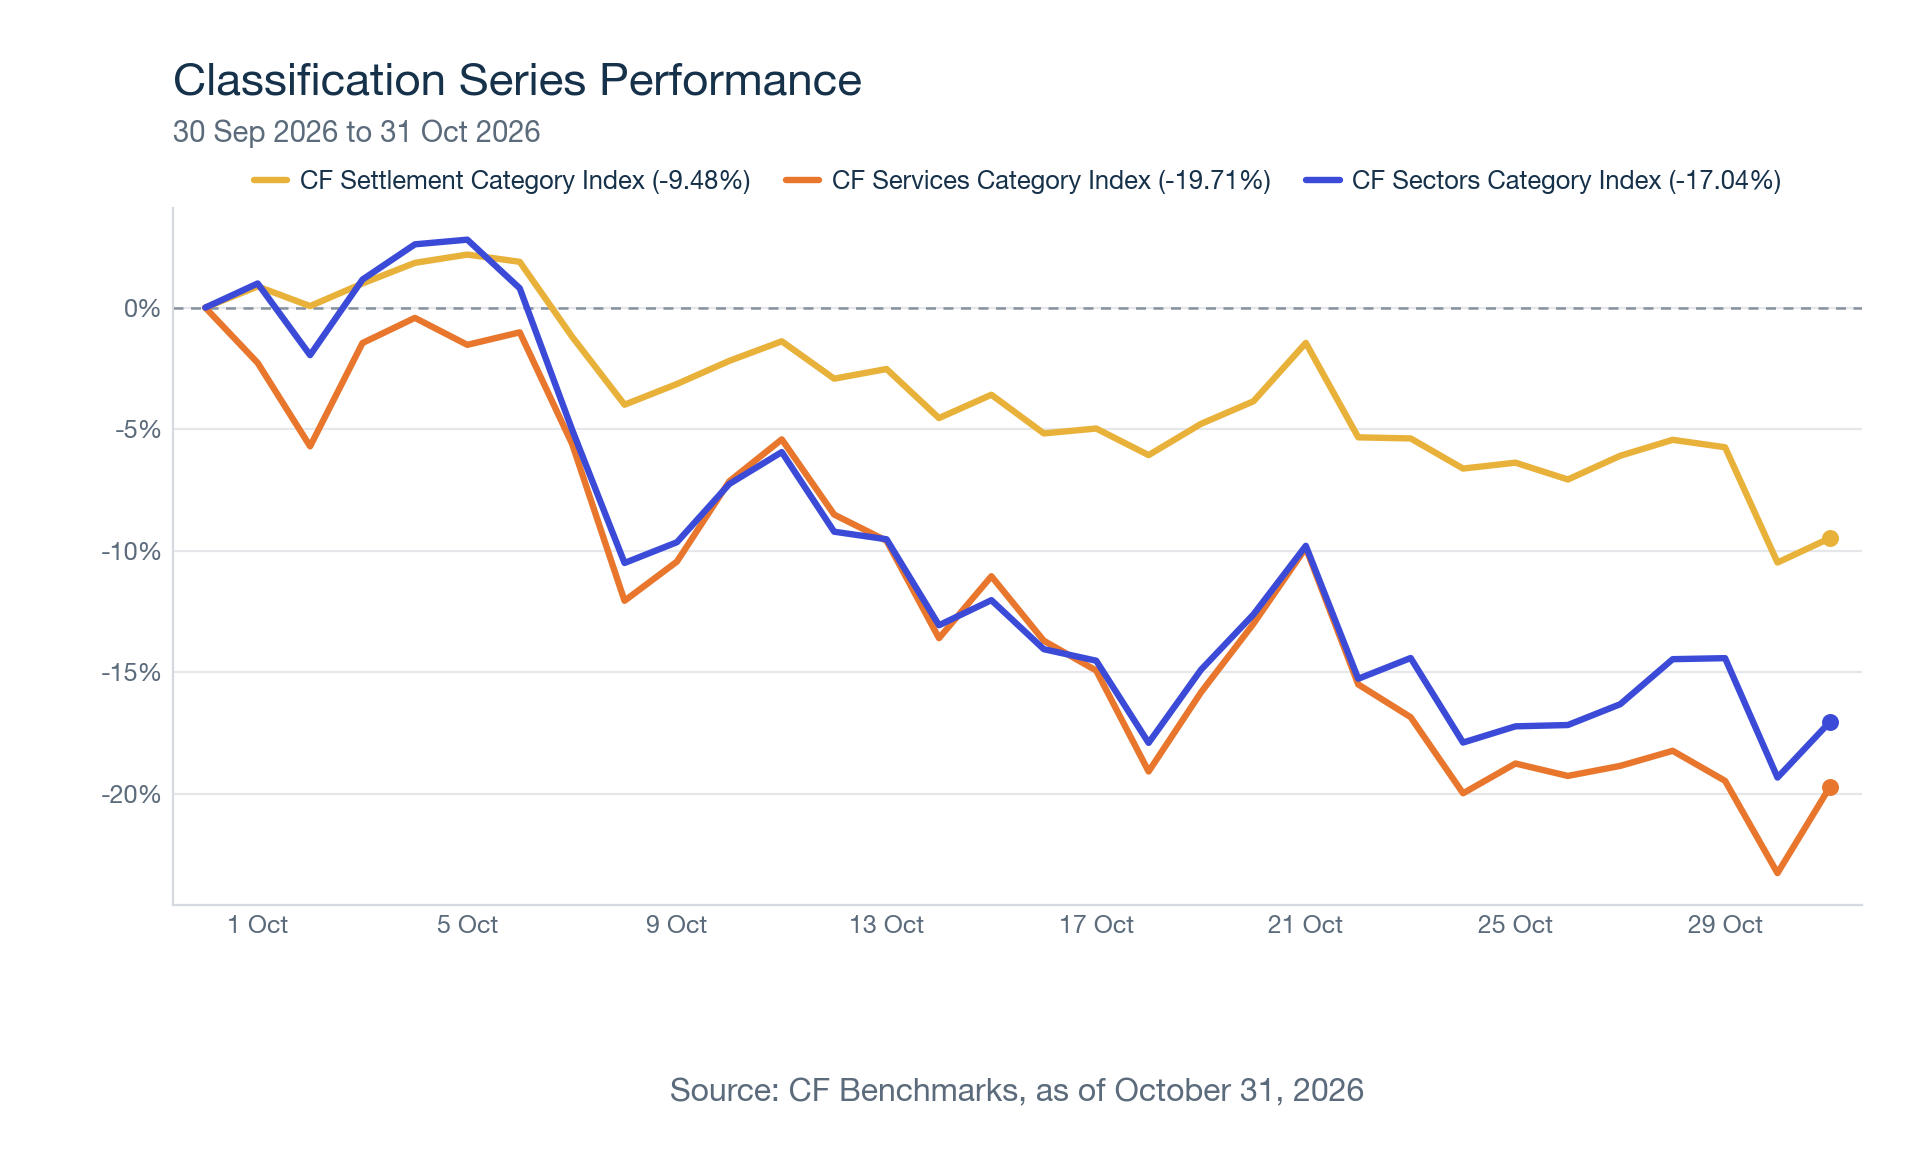
The three CF DACS category indices ran as a defensiveness gradient before the theft and reversed after it. The CF Settlement Category Index returned -9.48%, with Bitcoin at 73.08% of weight, and fell least. The CF Sectors Category Index returned -17.04%, with Dogecoin, at 45.31% of weight, supplying 52% of the decline. The CF Services Category Index returned -19.71%, with Chainlink, Quant and Bittensor supplying 74%, and Quant reversing a 363.26% September rally. Services was 19.46% lower at the October 29 fixing against 14.42% for Sectors and 5.74% for Settlement, then lost only 0.31% after the theft against 3.06% and 3.97%, as Bitcoin's 4.07% second-leg decline weighed on Settlement's Bitcoin weight. Inside Crypto Market, the Services and Sectors holdings carried under 1% of weight, so the Classification Series indices are where those declines show.
To read the full reports, please click on the respective links below:
CF Free-Float Broad Cap Index: Monthly Attribution [PDF]
CF Diversified Broad Cap Index: Monthly Attribution [PDF]
CF Ultra Cap 5 Index: Monthly Attribution [PDF]
CME CF Crypto Market Index: Monthly Attribution [PDF]
CME CF Emerging Crypto Index: Monthly Attribution [PDF]
CF Settlement Category Index: Monthly Attribution [PDF]
CF Services Category Index: Monthly Attribution [PDF]
CF Sectors Category Index: Monthly Attribution [PDF]
Our Monthly Attribution Reports are designed to help investors understand the performance of digital assets through a purpose-centric lens called the CF Digital Asset Classification Structure (CF DACS). To learn more about CF DACS, please use our interactive CF DACS Token Explorer.
The information contained within is for educational and informational purposes ONLY. It is not intended nor should it be considered an invitation or inducement to buy or sell any of the underlying instruments cited including but not limited to cryptoassets, financial instruments or any instruments that reference any index provided by CF Benchmarks Ltd. This communication is not intended to persuade or incite you to buy or sell security or securities noted within. Any commentary provided is the opinion of the author and should not be considered a personalised recommendation. Please contact your financial adviser or professional before making an investment decision.
Note: Some of the underlying instruments cited within this material may be restricted to certain customer categories in certain jurisdictions.
Altcoins Lead October's Decline
The CME CF Crypto Market Index fell 9.32% in October, the smallest decline in the family, as Bitcoin supplied 57% of it while falling less than the index. Altcoins led the selling before the Binance theft and Bitcoin after it, so the CF Services Category Index fell furthest (-19.71%).

Mark Pilipczuk
Crypto Slides On Hike Fears And Binance Theft
Digital assets fell in October as the Fed held rates with two dissents in favor of a hike and the $6.3 billion Binance theft pushed Broad Cap below its 100-day average. All eight CF indices declined, DeFi fell 23.5%, and funds recorded their first outflow since June.
Mark Pilipczuk
Changes to the Token Market Price Benchmarks Series - Market Prices – 03 November 2026
The Administrator has confirmed changes to the Token Market Price Family for the period 27 October 2026 to 03 November 2026.
CF Benchmarks
By clicking Accept, you consent to CF Benchmarks's use of cookies.
Visit Cookie Settings to learn how CF Benchmarks uses cookies and to adjust your preferences.