
Jul 01, 2025
Bitcoin Consolidates as GENIUS Act Progresses
Key takeaways for the month
Market Overview: Price action supported defensive positioning amid macro and geopolitical uncertainty. Bitcoin largely consolidated in the six-figure range as investors awaited the next Federal Reserve meeting. The Fed maintained rates at 4.25–4.50% and signaled restraint due to persistent inflation concerns. Meanwhile, regulatory clarity advanced as the GENIUS stablecoin bill passed the Senate and moved to the House, while the SEC cleared filings for staking-enabled Solana ETFs and market participants await approval of multi-token baskets. Crypto funds attracted over $6.1B in inflows, with Ethereum funds posting strong inflows alongside record CME futures open interest, underscoring continued investor demand.
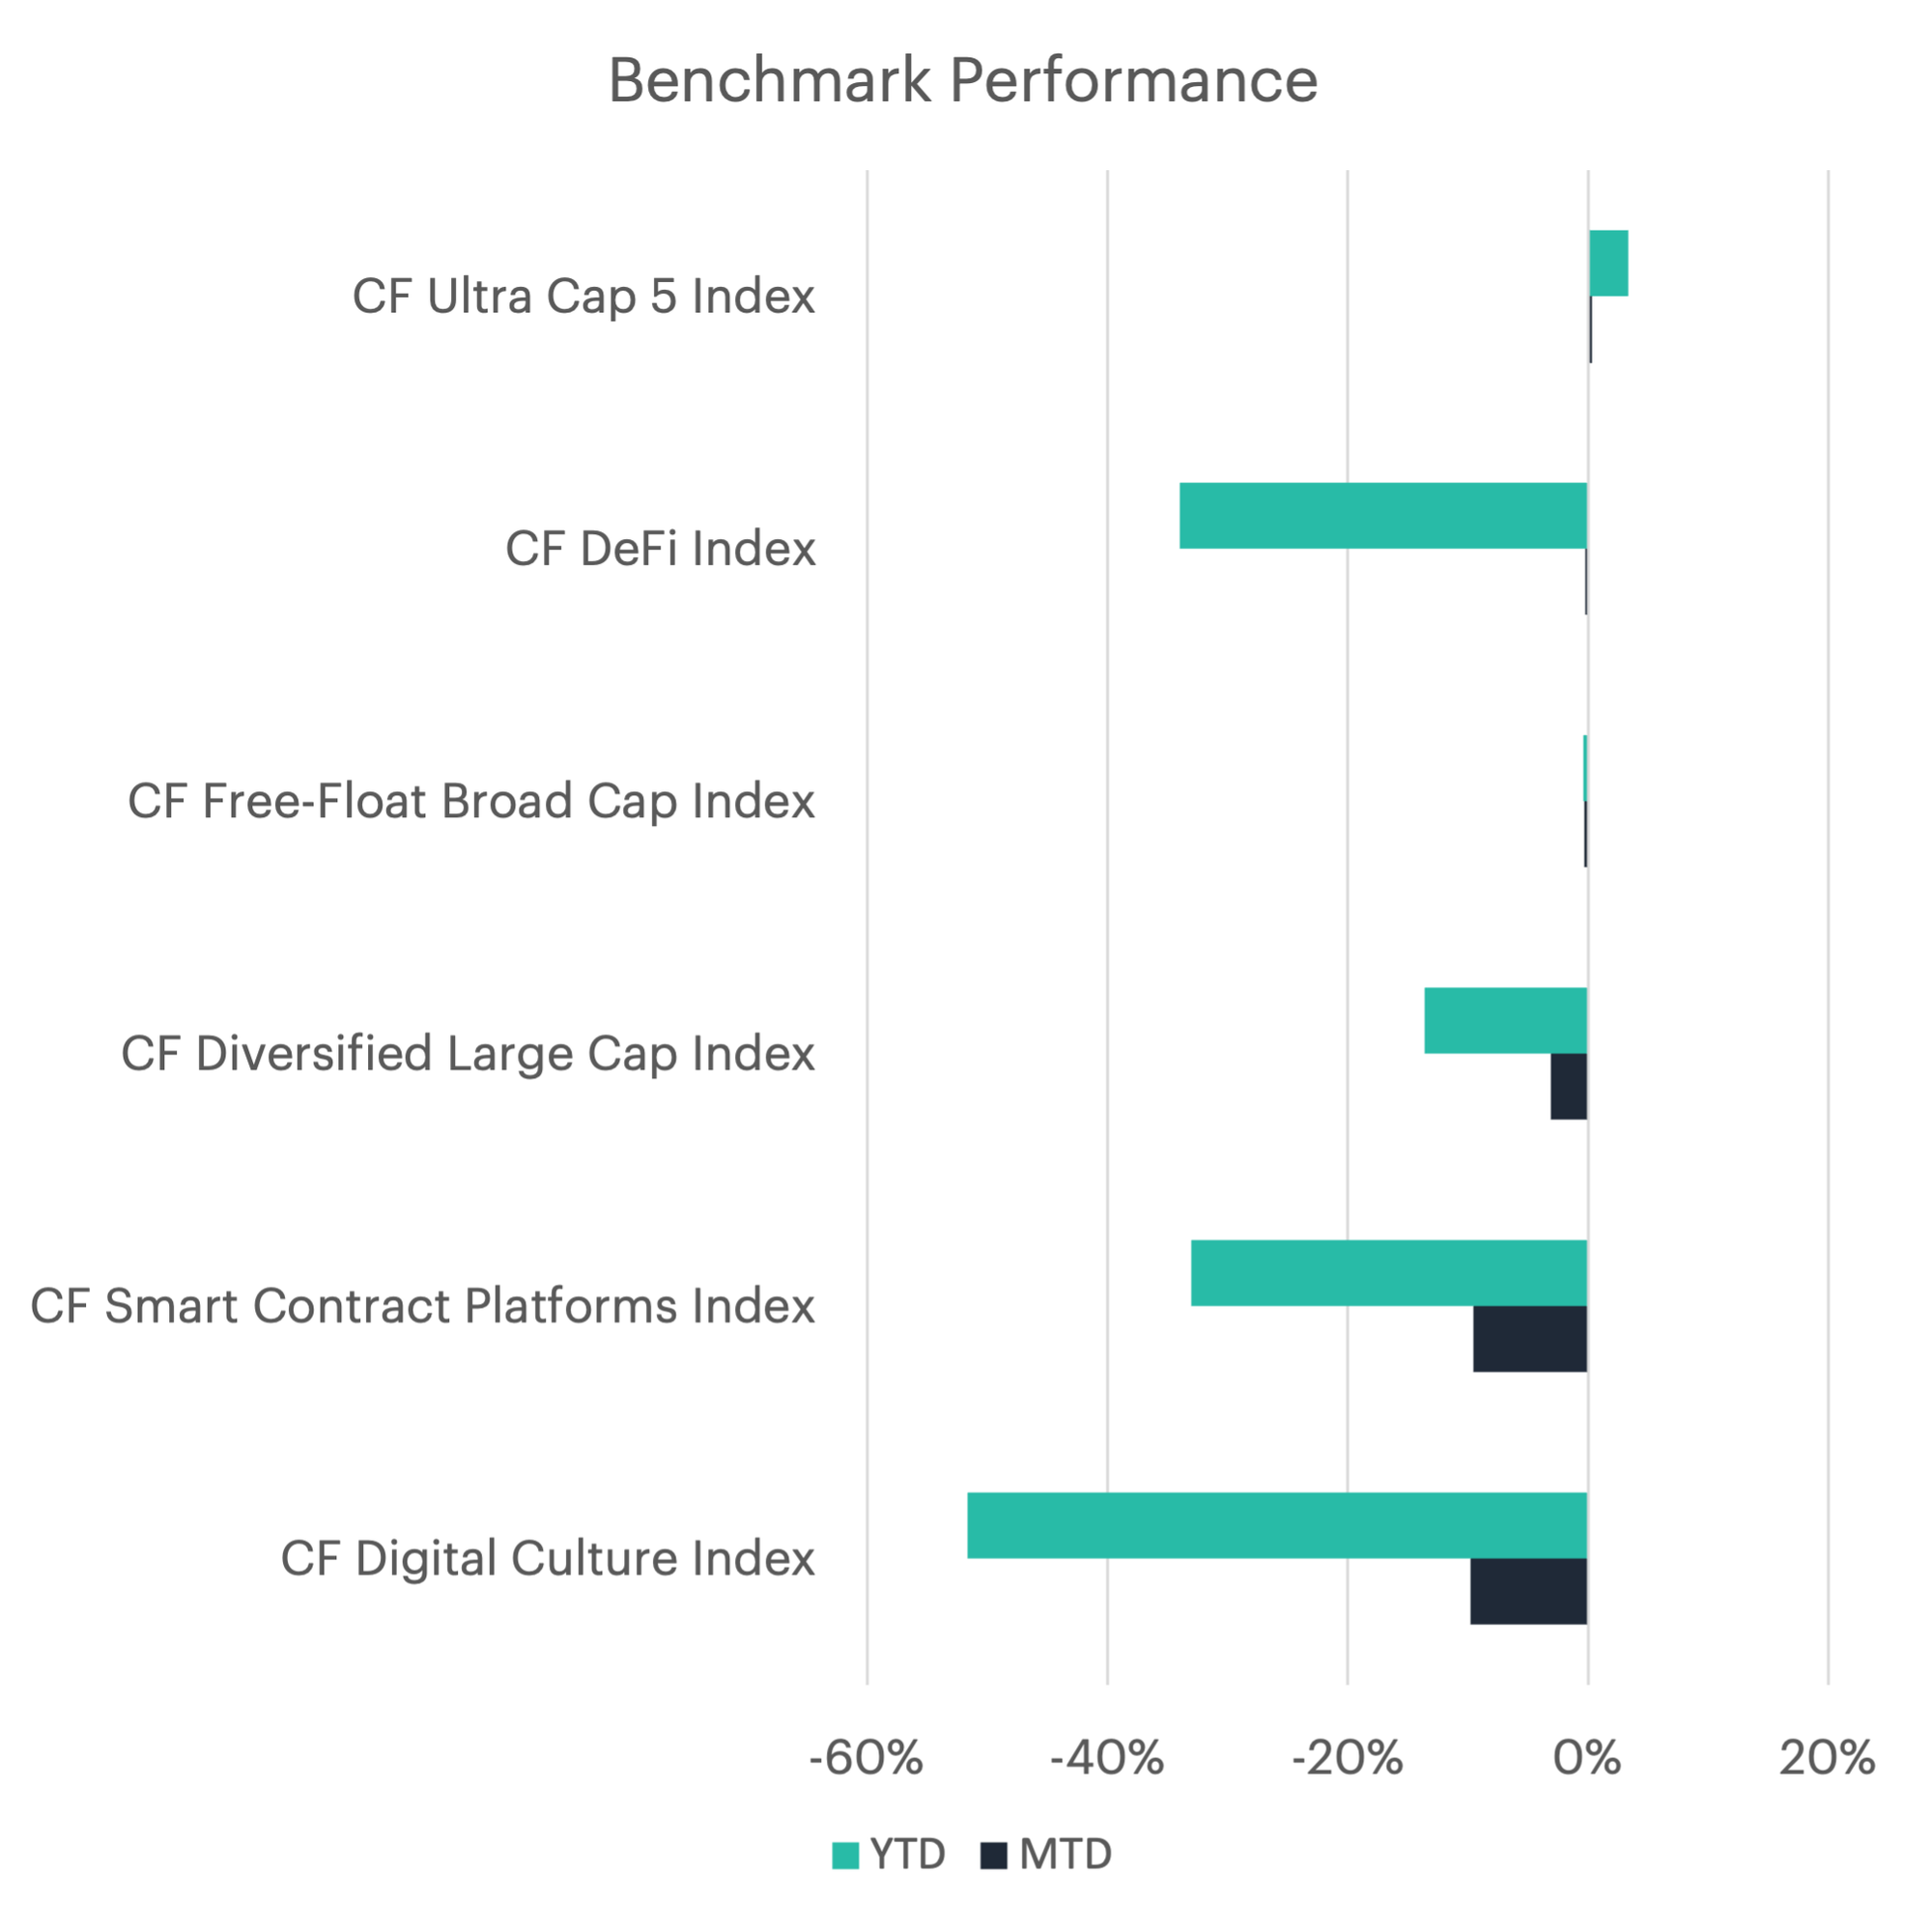
Index Performance: Our indices posted relatively mixed results last month. The CF Ultra Cap 5 Index led with a modest 0.32% monthly gain, extending its year-to-date return to 3.34%. Losses were more prevalent across the board: the CF Free-Float Broad Cap Index slipped 0.35% (YTD -0.42%), while the CF Diversified Large Cap Index fell 3.10% (YTD -13.62%). The CF DeFi Index declined slightly by 0.20% (YTD -33.96%), and the CF Smart Contract Platforms Index dropped 9.52% (YTD -33.01%). The CF Digital Culture Index was the worst performer, falling 9.75% (YTD -51.64%). Investors appeared increasingly cautious, favoring more liquid, large-cap assets.
Notable Movers: Maker rallied 24.2 % in June as the Spark protocol won approval for a higher USDS debt ceiling, tightening circulating supply. Bitcoin Cash climbed 23.4 %, boosted by heavy trading volumes. Uniswap added 17.2 % after the community revived debate over flipping on the long-awaited fee-switch for UNI holders. Synthetix tumbled 27.5 % amid ongoing concerns about the sUSD stablecoin's peg, triggering outflows from the ecosystem. EOS slid 21.4 % as traders braced for the late-June migration to the new Vaulta token. Curve DAO Token fell 21.1 %, with sentiment still weighed down by lingering founder-loan liquidation risks.
Fund Flows: June saw continued inflows into digital asset funds, with investors allocating approximately $6.1 billion. Bitcoin accounted for $4.6 billion of that total, while Ethereum attracted an impressive $1.4 billion. From a regional perspective, fund inflows were concentrated in North America, which saw a net inflow of approximately $7.6 billion. Meanwhile, Europe continued to attract capital, recording inflows of around $127 million for the month.
Futures Markets: Net sentiment positioning in Bitcoin improved in June, as long positions outpaced shorts. As a result, net futures positioning on the CME rose to -469 contracts, up from -502. Total open interest in CME Ether futures increased further in June, rising 19.1% from the previous month and marking a new all-time high. Meanwhile, open interest in Bitcoin futures declined by 1.9% month over month.
Bitcoin Network Metrics: Bitcoin's average monthly hash rate grew in June, increasing by 10.5% to 798 exahashes per second. Mining difficulty, which measures the computational effort required to mine a new block and adjusts to maintain consistent block creation times, declined by 7.2% following a period of slower block times in late June. The next difficulty adjustment is expected in the second week of July and is currently trending toward a 6.1% increase. Bitcoin miners saw an 8.2% decrease in mining revenue in June. Of the total rewards earned during the month, 1.1% came from transaction fees, down from 1.3% in May. The decline in revenue was driven largely by Bitcoin's intra month volatility.
Network Fundamentals: Total fees paid on the Ethereum network fell by 10.6% compared to the previous month, reaching $36.4 million. While overall fees declined, a 35.9% increase in the average fee per interaction indicates fiercer bidding for block space among the transactions that occurred, even though the overall number of transactions declined. Total fees paid on the Solana network declined by 34.8% from the previous month, falling to $26.1 million. MEV accounted for approximately 48.5% of total fees, highlighting increased competition among searchers for profitable on-chain opportunities.
To read the complete report, kindly click on the provided link (or click here to view a PDF version). Additionally, please do not forget to subscribe to our latest news and research for the most relevant institutional insights on digital assets and the top digital assets by market cap.
The information contained within is for educational and informational purposes ONLY. It is not intended nor should it be considered an invitation or inducement to buy or sell any of the underlying instruments cited including but not limited to cryptoassets, financial instruments or any instruments that reference any index provided by CF Benchmarks Ltd. This communication is not intended to persuade or incite you to buy or sell security or securities noted within. Any commentary provided is the opinion of the author and should not be considered a personalised recommendation. Please contact your financial adviser or professional before making an investment decision.
Note: Some of the underlying instruments cited within this material may be restricted to certain customer categories in certain jurisdictions.
Factor Friday - July 3, 2026
The broad market rebounded 5.22% this week after the prior week's selloff, but style factors mostly sat out the bounce. Value was the only factor in positive territory at 1.42%, extending its four-week gain to 3.67% while the Market remains down 2.24% over that span.

Mark Pilipczuk
Hawkish Fed & Geopolitical Fragility Broaden Drawdown
A hawkish Fed, a 4.2% CPI print, and fragile Iran diplomacy drove a broad, steep drawdown across digital assets in June. Every CF Benchmarks index fell, fund outflows hit a 2026 high near $4.1 billion, and investors stayed defensive as rate-cut hopes faded and the war premium lingered.
Mark Pilipczuk
Changes to the Token Market Price Benchmarks Series - Market Prices – 30 June 2026
Changes to the Token Market Price Benchmarks Series - Market Prices – 30 June 2026.
CF Benchmarks
By clicking Accept, you consent to CF Benchmarks's use of cookies.
Visit Cookie Settings to learn how CF Benchmarks uses cookies and to adjust your preferences.