
Oct 19, 2026
Altcoins Lag as Bitcoin Tests The 50-Day Moving Average
Weekly Index Highlights, October 19, 2026
Digital assets fell across the CF Single Asset, Capitalization, Classification and DACS series this week as Bitcoin's New York 16:00 (NY) fix slipped to its 50-day moving average around two hot US inflation prints and a Friday equity sell-off. Bitcoin (BTC) lost 3.22% week-on-week (w/w) and closed just below the average after sitting above it a week earlier. The decline was spread across the three largest down sessions, Wednesday's Consumer Price Index (CPI) release day, Friday and Monday, while Thursday's Producer Price Index (PPI) day closed higher at the fix. The losses grew with distance from BTC: the diversified CF Capitalization indices trailed their free-float counterparts by a wider margin than a week earlier, all six CF Digital Asset Classification Structure (DACS) sub-categories fell, and nearly every constituent with a weekly return fell with them.
Market Performance Update
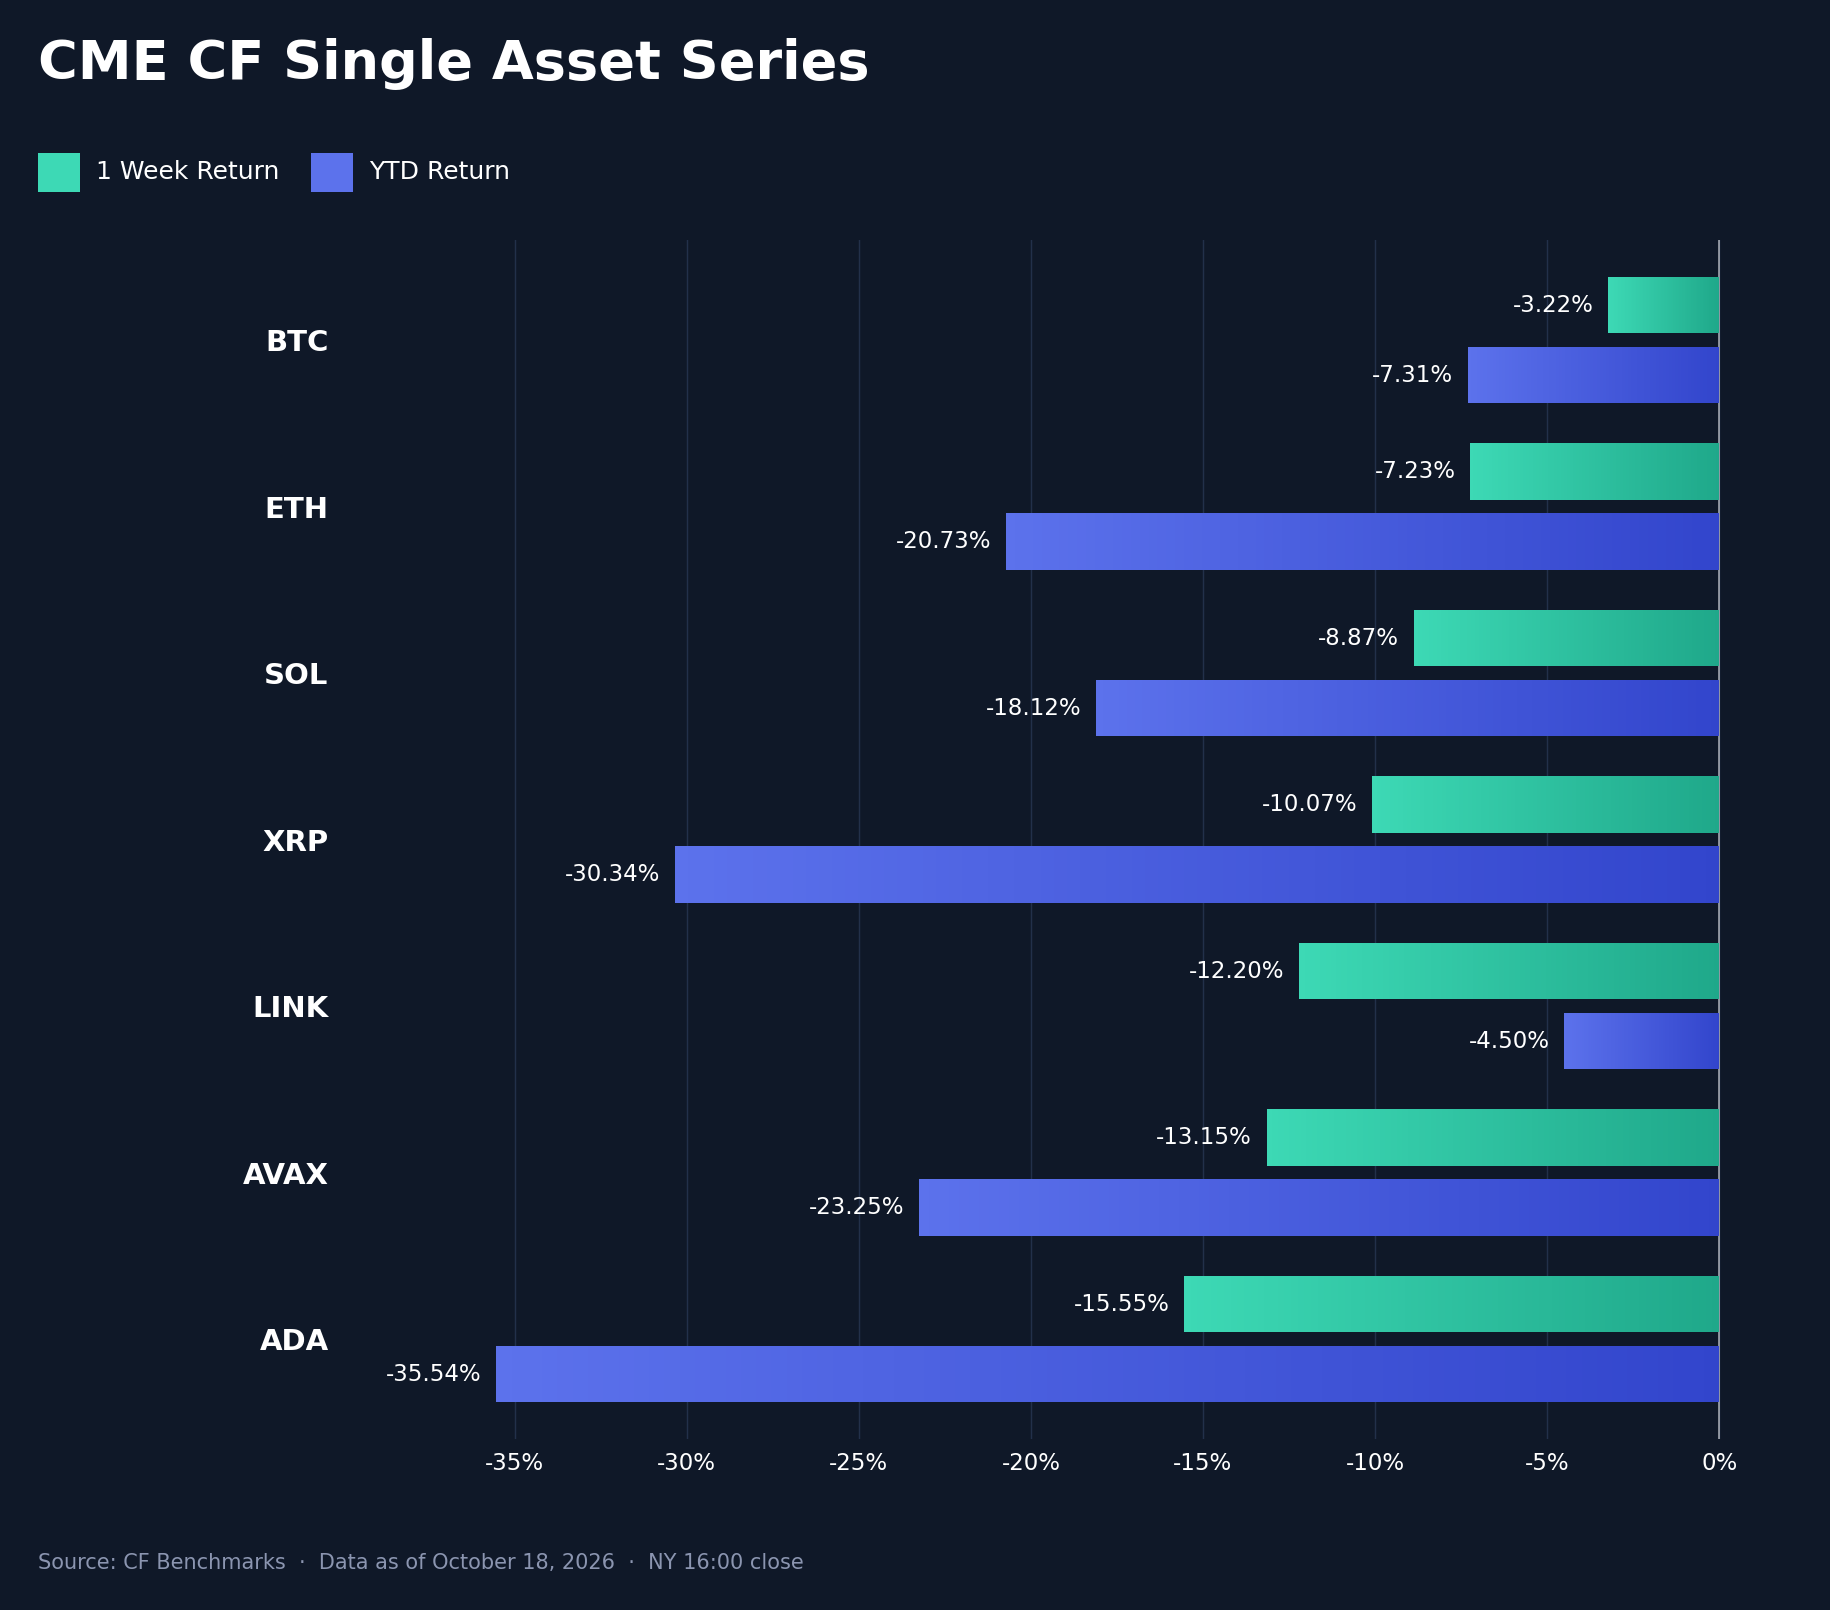
The CF Single Asset Series fell in all seven names, and the w/w range of 12.34 pp, from BTC's -3.22% to Cardano's (ADA) -15.55%, was wider than the prior week's 7.98 pp. Ether (ETH) lost 7.23%, Solana (SOL) 8.87%, XRP 10.07%, Chainlink (LINK) 12.20%, which took LINK to -4.50% year-to-date (YTD) from +8.77% and left no name in the set with a positive YTD return, and Avalanche (AVAX) 13.15%. ADA fell most after a 0.39% decline a week earlier, a 15.17 pp swing and the largest among the seven. BTC's NY fix moved from $83,623 to $80,935 and finished 0.62% below its 50-day average of about $81,441, after standing 3.28% above it a week earlier; it remains 11.70% above its 200-day average. Hot inflation data arrived mid-week: September CPI showed core prices up 0.3% month on month against 0.2% expected and headline inflation of 3.7% year on year against 3.6%, and PPI rose 6.3% year on year against about 5.3% expected. BTC's fix fell 1.77% on CPI day, the week's largest decline, but rose 0.87% on PPI day, when exchange prints took BTC below $80,000 intraday for the first time since mid-September before it recovered by the fix. The next two largest declines came on Friday (-1.32%), when the Nasdaq Composite fell 2.1%, and on Monday (-1.31%); each of the three was inside the 1.97% standard deviation of BTC's daily fix moves over the prior 90 days. Longer-dated rates did not confirm the move: the 10-year yield fell about 15 bps on the week to near 5.09%, even as the 2-year yield rose intraday on CPI day, and October hike odds that jumped from 21% to 47% on the CPI release were back in a 17% to 27% range by Friday, which is consistent with pressure running through risk appetite and positioning more than discount rates. ETH trailed BTC by 4.02 pp, against 4.15 pp a week earlier, consistent with $320.1 million of Ether ETF redemptions versus $228.4 million for Bitcoin funds and with ETH liquidations ($286.1 million) exceeding BTC liquidations ($215.5 million) within the roughly $939 million CoinGlass logged around the PPI release, 84.3% of it longs.
Volatility Analysis
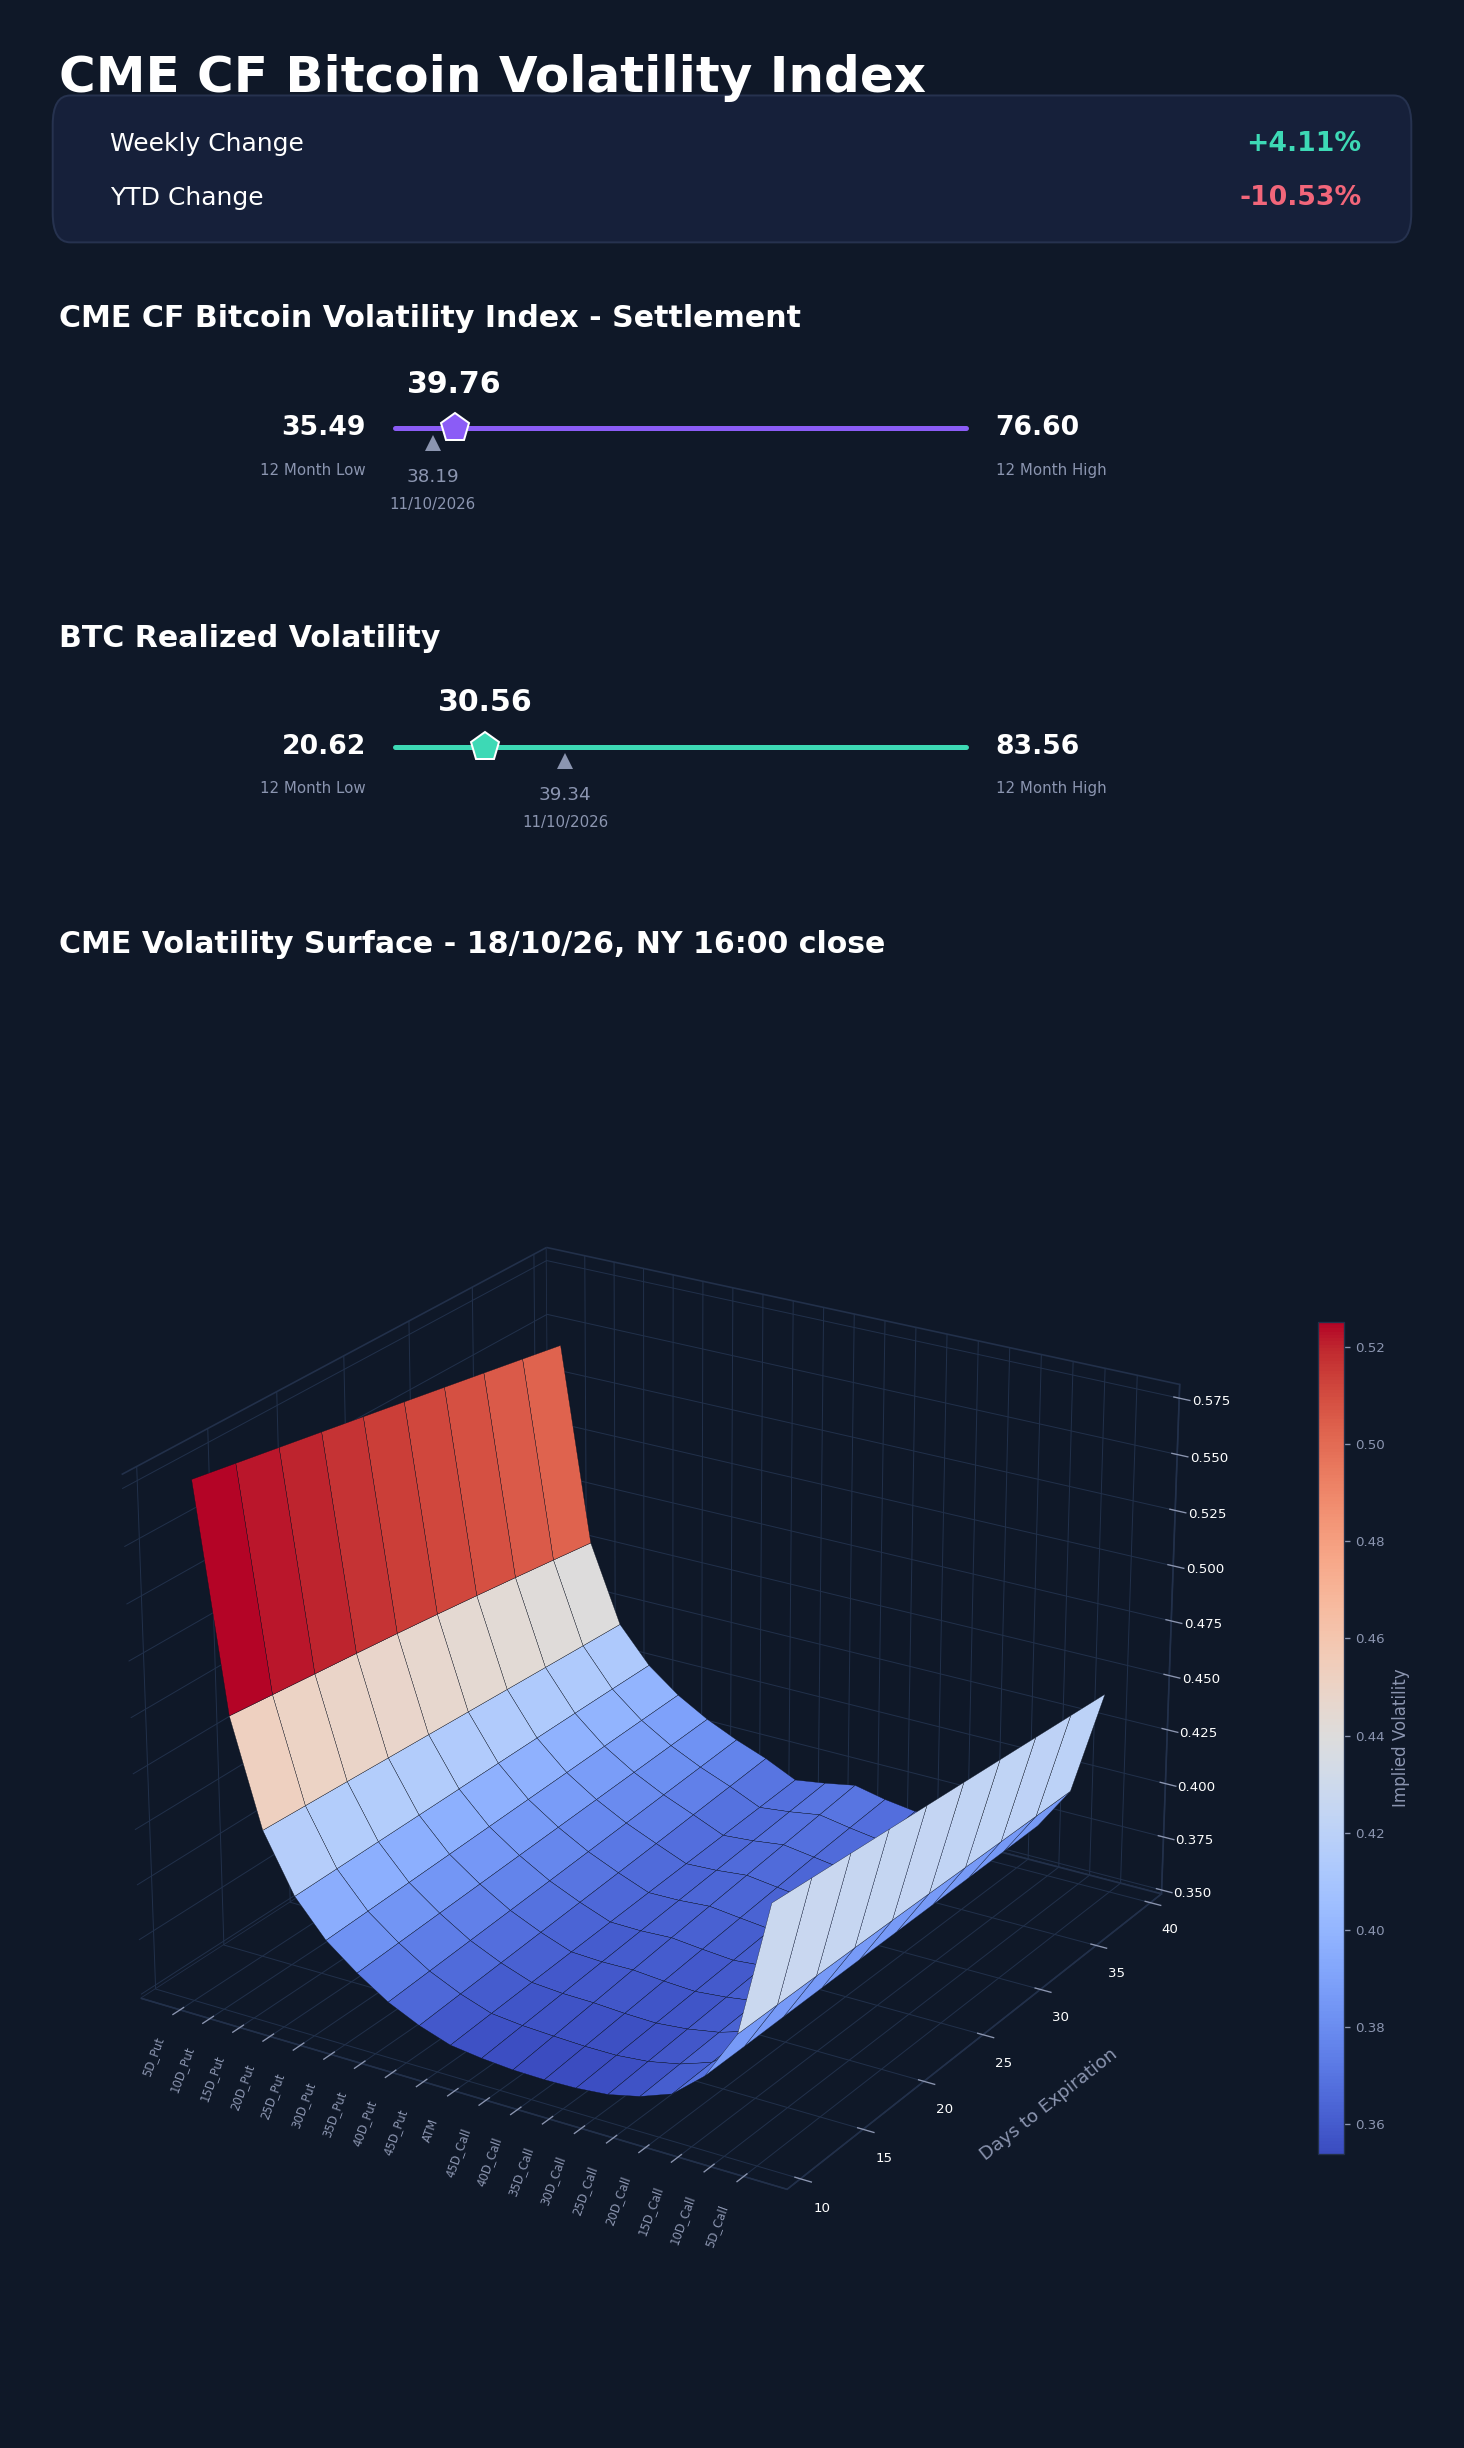
The CME CF Bitcoin Volatility Index Settlement (BVXS) rose 4.11% w/w to 39.76 on October 18th from 38.19, a 1.57 vol. point gain. Across the business week BVXS traded a 3.17 vol. point band, from 37.78 on Friday to 40.95 on Thursday, the PPI release day, when it stood 4.16 vol. points above 30-day realized volatility, the widest daily gap of the business week; it then fell 3.17 vol. points on Friday, a day BTC's fix fell 1.32%. Realized volatility fell to 30.56 from 39.34, with 6.52 vol. points of that 8.78 point decline arriving on Sunday alone as September 18th's 6.1% fix gain left the 30-day window, so the widening of the implied-minus-realized spread to 9.20 vol. points from -1.15 is largely mechanical. BVXS sat 4.27 vol. points above its trailing 12-month low of 35.49, within a 35.49-to-76.60 range, and 10.53% below its 44.44 start-of-year reference, while realized volatility sat 9.94 vol. points above its 12-month low of 20.62. The wings moved more than the index level. Comparing this week's NY 16:00 capture with the prior week's, row against row on different tenor grids, the 11-day row's at-the-money implied volatility rose 1.79 vol. points to 35.42 against the prior 18-day row, while the 5-delta put premium over at-the-money widened to 22.22 from 17.37, the 5-delta call premium to 10.43 from 8.02 and the 25-delta put premium to 3.32 from 2.38. At the longest rows (39 days now, 46 days a week ago) at-the-money volatility was little changed at +0.26, and the 5-delta put premium moved to 17.60 from 16.39 and the 5-delta call premium to 7.44 from 8.60. Short-dated premium shifted into both wings, with puts leading. The exhibit uses the NY 16:00 capture on an 11-to-39-day grid.
Market Cap Index Performance
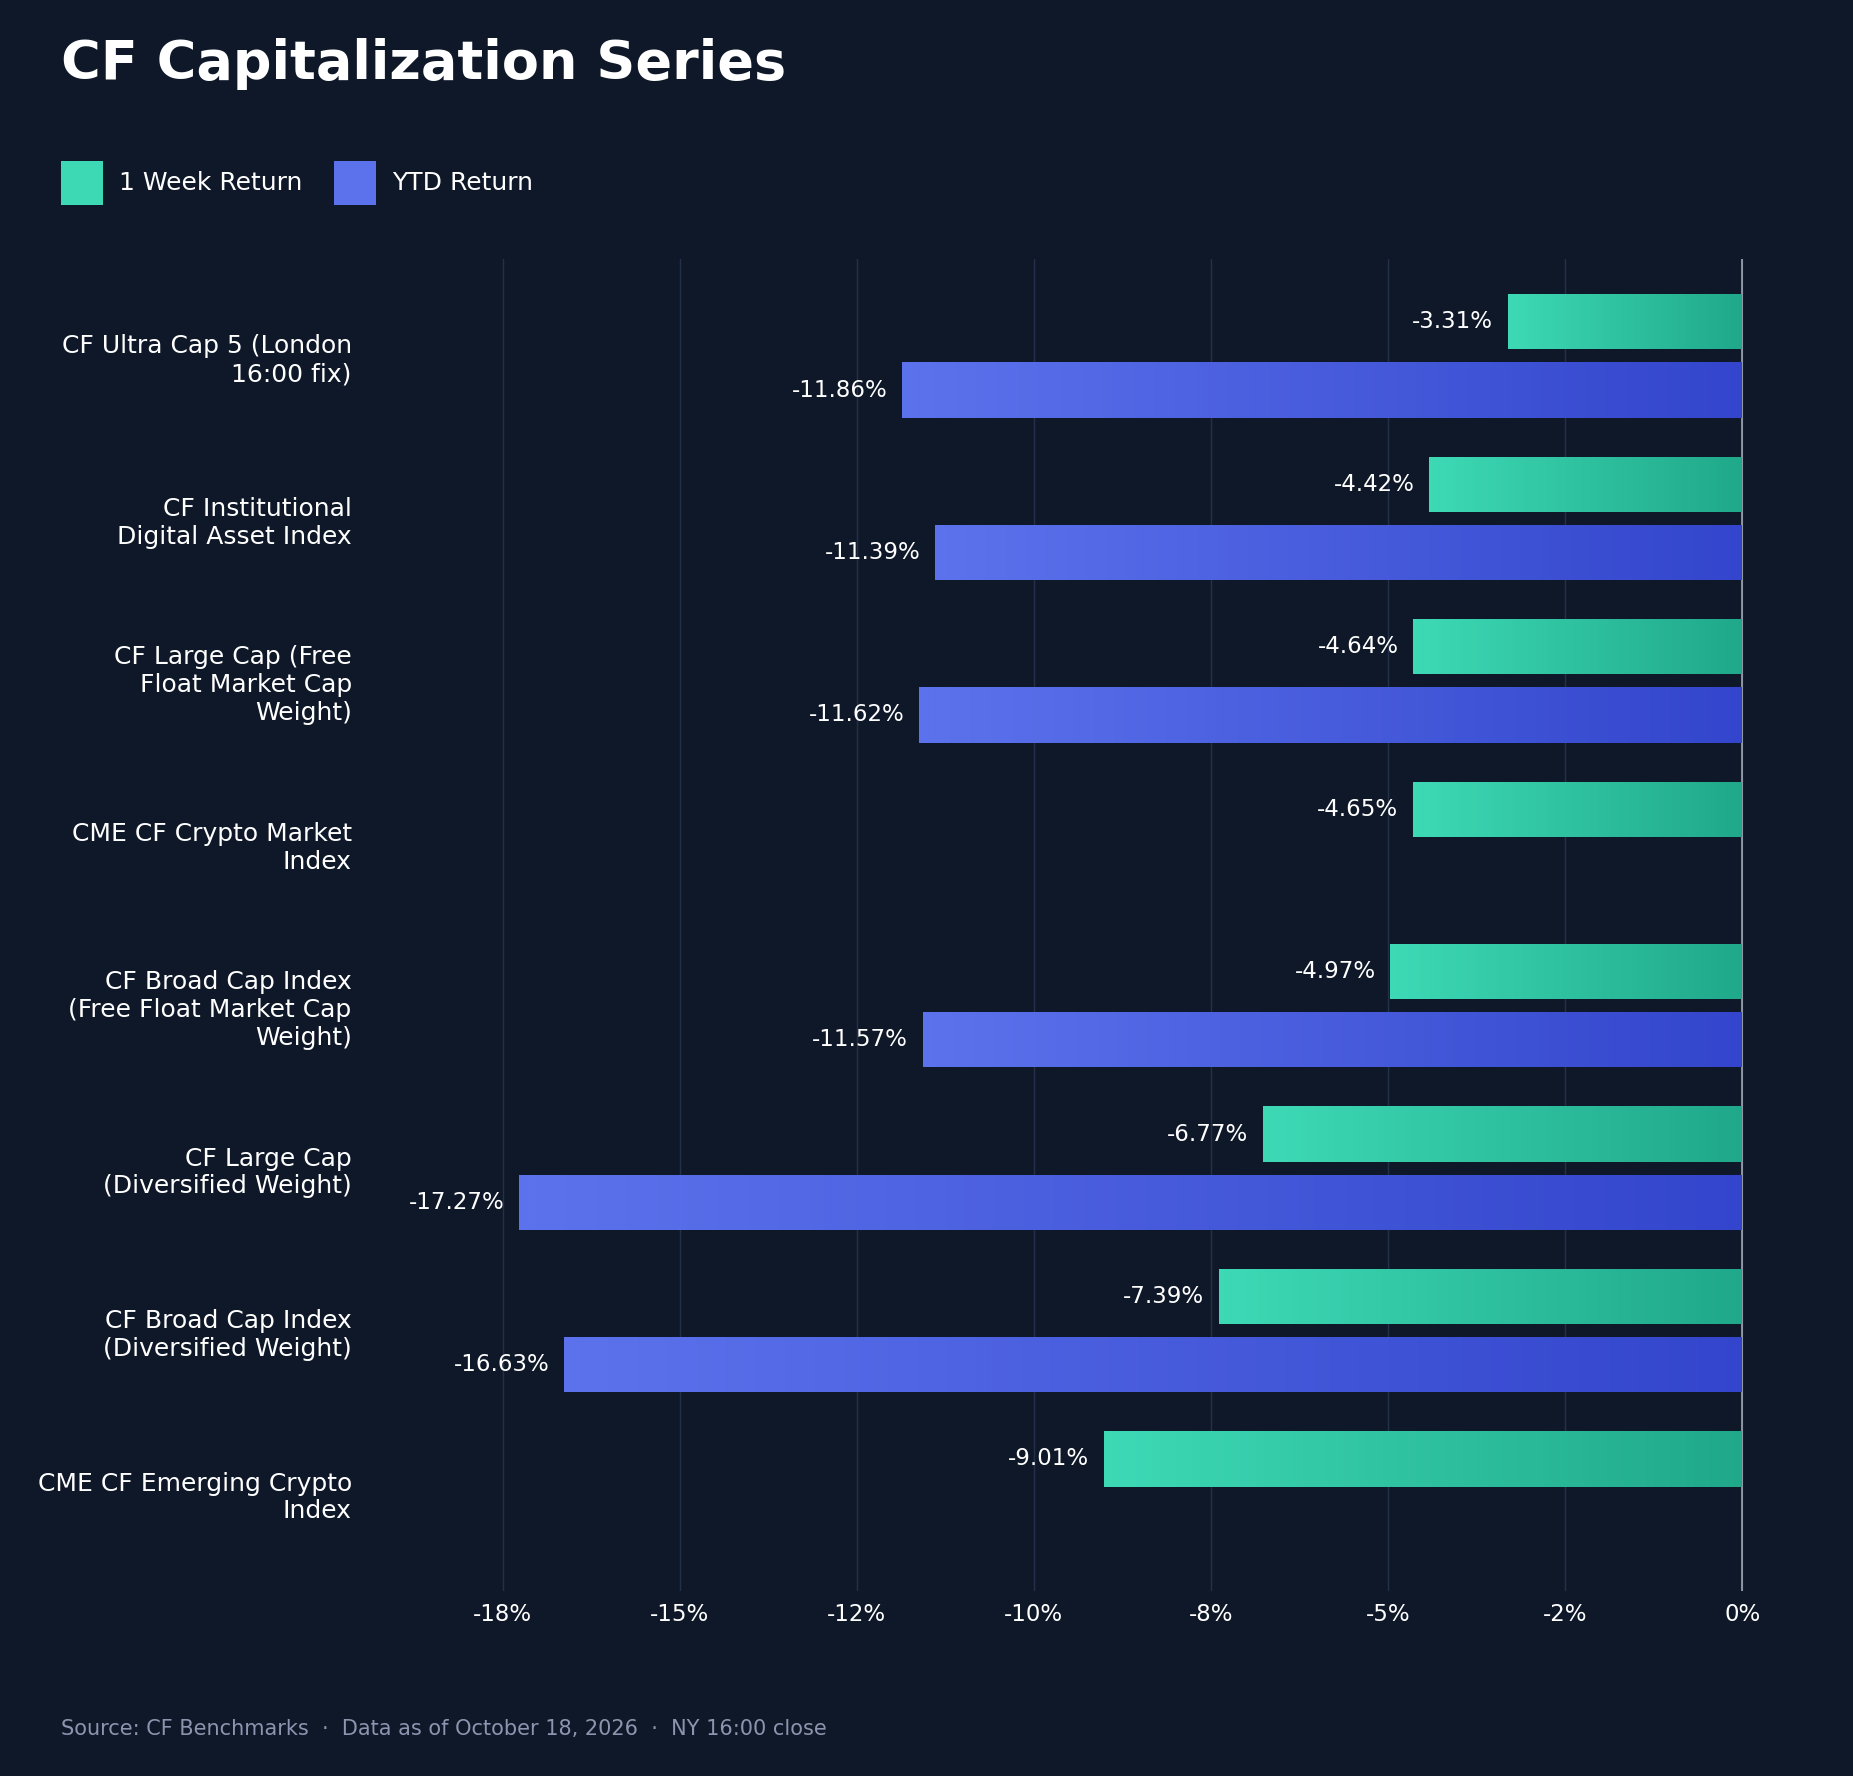
All eight CF Capitalization Series indices fell for a second week. The seven on the NY fix ranged from the CF Institutional Digital Asset Index at -4.42% (YTD -11.39%) to the CME CF Emerging Crypto Index at -9.01%, a 4.59 pp range against 2.97 pp a week earlier. The four that fell least clustered within 0.55 pp: CF Large Cap (Free Float Market Cap Weight) fell 4.64% (YTD -11.62%), the CME CF Crypto Market Index 4.65% and CF Broad Cap Index (Free Float Market Cap Weight) 4.97% (YTD -11.57%). The diversified indices fell further, CF Large Cap (Diversified Weight) by 6.77% (YTD -17.27%) and CF Broad Cap Index (Diversified Weight) by 7.39% (YTD -16.63%), and trailed their free-float counterparts by 2.12 pp and 2.42 pp against 1.45 pp and 1.40 pp a week earlier. Diversified weighting gives smaller names more influence, so the wider gaps and the Emerging Crypto result point to the smaller names carrying the losses. CF Ultra Cap 5, which has no NY-close variant and stays on its London 16:00 fix, fell 3.31% (YTD -11.86%) and is not comparable with the others. In equities, the Nasdaq Composite fell 4.5% and the Russell 2000 3.0% in the week to Friday on AI infrastructure credit concerns and a chip sell-off in Seoul while the Dow rose 0.7%. Jobless claims of 199,000 were a fifth straight week below 200,000, and the Empire State manufacturing index came in at 25.5 against 10.25 expected.
Factors Analysis
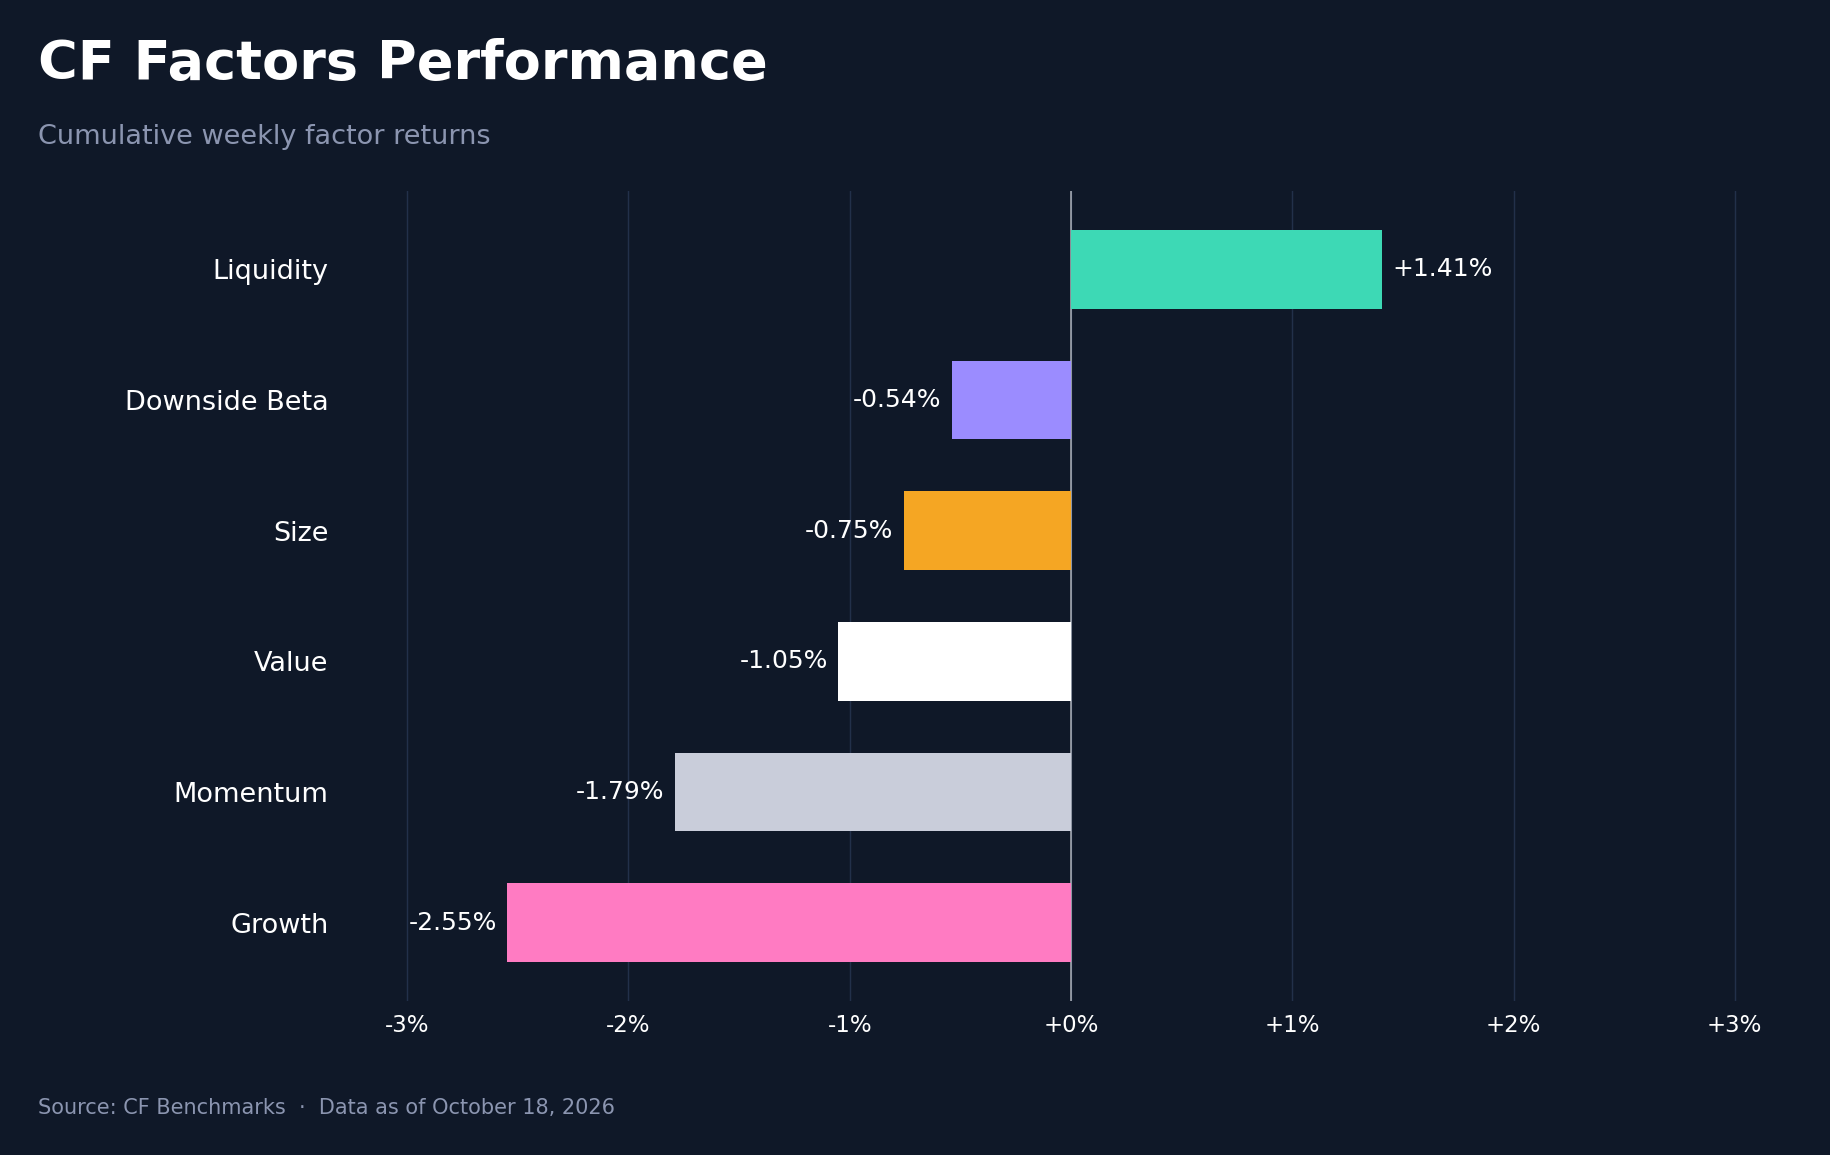
Liquidity was the only CF factor with a positive cumulative return, at +1.41%, followed by Downside Beta at -0.54%, Size at -0.75%, Value at -1.05%, Momentum at -1.79% and Growth at -2.55%. The range widened to 3.95 pp from 2.56 pp. Momentum recorded the largest decline, falling 2.07 pp from +0.28%, and Size, last week's leader at +0.72%, lost 1.48 pp to finish third. Liquidity is scored on turnover, so a positive print means lower-turnover assets outperformed, and a negative Size print means larger assets beat smaller ones; the pair describes large, low-turnover names holding up best, consistent with BTC's relative resilience in the single-asset series. Liquidity improved 2.36 pp from -0.96% and earned its lead over the weekend: it stood at -0.86% cumulative through Friday, then gained 0.89% on Saturday and 1.38% on Sunday, while Size stood at +0.92% through Friday before losing 0.72% and 0.95%. Downside Beta, where a positive print favors low-downside-beta assets, improved 1.30 pp from -1.84% but stayed negative, so there was no rotation toward defensive names despite the drawdown. Growth was the weakest factor, losing 1.05% on Monday and 1.22% on Tuesday.
Read our latest weekly crypto factors report: Factor Friday - October 16, 2026
Classification Series Analysis
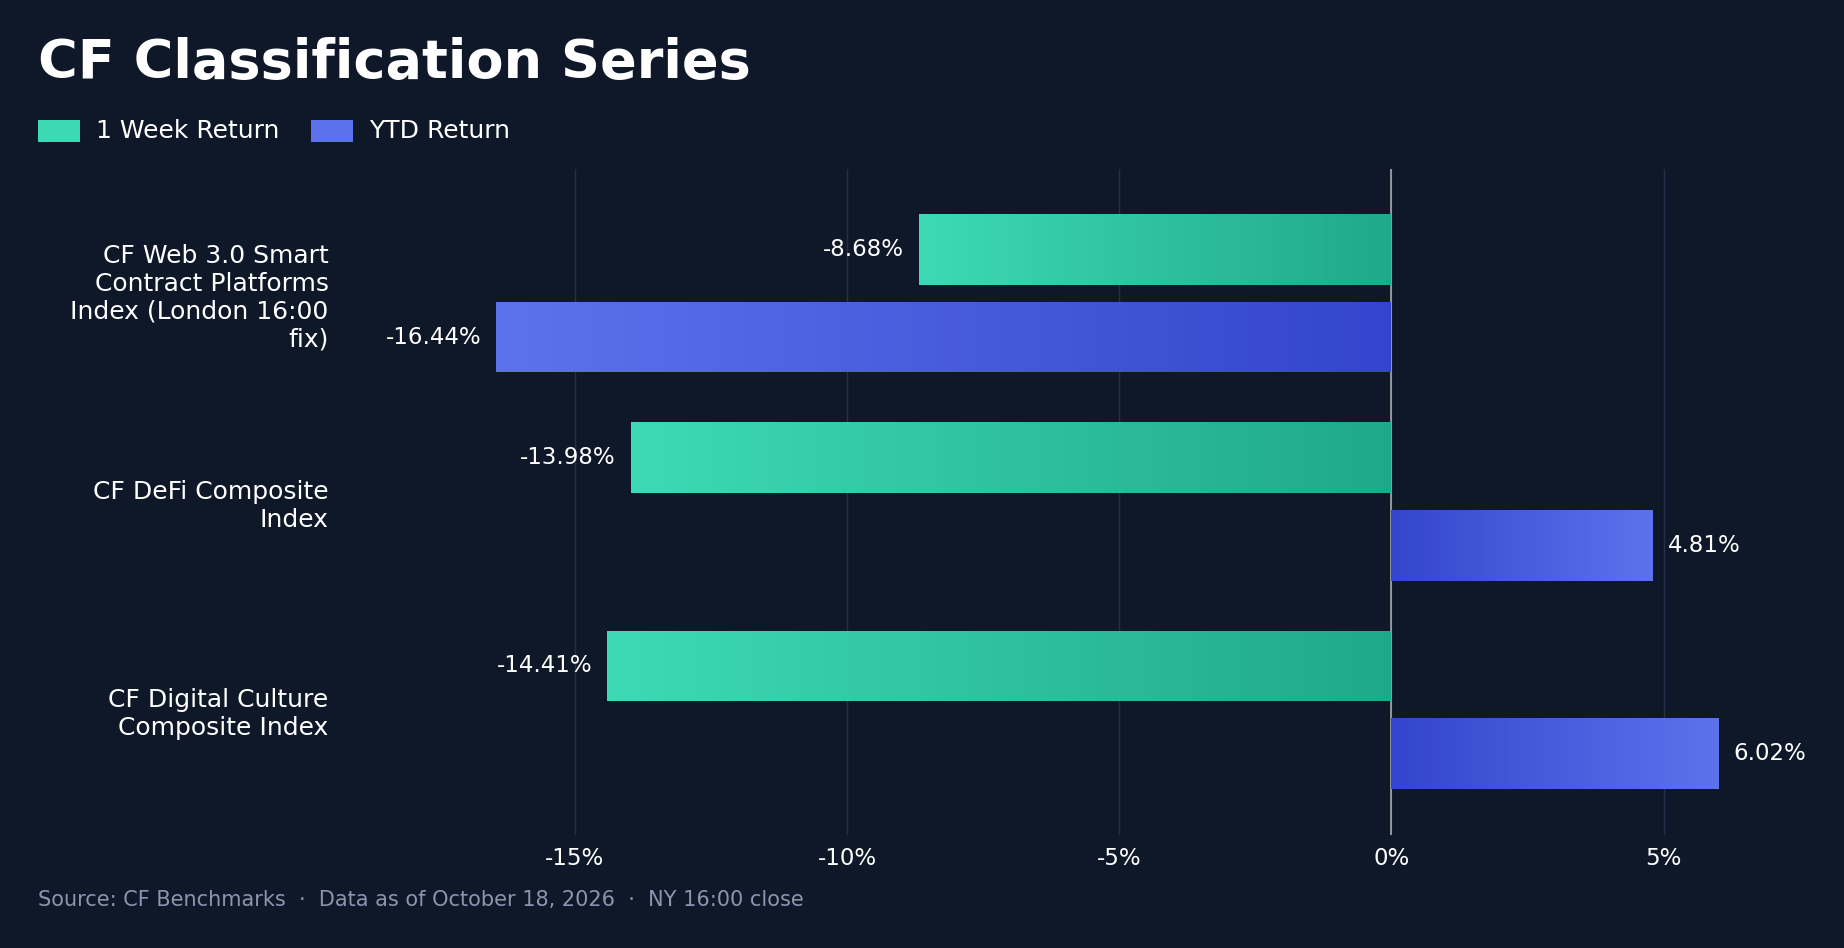
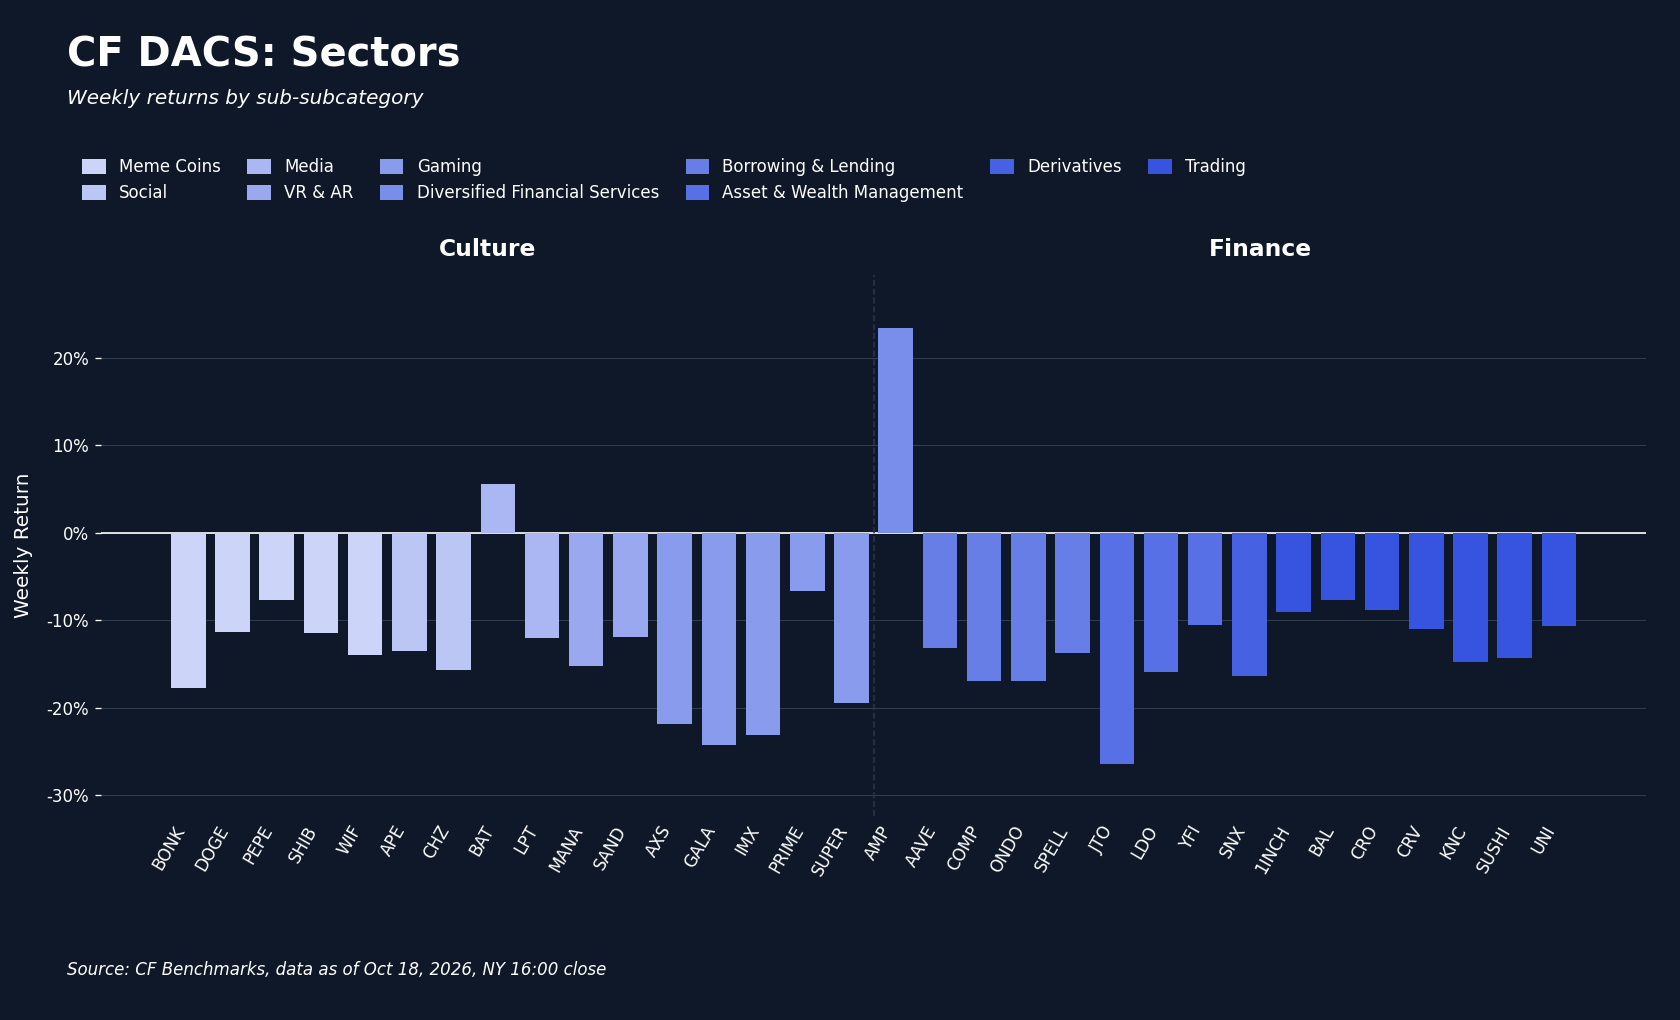
The two CF Classification Series indices on the NY fix fell by similar amounts: the CF DeFi Composite Index lost 13.98% (YTD +4.81%) and the CF Digital Culture Composite Index 14.41% (YTD +6.02%), 0.43 pp apart. Digital Culture, which rose 3.10% last week, swung 17.51 pp lower, and its YTD lead over DeFi narrowed to 1.21 pp from 2.03 pp as DeFi's YTD return fell 17.03 pp from +21.84%. Digital Culture's loss was broad, with 15 of the 16 CF DACS Culture constituents with a weekly return falling and gaming names such as GALA, IMX and AXS down more than 20%. DeFi's decline was accompanied by 15 of 16 DACS Finance constituents falling, detailed below. The CF Web 3.0 Smart Contract Platforms Index, which has no NY-close variant and stays on its London 16:00 fix, lost 8.68% (YTD -16.44%) and is not comparable with the two indices above.
Sector Analysis
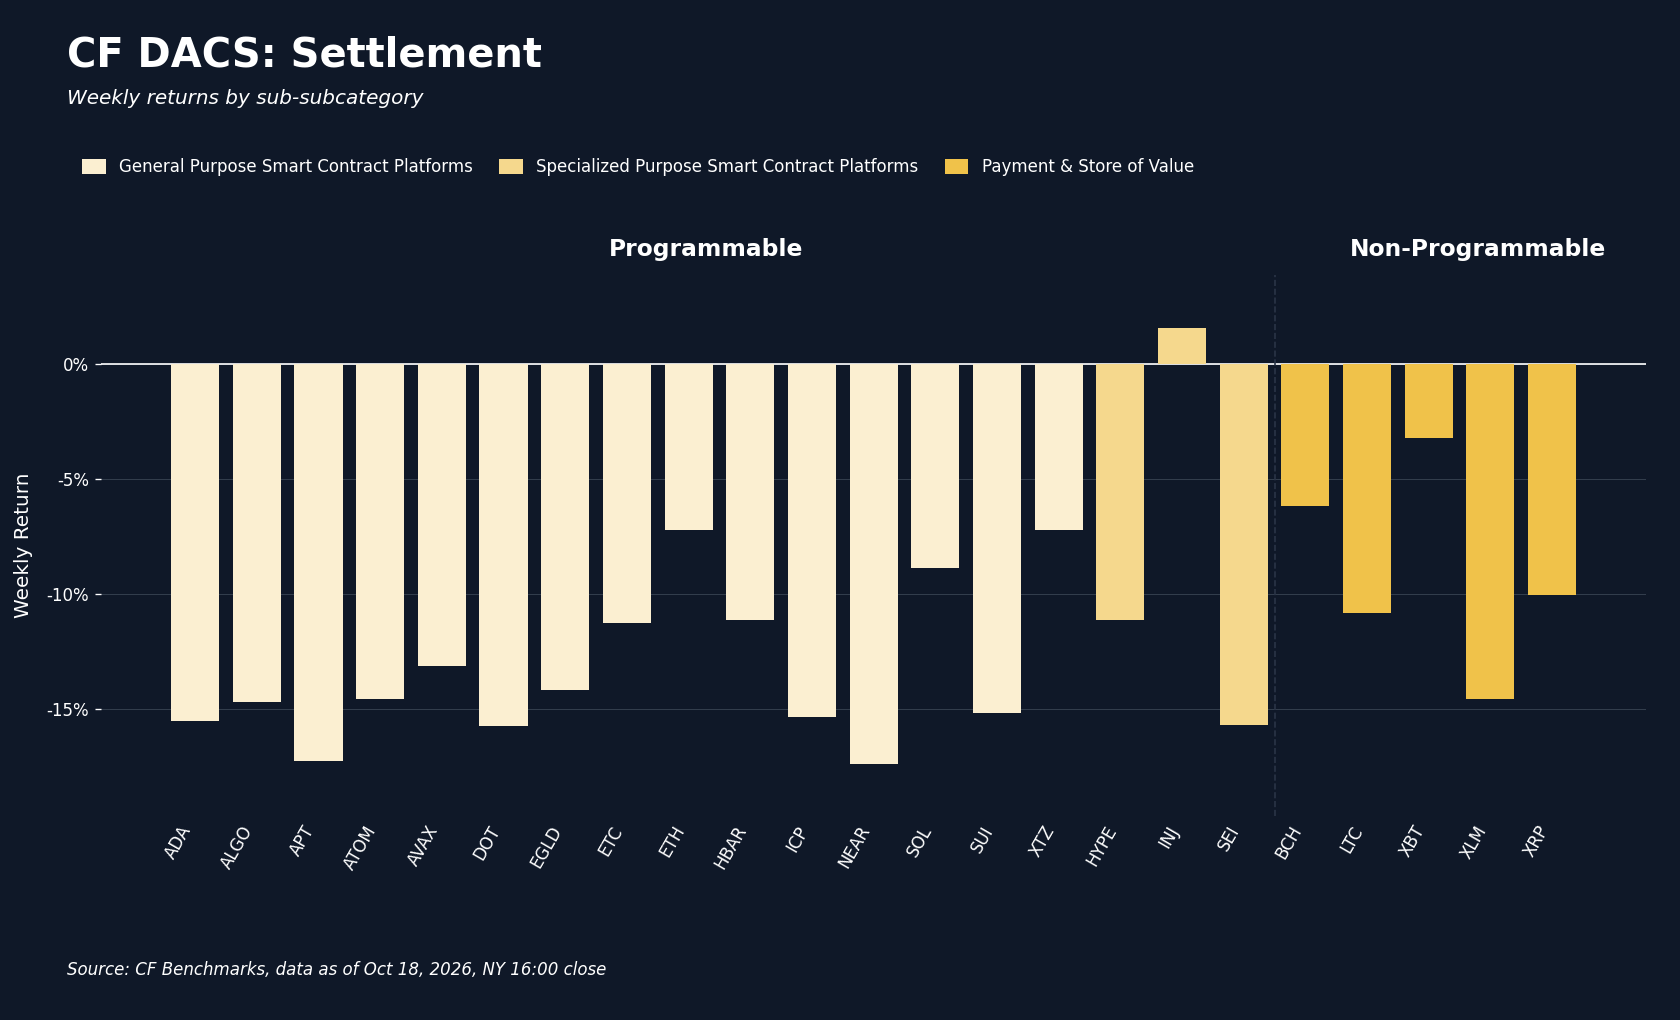
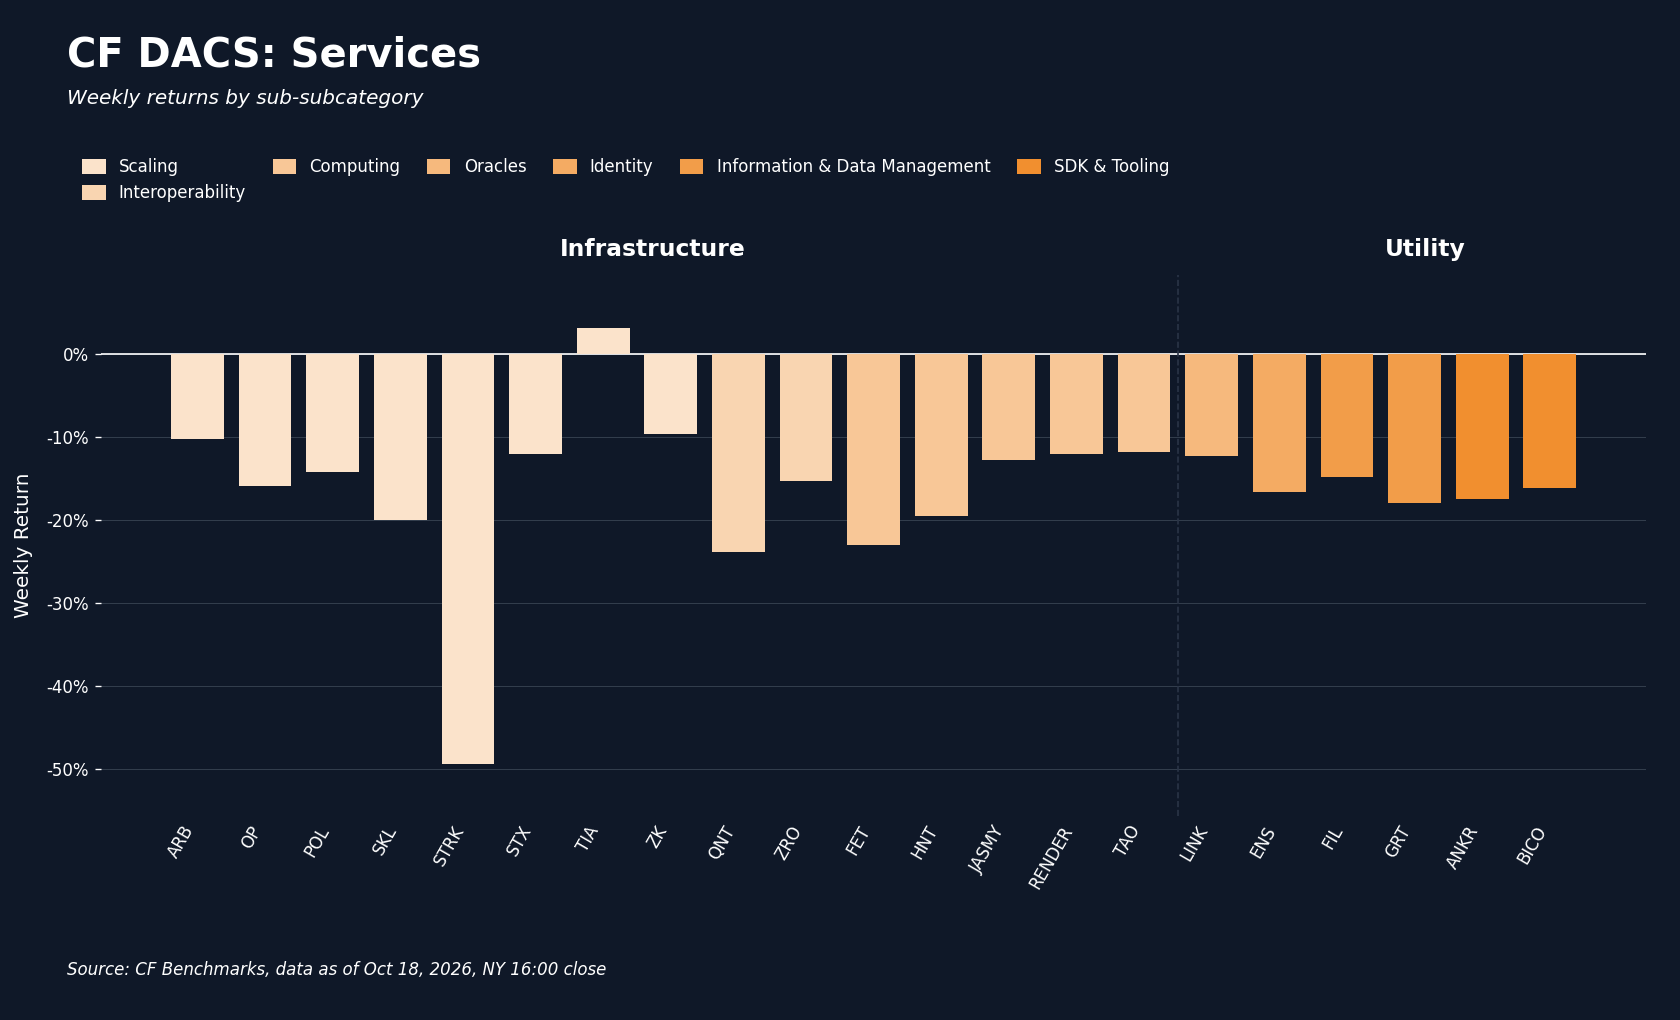
All six CF DACS sub-categories fell, and the top and bottom places swapped from the prior week: Non-Programmable led at -8.98%, followed by Finance at -11.43%, Programmable at -12.46%, Culture at -13.76%, Utility at -15.82% and Infrastructure at -16.40%, which had been first at +8.83%, a 25.23 pp swing. Only four of the 76 constituents with a weekly return gained: Amp (AMP) at +23.44% in Finance, Basic Attention Token (BAT) at +5.61% in Culture, Celestia (TIA) at +3.23% in Infrastructure and Injective (INJ) at +1.57% in Programmable. Starknet (STRK) fell 49.35%, the weakest constituent, and its gap to AMP was the widest token-level spread at 72.79 pp. STRK gave back last week's rally, finishing 9.11% above its October 4th fix; its largest daily fix decline, 18.69%, came on October 12th, the day after its peak, and the October 15th fix, on the day of a scheduled 127 million token unlock per Tokenomist, rose 15.50%, while we found no project-specific event behind the fall. STRK alone accounts for 2.35 pp of Infrastructure's average, which would be -14.04% without it. TIA, the sub-category's only gainer, jumped 16.46% between the October 15th and 16th fixes, coinciding with Celestia's October 16th launch of Eden, an experimental EVM chain for AI agents that uses TIA as its gas token, then gave back 11.25% over the next two fixes; as one of 15 names it lifted the average by only 1.40 pp. Non-Programmable led because BTC and Bitcoin Cash (BCH, -6.18%) were the fifth and sixth best constituents in the universe, offsetting Stellar (XLM) at -14.60% and XRP. Behind STRK, Jito (JTO, -26.38%), GALA (-24.26%) and QNT (-23.86%) were the weakest names, and we found no confirmed catalyst for BAT, which gained a second week after a 53.26% rise, or for AMP.
CF Staking Series
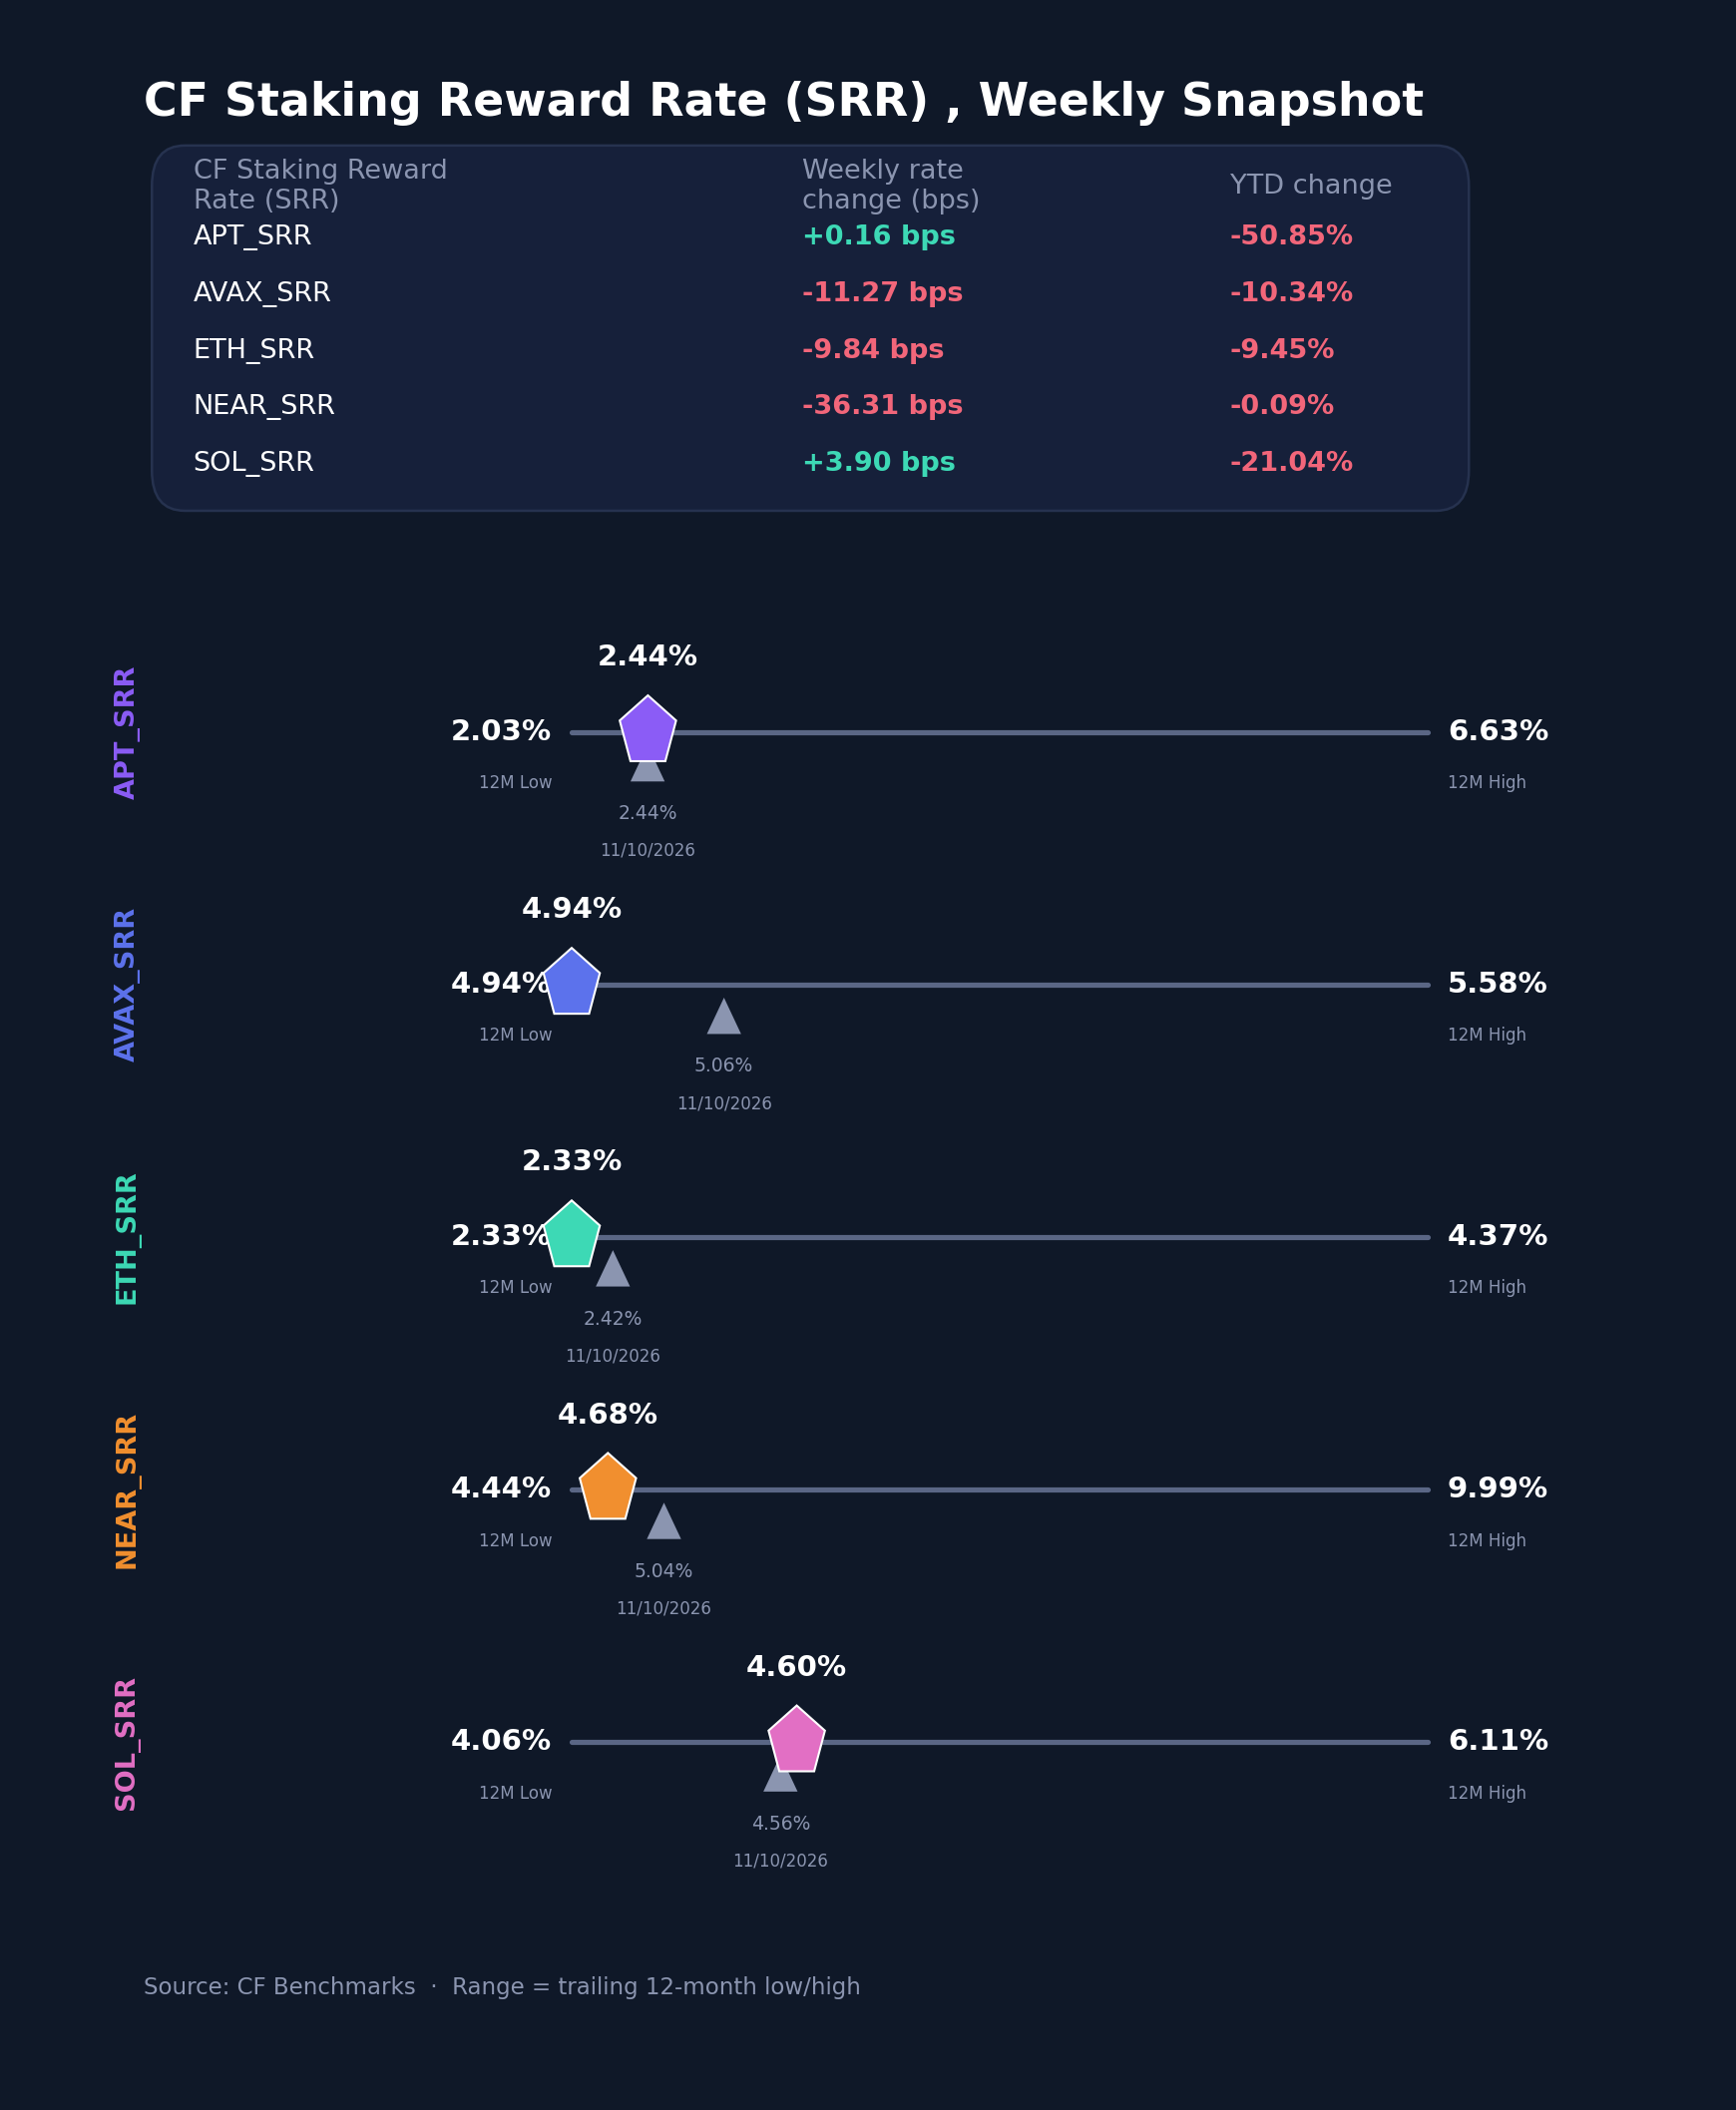
The CF Staking Series split by the direction of reward rates. By relative index return, SOL gained 0.86% and APT 0.07%, while AVAX fell 2.23%, ETH 4.06% and Near Protocol (NEAR) 7.20%, and the index return followed the sign of the rate change in all five series. NEAR's reward rate fell 36.3 bps to 4.6774% from 5.0405%, AVAX's 11.3 bps to 4.9427% from 5.0554% and ETH's 9.8 bps to 2.3257% from 2.4241%, with AVAX and ETH both closing at 12-month lows, while SOL's rose 3.9 bps to 4.5993% from 4.5603% and Aptos's (APT) 0.2 bps to 2.4391% from 2.4375%. The rate range across the five assets, from ETH's 2.3257% to AVAX's 4.9427%, was 2.62 pp against 2.63 pp a week earlier, so the spread between the highest and lowest rates held while the levels moved. These are relative changes in the rate series, not staking income earned.
Interest Rate Analysis
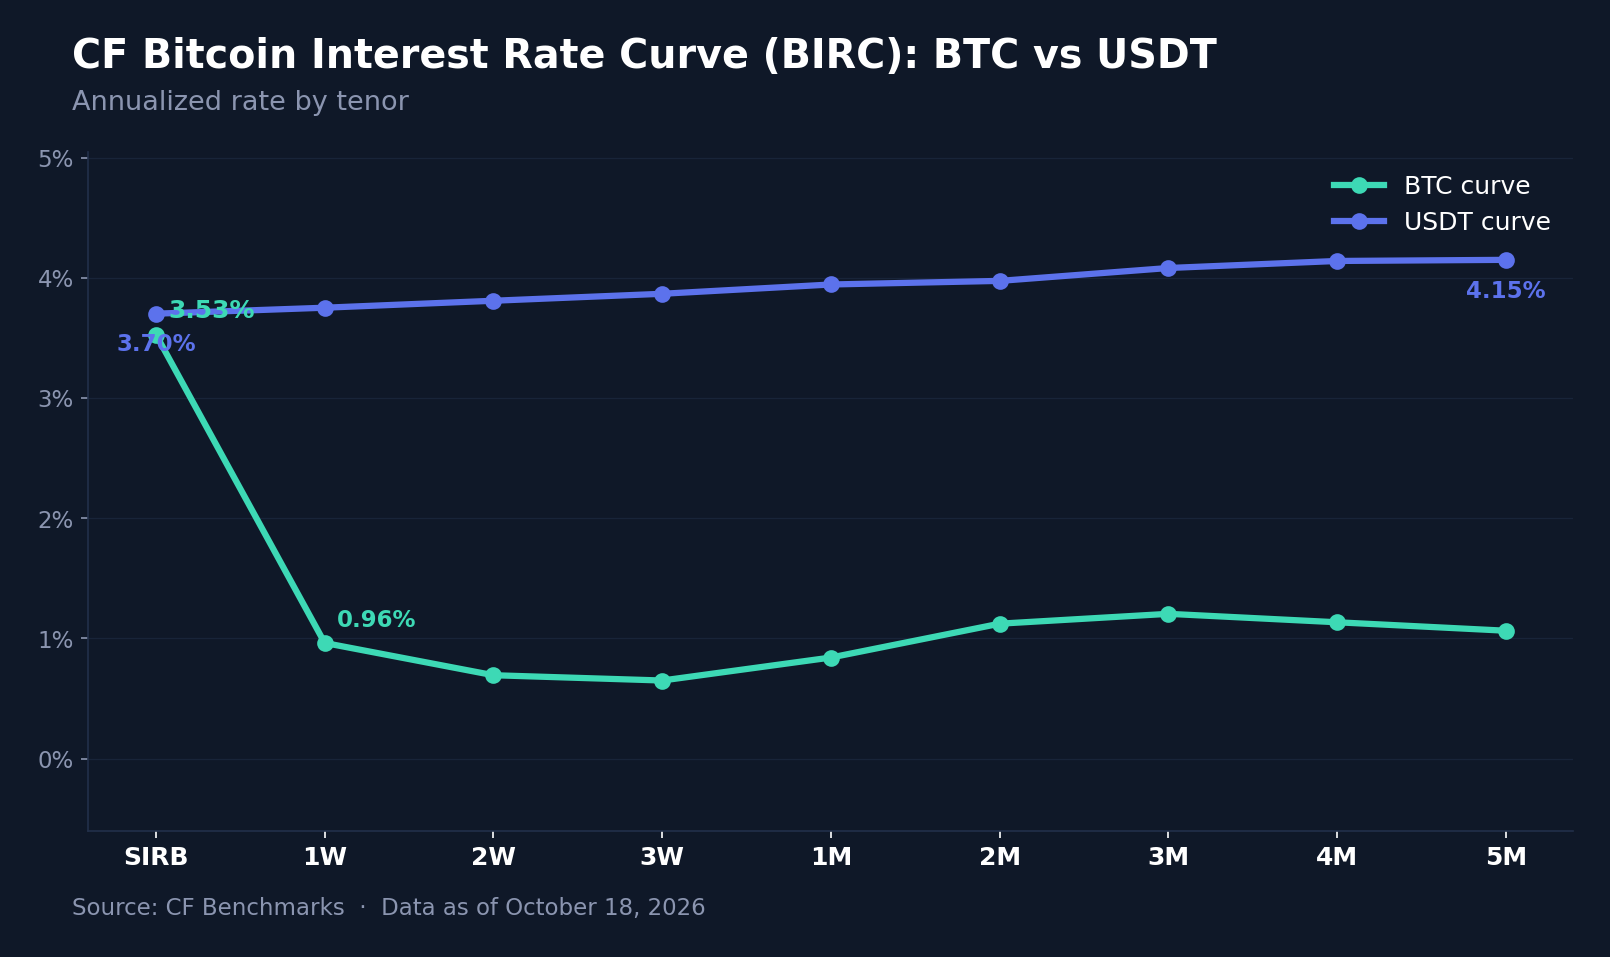
The USDT and BTC curves of the CF Bitcoin Interest Rate Curve (BIRC) diverged on the weekly-average basis. The Tether (USDT) curve shifted down by 89.9 to 94.1 bps at every tenor, with the Short-term Interest Rate Benchmark (SIRB) averaging 3.7016% against 4.6423% and the 5-month (5M) tenor 4.1495% against 5.0487%, and it kept its upward slope, rising 44.8 bps from SIRB to 5M. Most of that decline is last week's spike leaving the comparison: USDT SIRB printed 7.77% on October 6th and 5.94% on October 7th, and measured Sunday to Sunday it fell only 34.7 bps, to 3.6123% from 3.9595%. The BTC curve was the idiosyncratic one. BTC SIRB averaged 3.5276% against 5.0427%, down 151.5 bps, but the average conceals a daily slide from 12.0610% on Monday to 0.0198% on Friday and Saturday, with 0.7607% on Sunday, and the shorter BTC tenors printed zero on several days, so the 1-week to 1-month averages are not read as funding levels. The 3-month (3M), 4-month (4M) and 5M tenors, which printed consistently, rose 57.2, 49.2 and 41.2 bps to 1.2049%, 1.1346% and 1.0643%, leaving the BTC curve 287.7 to 308.5 bps below USDT at those tenors and easing from its 3M peak. No single event in the week explains the BTC front-end slide, which was under way by Tuesday, before the CPI release, whereas USDT SIRB stayed between 3.6123% and 3.8308% after last week's spike.
Closing Synthesis
The week was a test of Bitcoin's 50-day average across several down sessions, with two hot inflation prints and a Friday equity sell-off in the background and no follow-through in the 10-year yield. The sell-off scaled with distance from BTC, from the diversified indices to Emerging Crypto and the Starknet unwind, and the factor table favored larger, lower-turnover assets over smaller ones. Short-dated tail premiums widened while realized volatility fell mechanically, and the BTC front end of the interest-rate curve emptied while USDT SIRB held in a narrow band.
The information contained within is for educational and informational purposes ONLY. It is not intended nor should it be considered an invitation or inducement to buy or sell any of the underlying instruments cited including but not limited to cryptoassets, financial instruments or any instruments that reference any index provided by CF Benchmarks Ltd. This communication is not intended to persuade or incite you to buy or sell security or securities noted within. Any commentary provided is the opinion of the author and should not be considered a personalised recommendation. Please contact your financial adviser or professional before making an investment decision.
Note: Some of the underlying instruments cited within this material may be restricted to certain customer categories in certain jurisdictions.
Altcoins Lag as Bitcoin Tests The 50-Day Moving Average
Digital assets fell broadly over the past week as Bitcoin slipped to a moving average, with inflation prints and an equity sell-off in the background. Losses grew with distance from Bitcoin, hitting diversified and smaller-cap exposure hardest, while implied volatility rose.

Mark Pilipczuk
Factor Friday - October 16, 2026
Size led the factor table for a third week at 0.59% as the Market rebounded 0.40% and 15 of 35 Broad Cap tokens closed higher. Momentum fell 1.58% in a rebound led by laggards, and Size's weekly print has narrowed from 8.86% to 0.59% in three weeks, even as its year-to-date lead holds at 22.81%.
Mark Pilipczuk
Launch of the CF HODLife HARD Index
The Administrator announces the launch of the CF HODLife HARD Index, a co-branded benchmark developed by CF Benchmarks and HODLife, an insurance technology company.
Mark Pilipczuk
By clicking Accept, you consent to CF Benchmarks's use of cookies.
Visit Cookie Settings to learn how CF Benchmarks uses cookies and to adjust your preferences.