
Nov 09, 2026
Crypto's Post Midterm Sell-Off
Weekly Index Highlights, November 2, 2026
The semiconductor sell-off that followed the US midterm elections bled over into the digital asset market, and crypto sat out the partial recovery in equities that came after it. The CME CF Crypto Market Index (CMI) first rallied on the result, up 3.14% through Wednesday's close as markets treated the Democratic sweep as the end of election uncertainty, but the advance stalled with Bitcoin (BTC) 2.3% below its 50-day average. On Thursday, November 5th, the Nasdaq 100 fell 6.36%, its worst day since 2020, and CMI dropped 5.25%, more than its full 2.97% week-on-week (w/w) decline. BTC ended the week 0.4% above its 50-week average, and the losses reached well past the largest names, with the diversified indices behind their free-float counterparts and every CF DACS sub-category down between 5.0% and 7.9%.
Market Performance Update
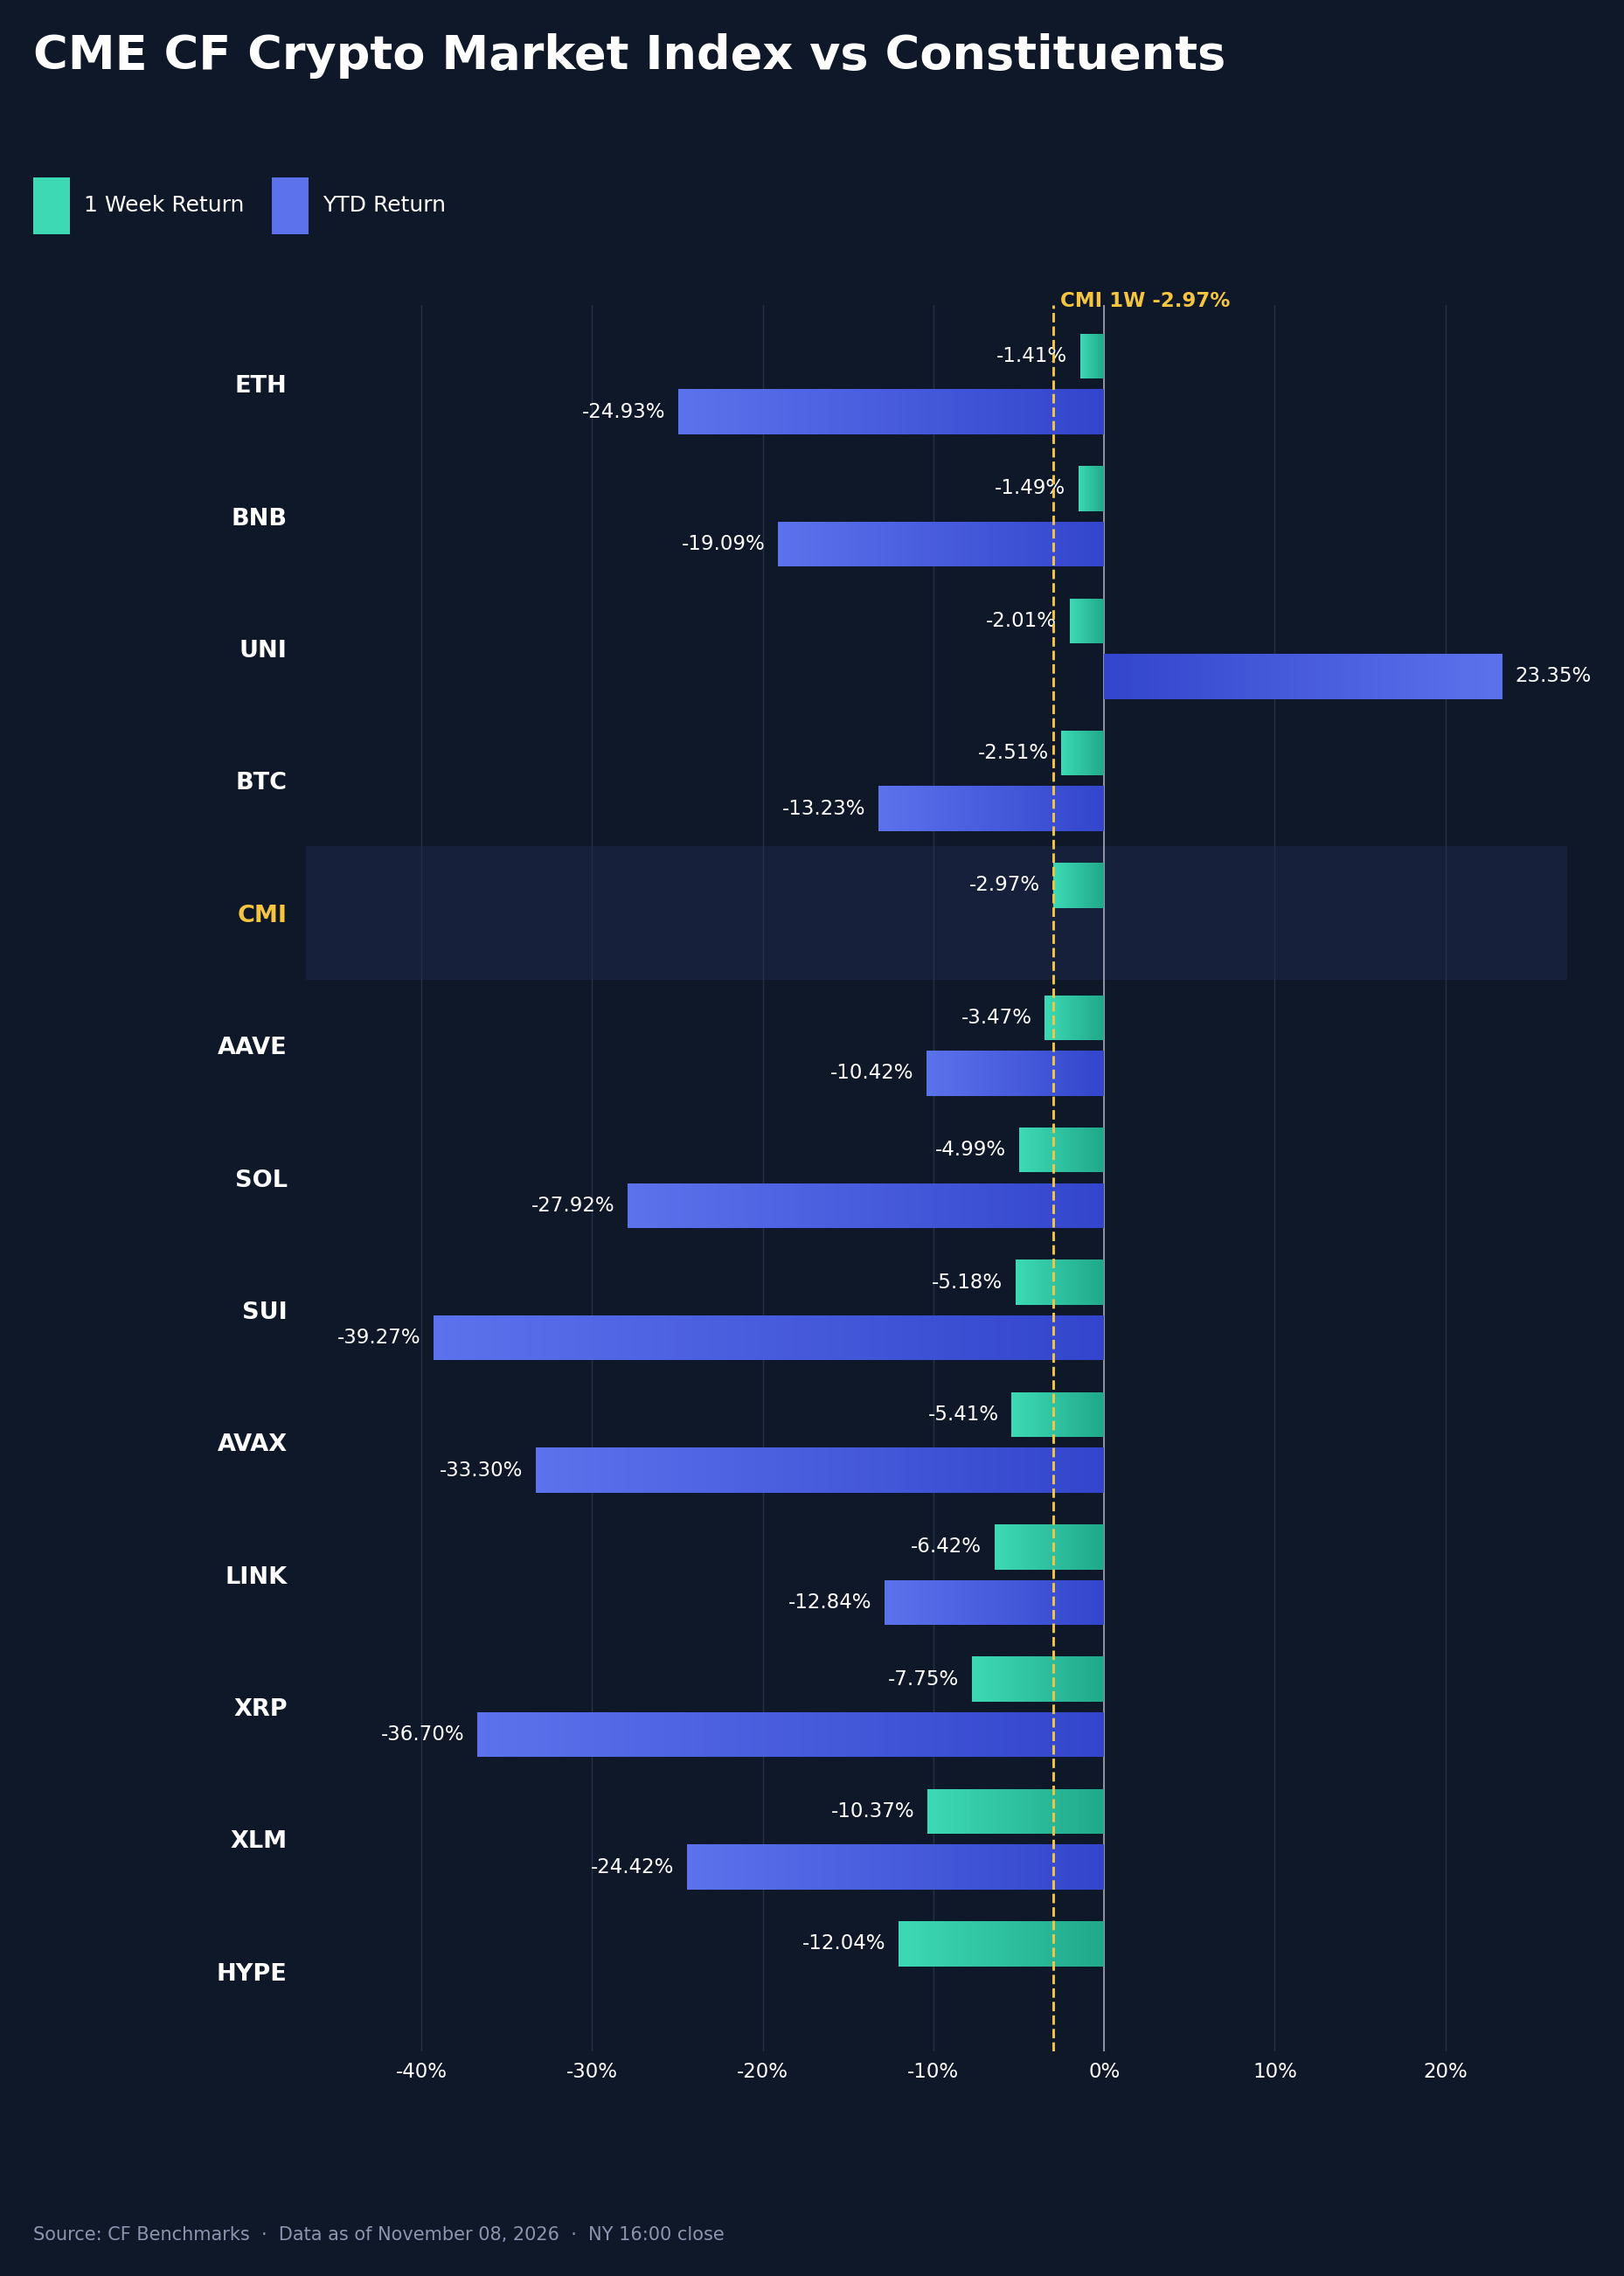
CMI fell 2.97% w/w from November 1st to November 8th, after a 3.28% decline a week earlier, and equities set the path. The index slipped 1.17% on Monday as AI-spending and hyperscaler-debt worries pulled the Nasdaq 100 down 1.39%, then rose 1.24% on Election Day and 3.08% on Wednesday as results came in and oil fell 8% to 9%. Thursday's AI-chip sell-off reversed those gains. Semiconductors fell 11.2%, a move AP coverage tied to fears of data-center moratoriums and tighter AI rules after the vote, alongside existing AI-bubble and borrowing-cost concerns, and the VIX rose from 16.61 to 28.18. About $1.09 billion of crypto positions were liquidated over 24 hours, nearly 89% of them longs. Ether (ETH) led the constituents at -1.41%, 1.56 percentage points (pp) ahead of the market, after a 5.60% gain on Wednesday, followed by BNB at +1.49pp, Uniswap (UNI) at +0.96pp and BTC at +0.47pp with a 2.51% decline. Aave (AAVE) trailed by 0.50pp, Solana (SOL) by 2.01pp, Sui (SUI) by 2.21pp, Avalanche (AVAX) by 2.44pp and Chainlink (LINK) by 3.45pp. XRP lagged by 4.77pp at -7.75%, including a further 4.99% fall on Friday, and Stellar (XLM) by 7.39pp. Hyperliquid (HYPE) was weakest at -12.04%, 9.07pp behind, giving back the prior week's gain and leaving a 10.63pp spread to ETH. BTC subtracted 1.81pp from the index return and the rest of the basket 1.16pp, about 0.35pp each from XRP and HYPE. On a year-to-date (YTD) basis BTC is down 13.23%, ETH 24.93% and XRP 36.70%, while UNI is up 23.35%. The majors did not follow the Nasdaq 100's 1.35% rebound on Friday. That day's October payrolls gain of 165,000, against 65,000 expected, left December hike odds at 76.8%, and spot Bitcoin ETF redemptions reached $1.28 billion for the week.
Volatility Analysis
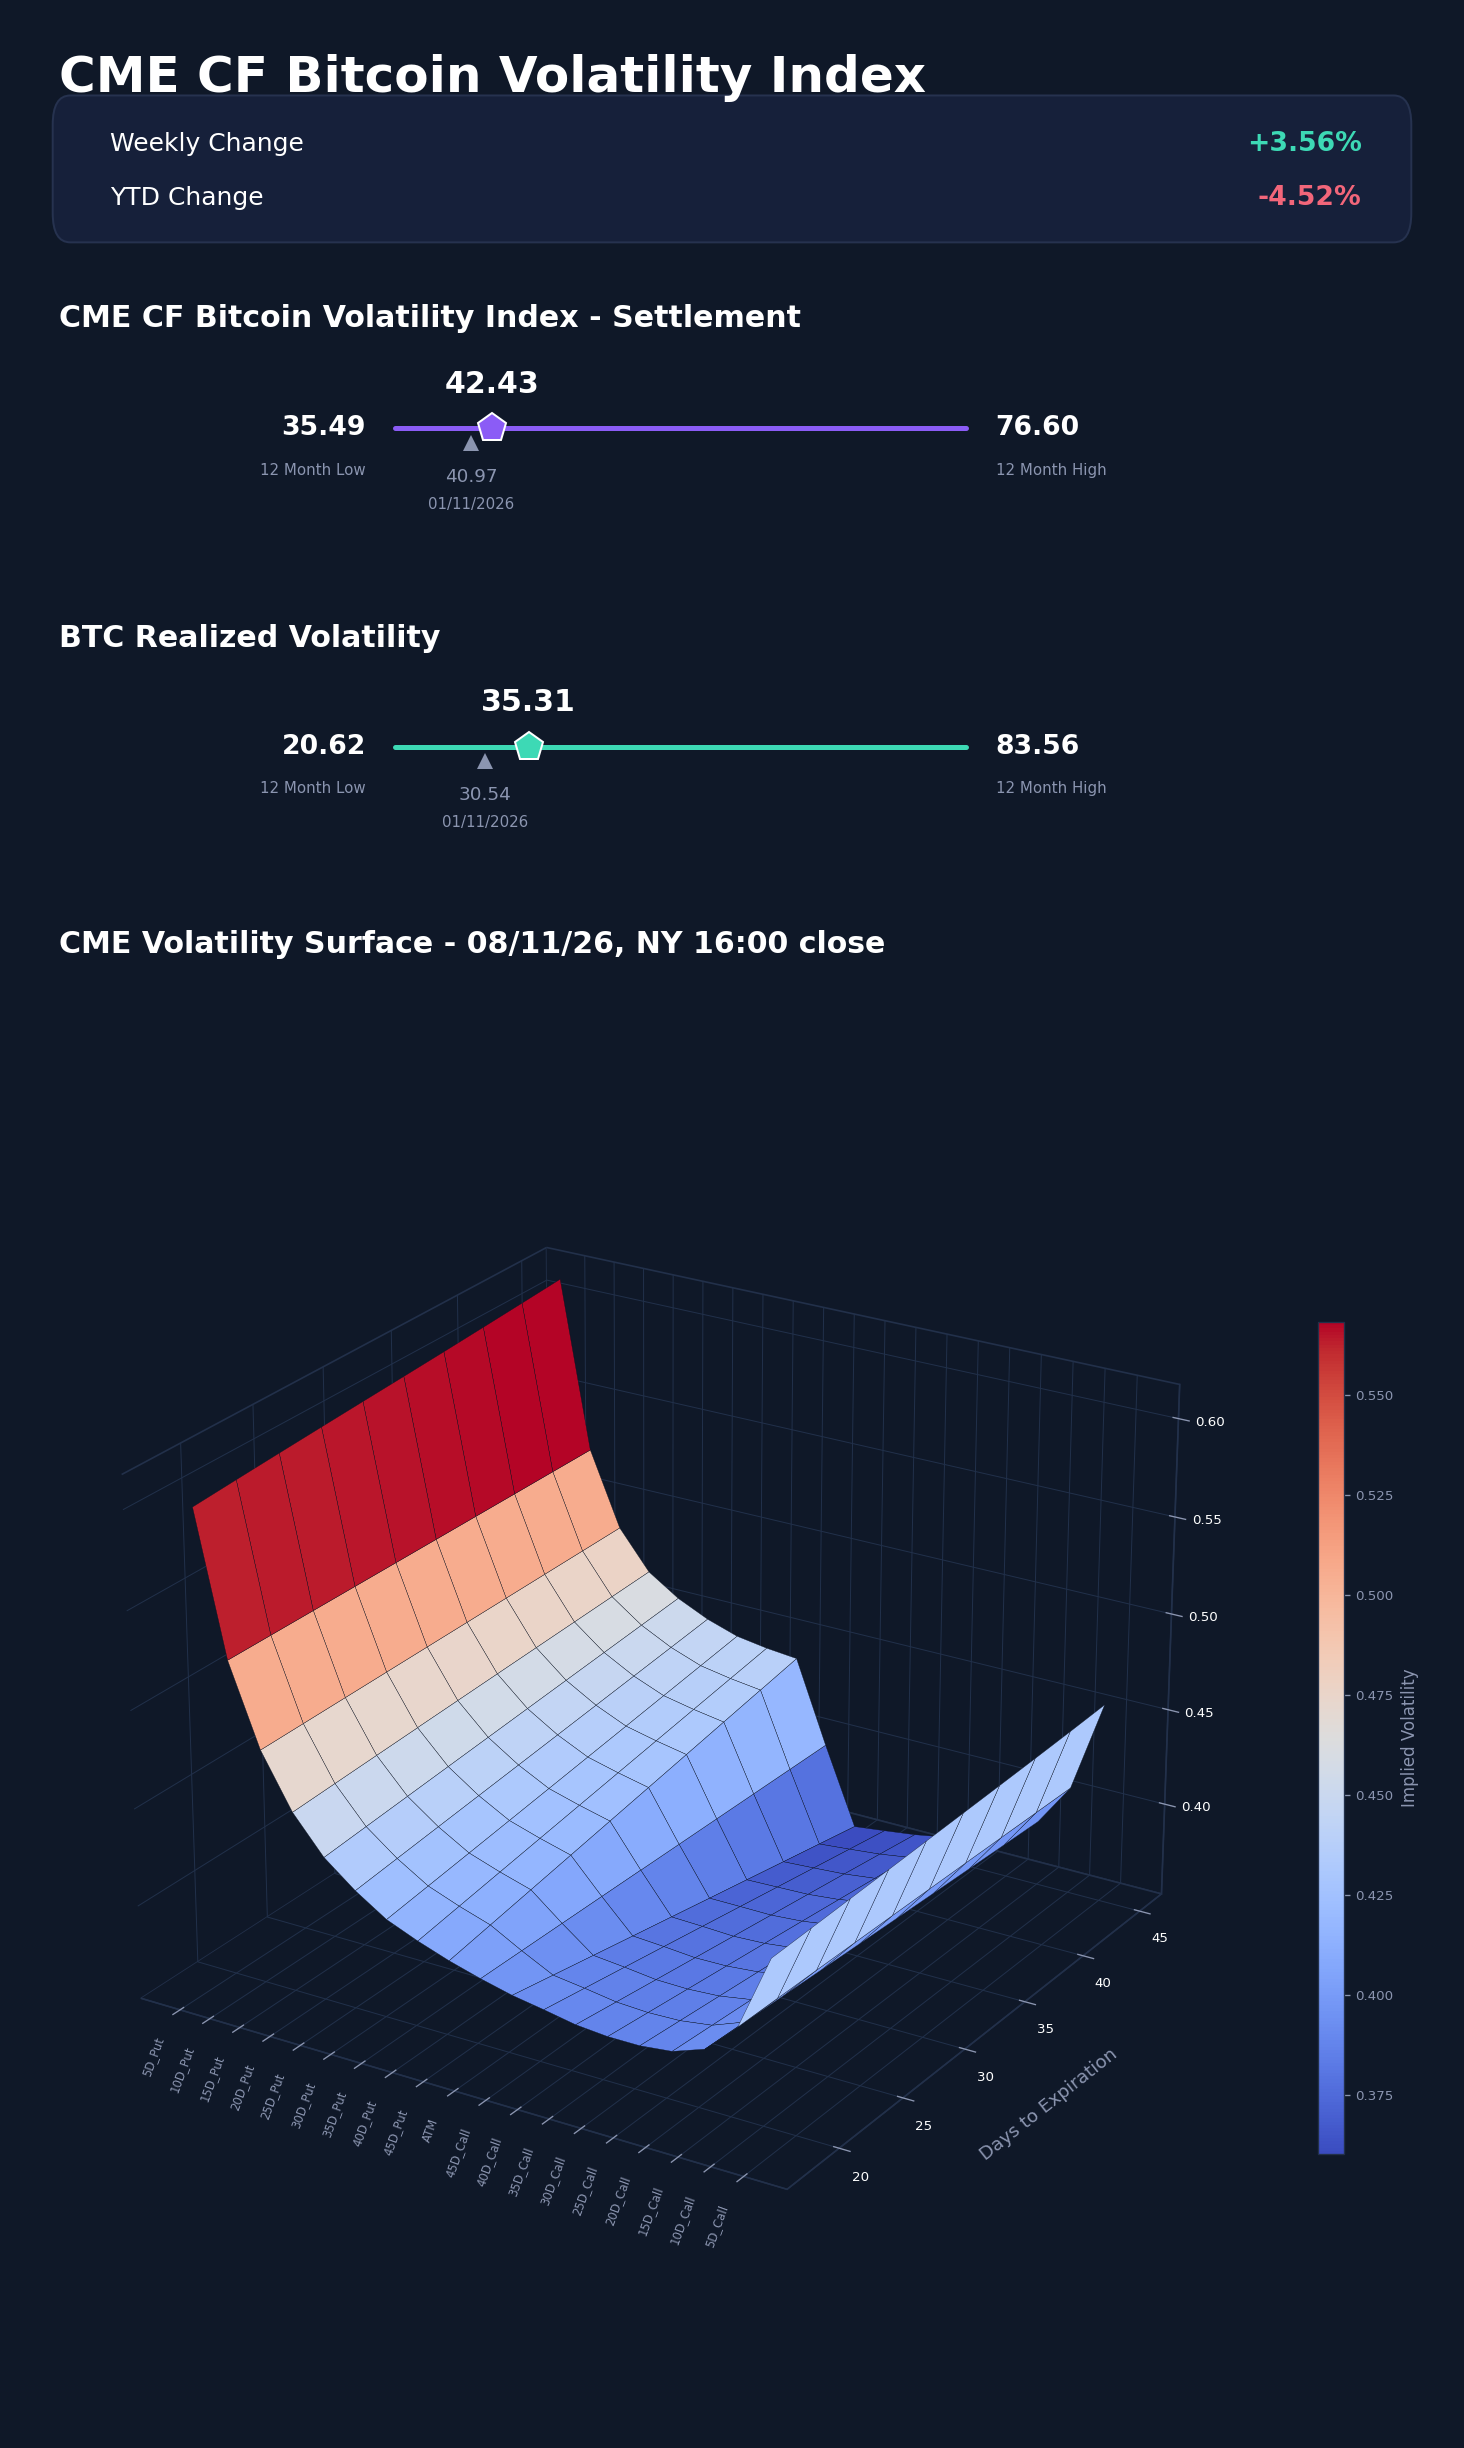
The CME CF Bitcoin Volatility Index Settlement (BVXS) rose 3.56% to 42.43 from 40.97 a week earlier, and its path tracked the equity sessions. Across the business week it eased to 38.95 on Wednesday's rally, jumped to 42.42 on Thursday and was 40.69 on Friday. Realized volatility rose more than implied. Thursday's decline lifted 30-day realized to 36.92 from 32.79, and it ended the week at 35.31 against 30.54, so the implied-realized spread narrowed to 7.12 vol points from 10.43 and options now carry less of a premium over the movement BTC has delivered. BVXS sits 6.94 points above its 12-month low of 35.49, well below the 76.60 high, and is down 4.52% YTD from its 44.44 start-of-year reference. The surface priced more downside protection. At one month (30 days against 31 a week earlier), at-the-money (ATM) implied volatility rose 1.15 points to 39.86, while the 5-delta put widened to 20.57 points over ATM from 17.54 and the 25-delta put skew to 4.83 from 3.82. A week after the Binance hack lifted the level of volatility without demand for crash protection, the equity sell-off moved demand toward the downside wing.
Market Cap Index Performance
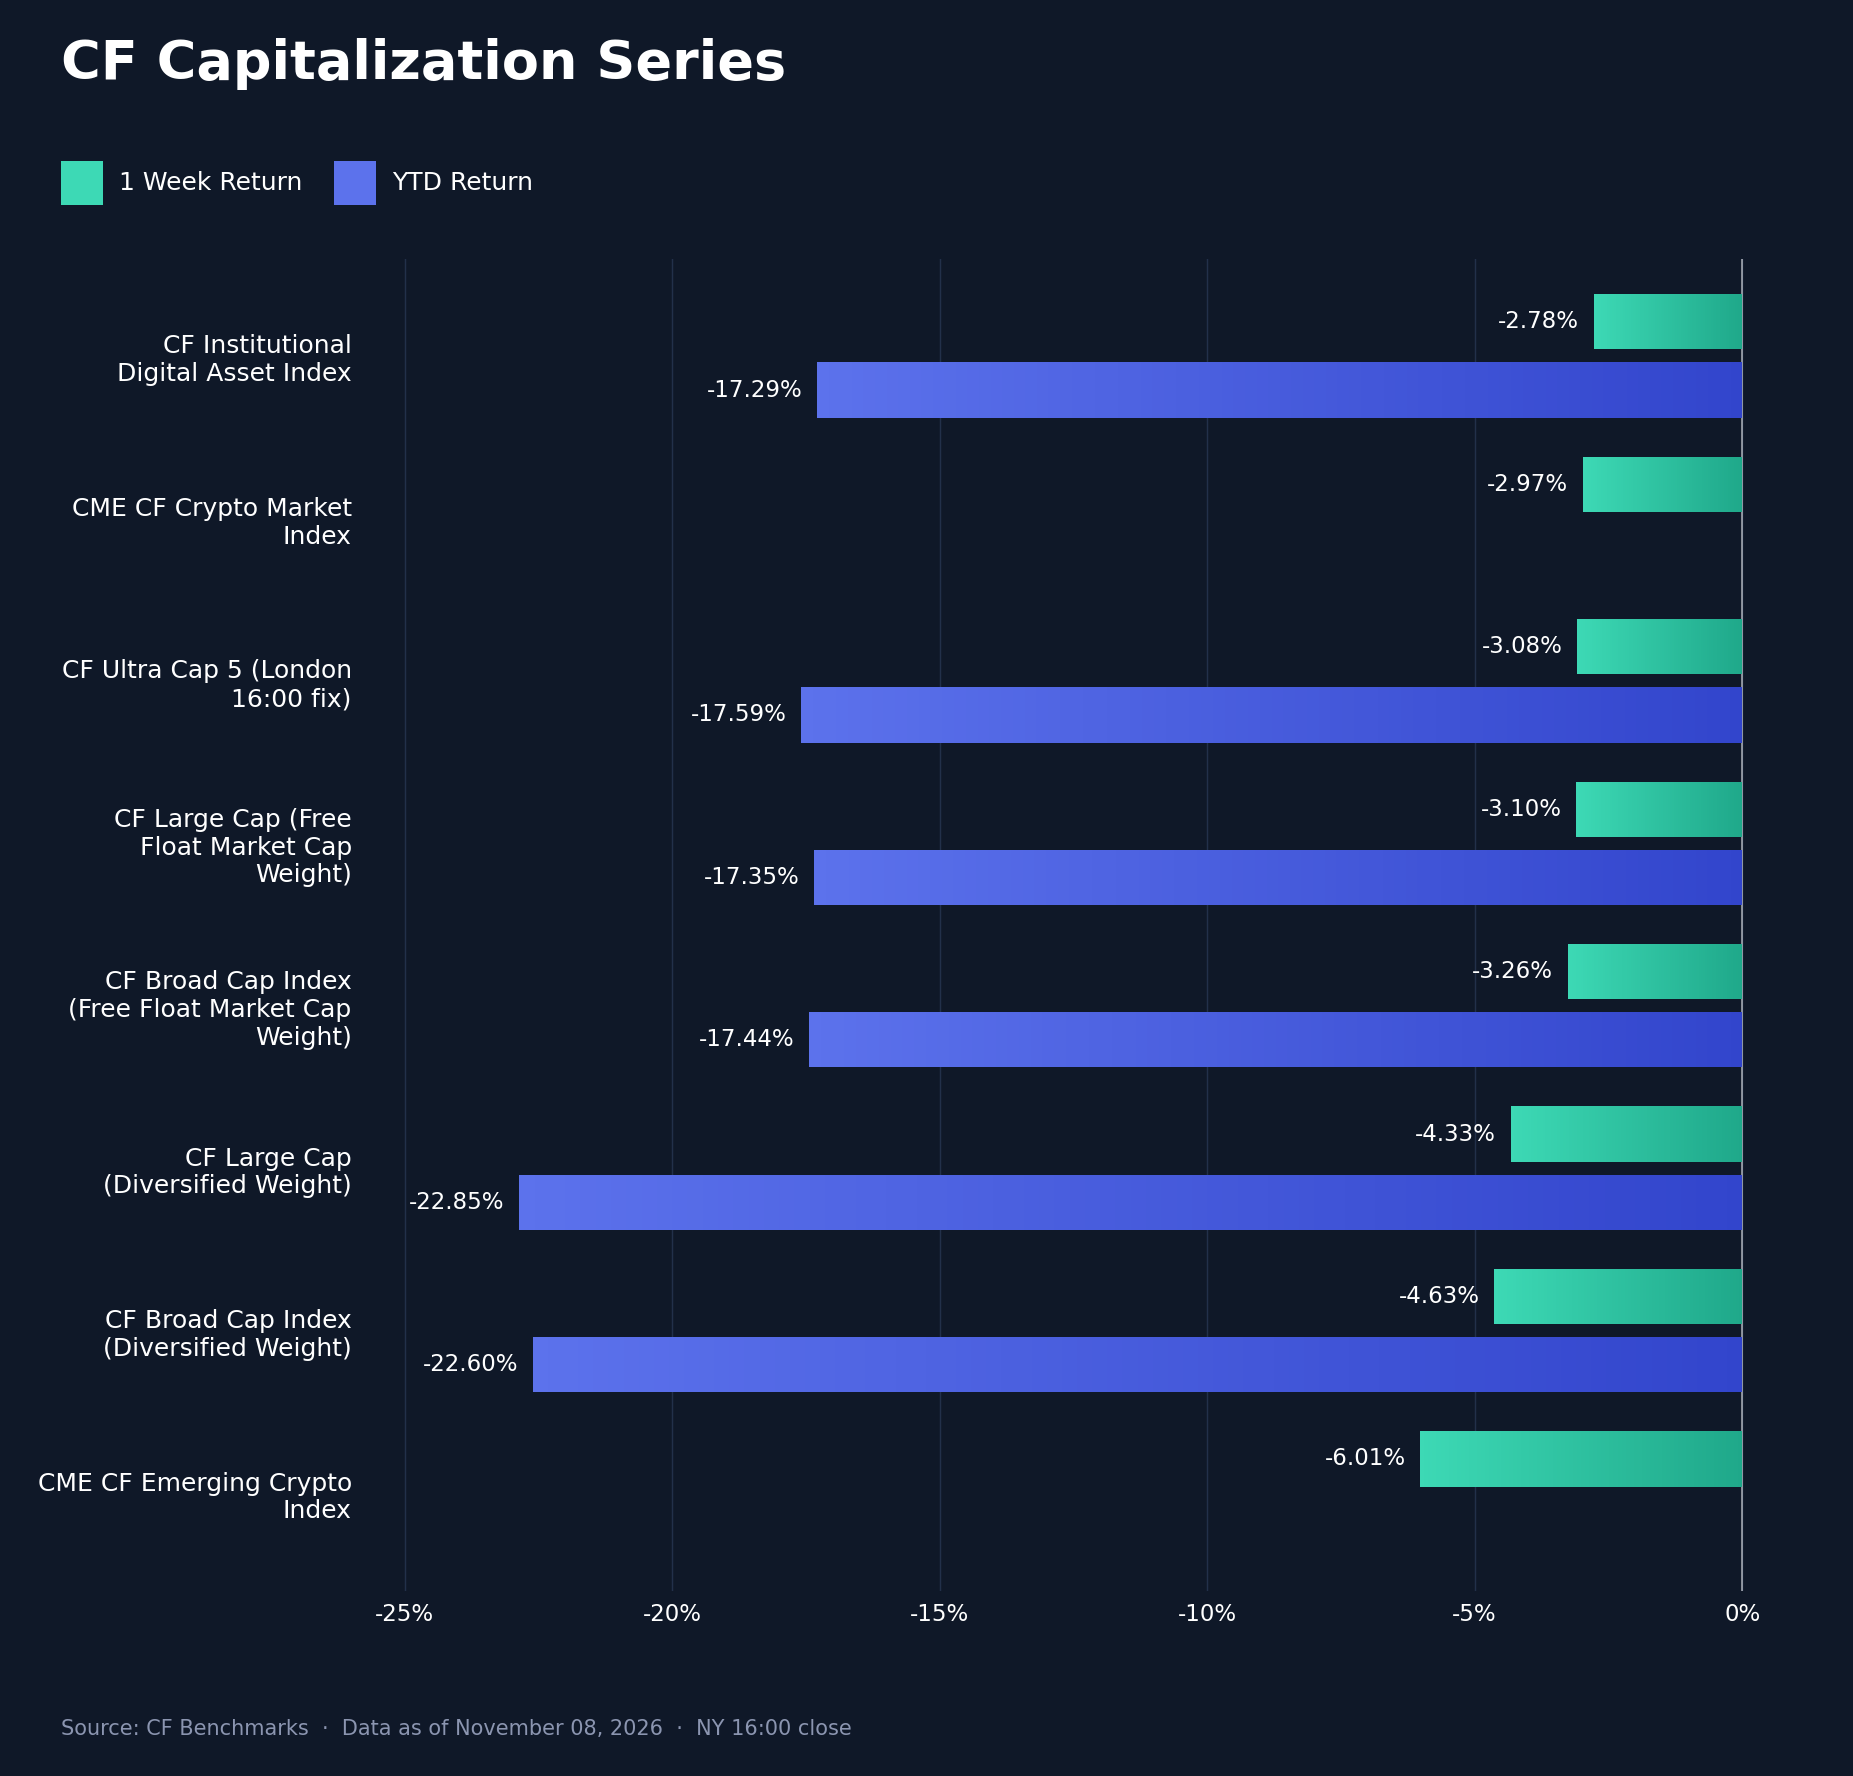
Every CF Capitalization Series index on the New York close fell, and losses deepened the further an index reached down the market-cap scale. The CF Institutional Digital Asset Index held up best at -2.78%, followed by CMI at -2.97%, CF Large Cap (Free Float Market Cap Weight) at -3.10% and CF Broad Cap (Free Float Market Cap Weight) at -3.26%. The diversified baskets fell further, CF Large Cap (Diversified Weight) by 4.33% and CF Broad Cap (Diversified Weight) by 4.63%, and the CME CF Emerging Crypto Index was weakest at -6.01%, a 3.24pp range across the seven. CF Ultra Cap 5 fell 3.08% on the London 16:00 fix and is not ranked against them. The diversified-versus-free-float gap (Broad Cap Diversified minus Large Cap Free Float) swung to -1.53pp from +0.53pp a week earlier, ending two weeks in which equal-leaning baskets held up better. Only 0.26pp of that gap opened on Thursday, when Broad Cap Diversified fell 5.60% against 5.34% for Large Cap Free Float; the rest accumulated on Monday, Wednesday, Friday and over the weekend. YTD, Large Cap Free Float is down 17.35% against 22.60% for Broad Cap Diversified. Smaller, higher-beta assets underperformed on most sessions rather than only on the shock day, which fits persistent selling of the long tail more than a single forced deleveraging. Rates were not the driver, with the 10-year Treasury yield 8 basis points (bps) lower on the week at 4.86%.
Factors Analysis
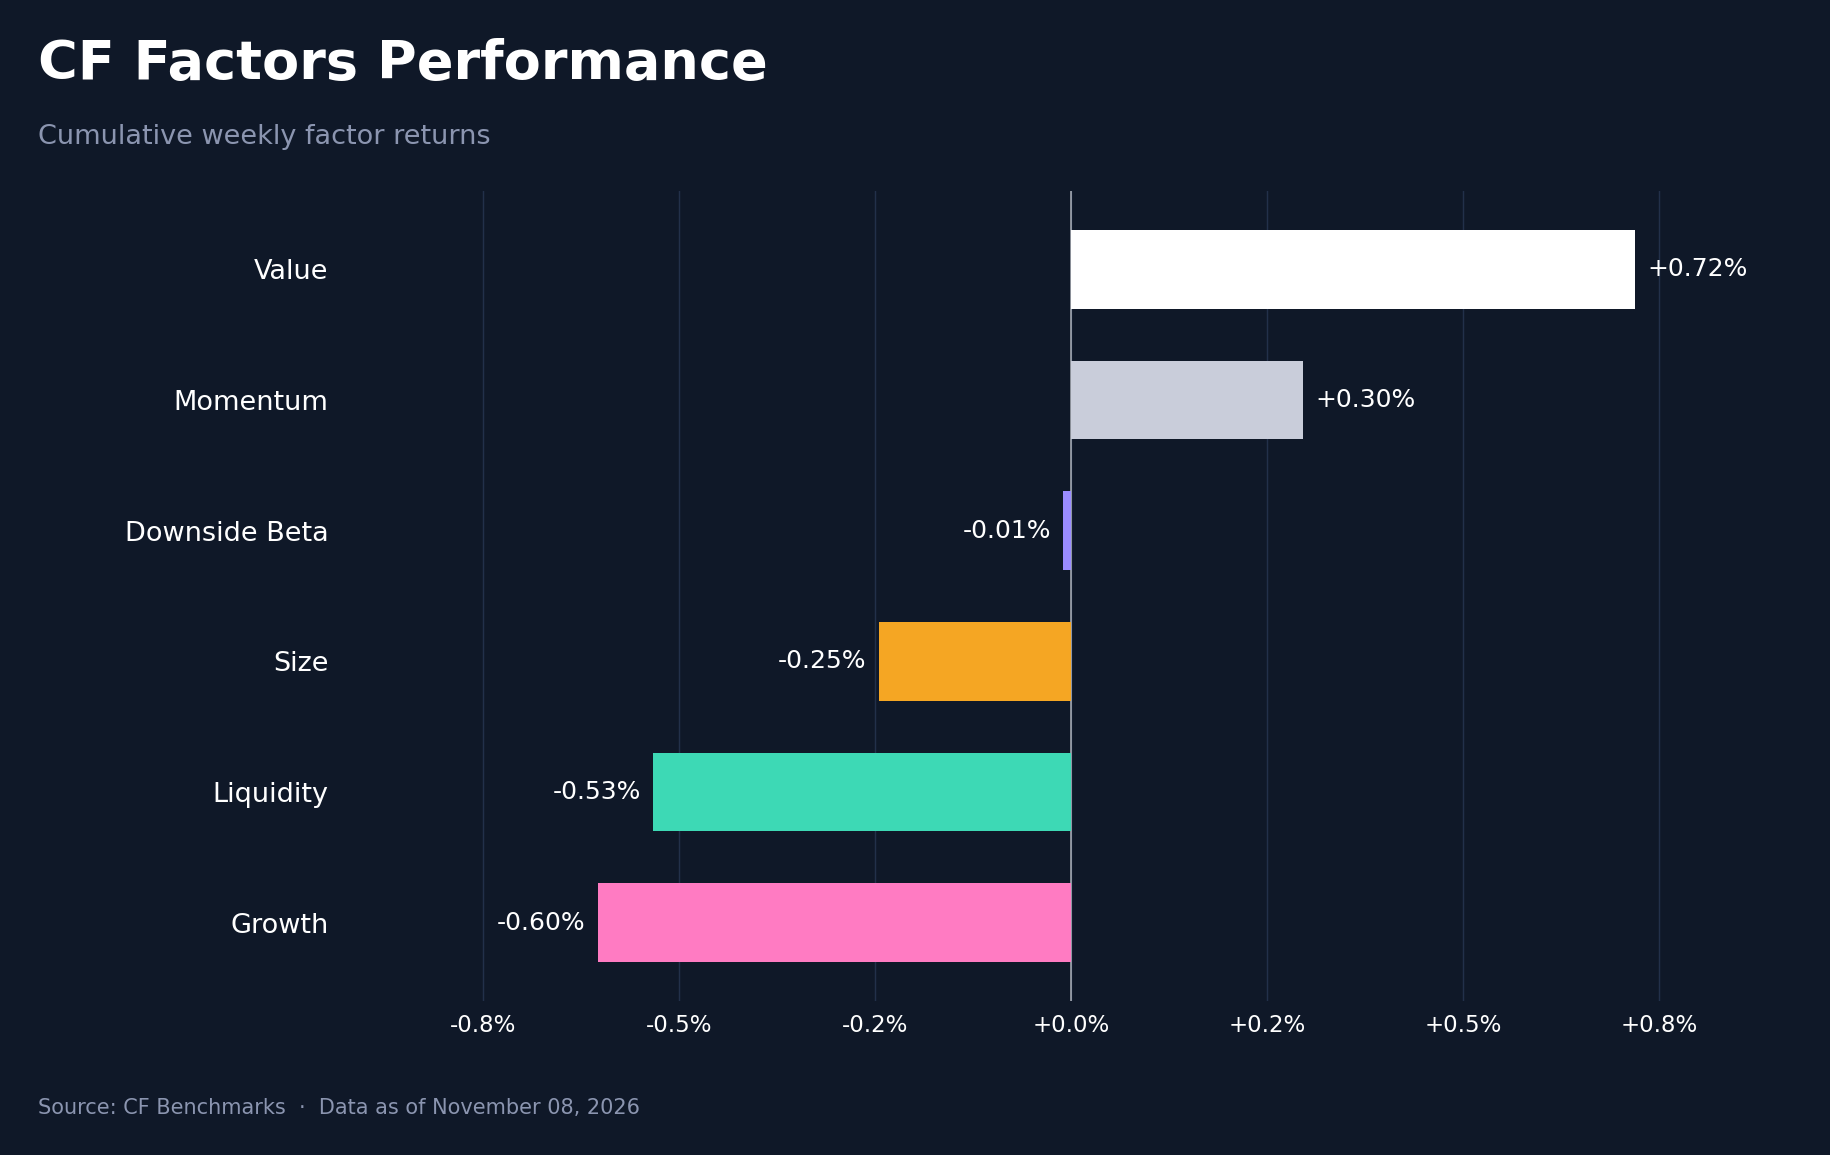
CF factor returns compressed, with the weekly range narrowing to 1.32pp from 2.96pp. Value led at +0.72%, matching its gain a week earlier, followed by Momentum at +0.30%, while Downside Beta was flat at -0.01%, Size fell 0.25%, Liquidity 0.53% and Growth 0.60%. Growth made the largest rotation, a 2.72pp swing from the prior week's +2.11% lead, Liquidity reversed by 1.54pp and Momentum improved by 1.14pp. The daily paths explain the small weekly totals. On Thursday, Liquidity gained 1.13% and Downside Beta 0.66%, so less liquid and lower-downside-beta assets held up better, while Size fell 0.83% as larger assets outperformed. Friday reversed all three (Downside Beta -1.06%, Liquidity -1.00%, Size +1.13%), which erased Thursday's defensive leadership and left no factor with a clear lead on the week.
Read our latest weekly crypto factors report: Factor Friday - November 6, 2026
Classification Series Analysis
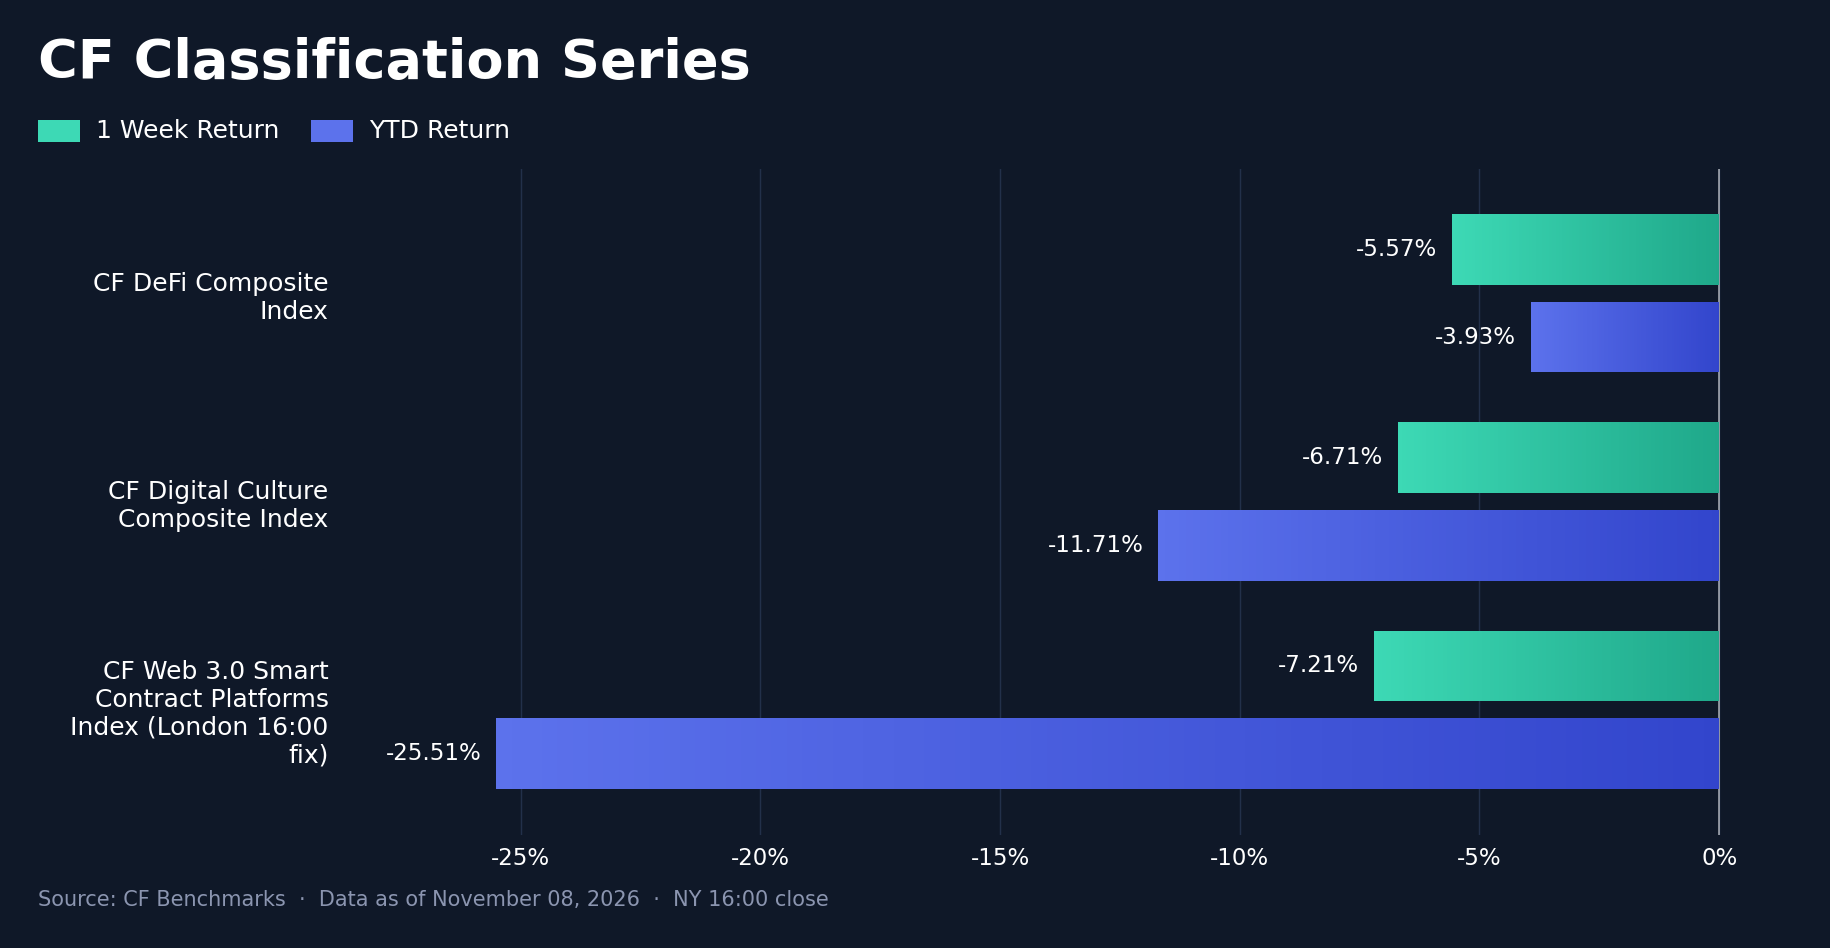
In the CF Classification Series, the CF DeFi Composite Index fell 5.57%, after a 2.84% decline a week earlier, and the CF Digital Culture Composite Index fell 6.71% after a 7.76% drop. DeFi's lead narrowed to 1.14pp from 4.92pp. The CF Web 3.0 Smart Contract Platforms Index fell 7.21% on the London 16:00 fix and is not compared with the two New York-close composites. YTD, DeFi is down 3.93%, Digital Culture 11.71% and the Smart Contract Platforms Index 25.51%. Among DeFi names, UNI, AAVE and Compound (COMP) each fell less than 3.5%, while gaming and metaverse tokens such as Gala (GALA, -10.11%) and The Sandbox (SAND, -9.35%) sat at the higher-beta end of Digital Culture.
Sector Analysis
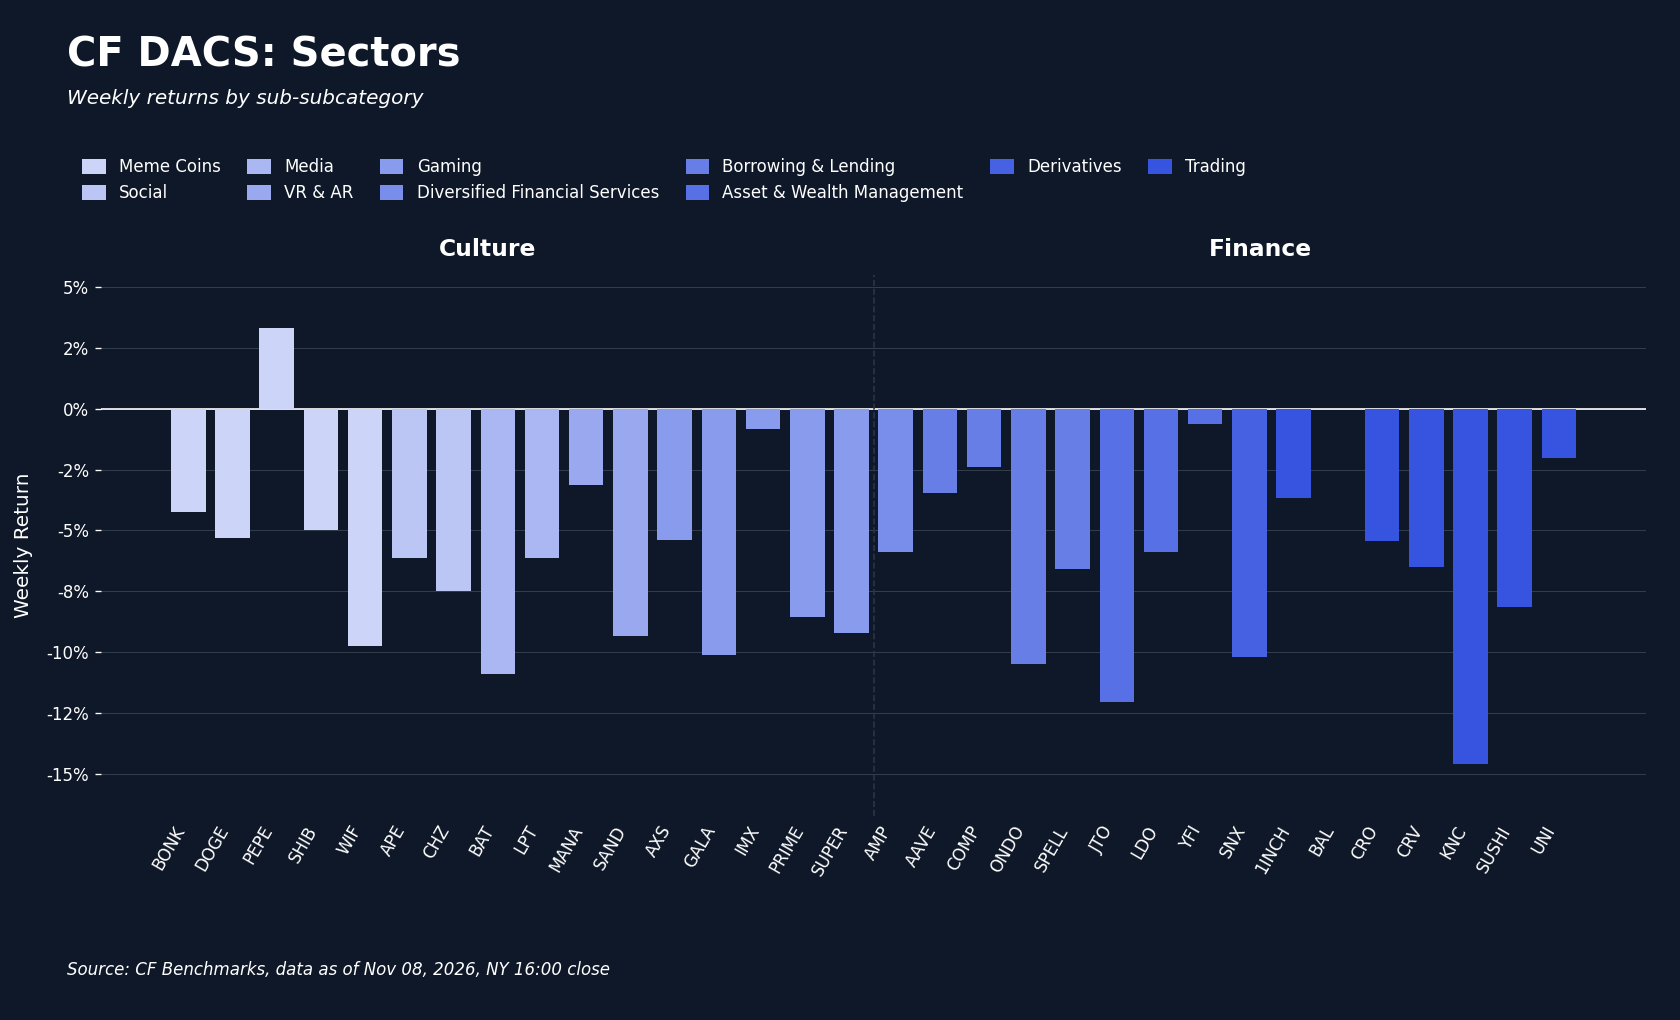
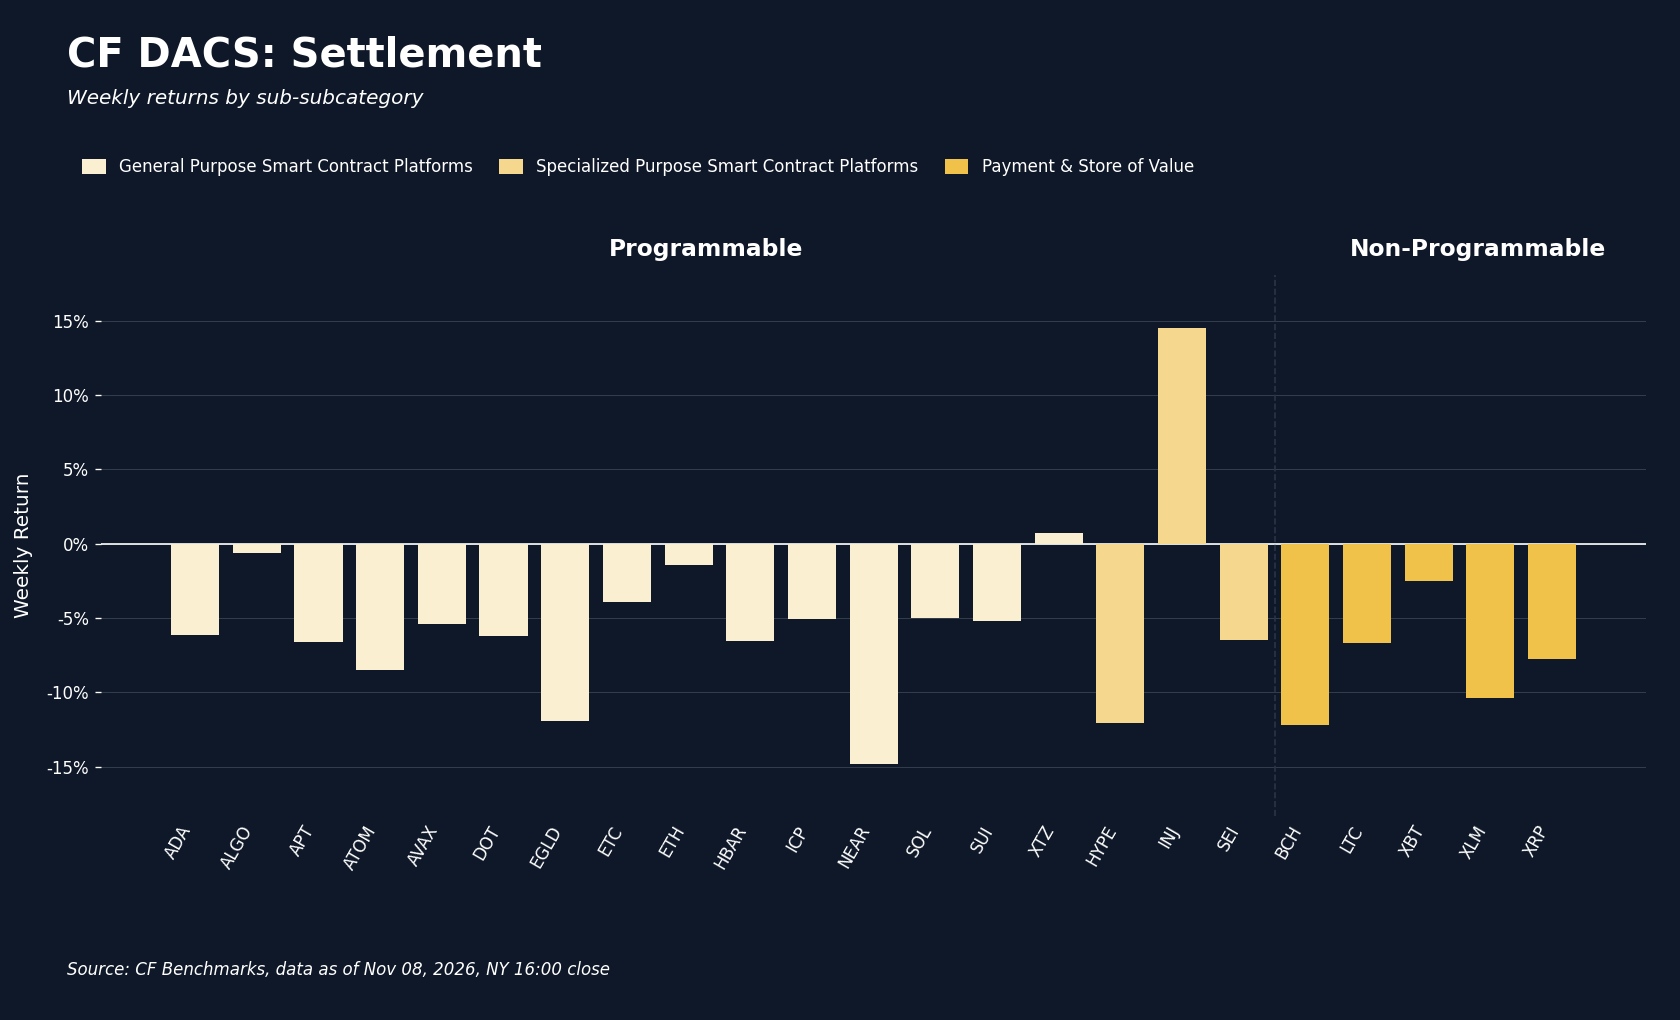
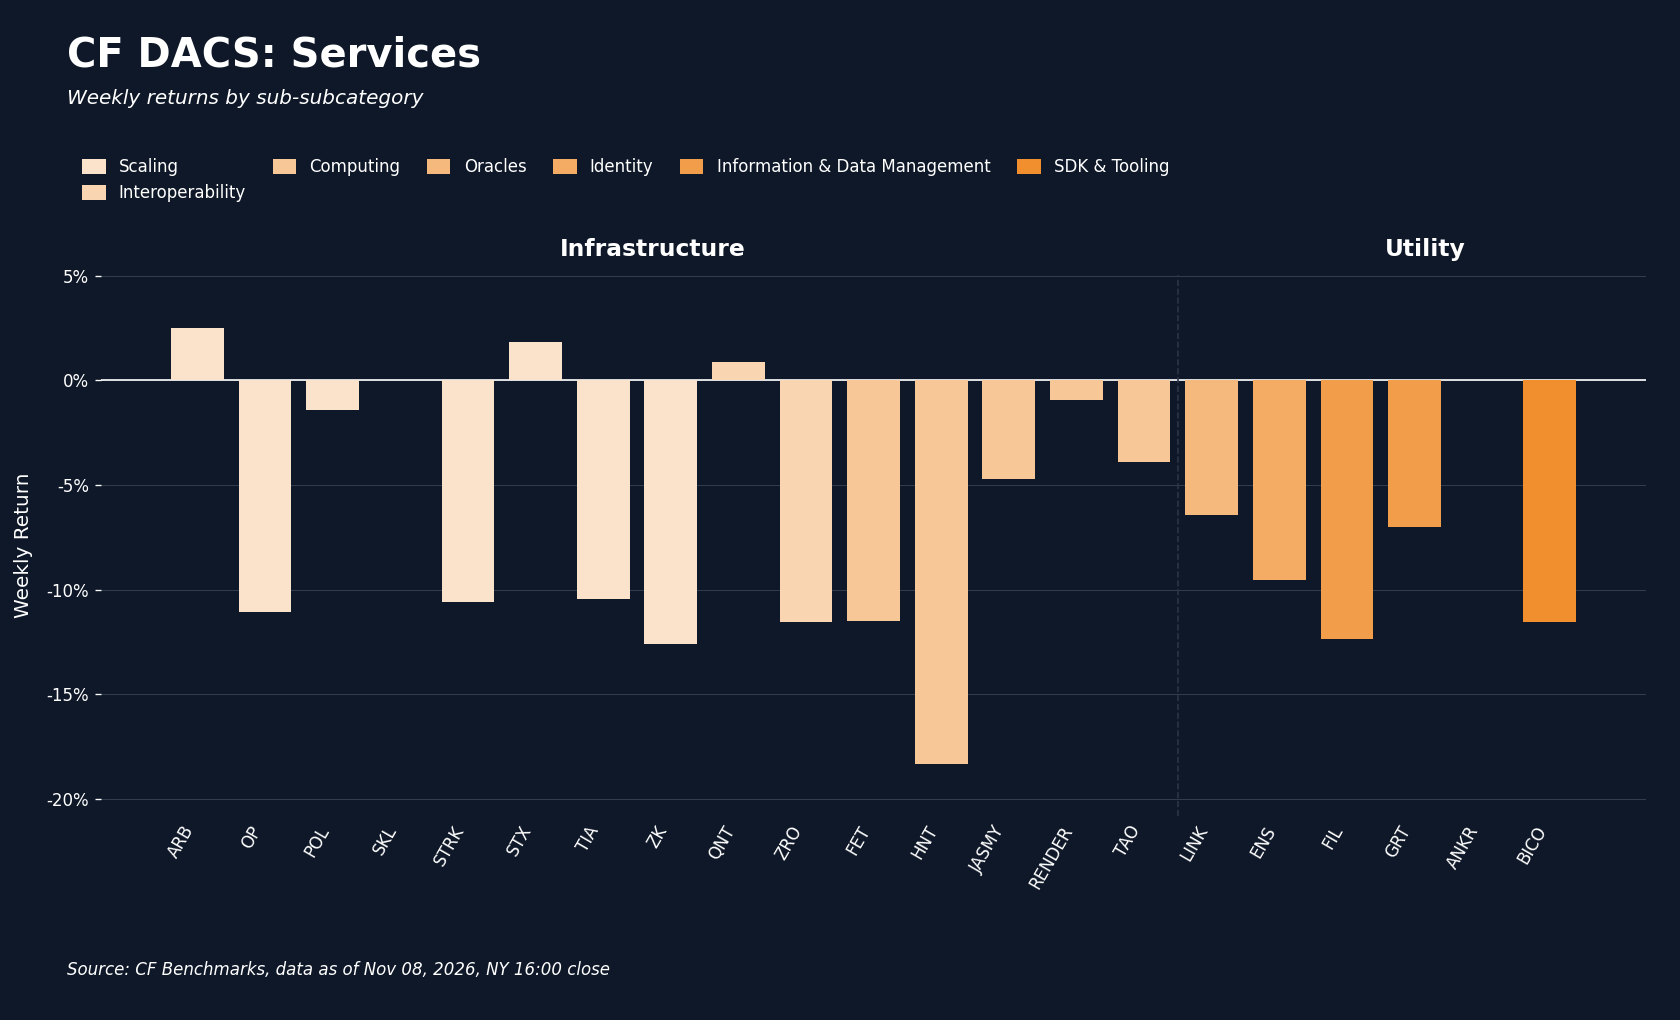
Every CF DACS sub-category average fell, and only six of 76 constituents with a weekly return finished higher. Programmable fell least, at -5.04%, helped by the week's clearest industry catalyst. Injective (INJ) rose 14.53% as Canary Capital's Staked Injective ETF, approved on November 2nd, listed on Nasdaq on November 5th. It is the first US fund to stake INJ and aims to stake at least 90% of its assets. INJ's gain into and through the launch, while the broader market sold off, coincided with the opening of a new US access route to staked INJ. HYPE, in the same Specialized Purpose Smart Contract Platforms category, retraced the prior week's advance on the Intercontinental Exchange (ICE) announcement with no single in-week cause. Among General Purpose platforms, NEAR Protocol (NEAR) fell 14.79%, which a crypto.news report tied to AI-linked tokens selling off with chip stocks. Culture (-6.13%), Finance (-6.12%) and Infrastructure (-6.13%) were tightly grouped. Culture's only gainer was Pepe (PEPE) at +3.34%, against Basic Attention Token (BAT) at -10.91%. Finance had no gainers, with Kyber Network (KNC) at -14.59% and Jito (JTO) at -12.08% the weakest. In Infrastructure, AI-linked names diverged, with Fetch.ai (FET) down 11.52% against declines of 0.93% for Render (RENDER) and 3.90% for Bittensor (TAO), while Arbitrum (ARB) rose 2.51% and Stacks (STX) 1.83%. Helium (HNT) was the week's weakest constituent at -18.32%, 32.85pp below INJ, with no identified catalyst. Utility fell 7.81%, with Filecoin (FIL) down 12.39%, and Non-Programmable was the weakest sub-category at -7.90%, as Bitcoin Cash (BCH) fell 12.21% and XLM 10.37%.
CF Staking Series
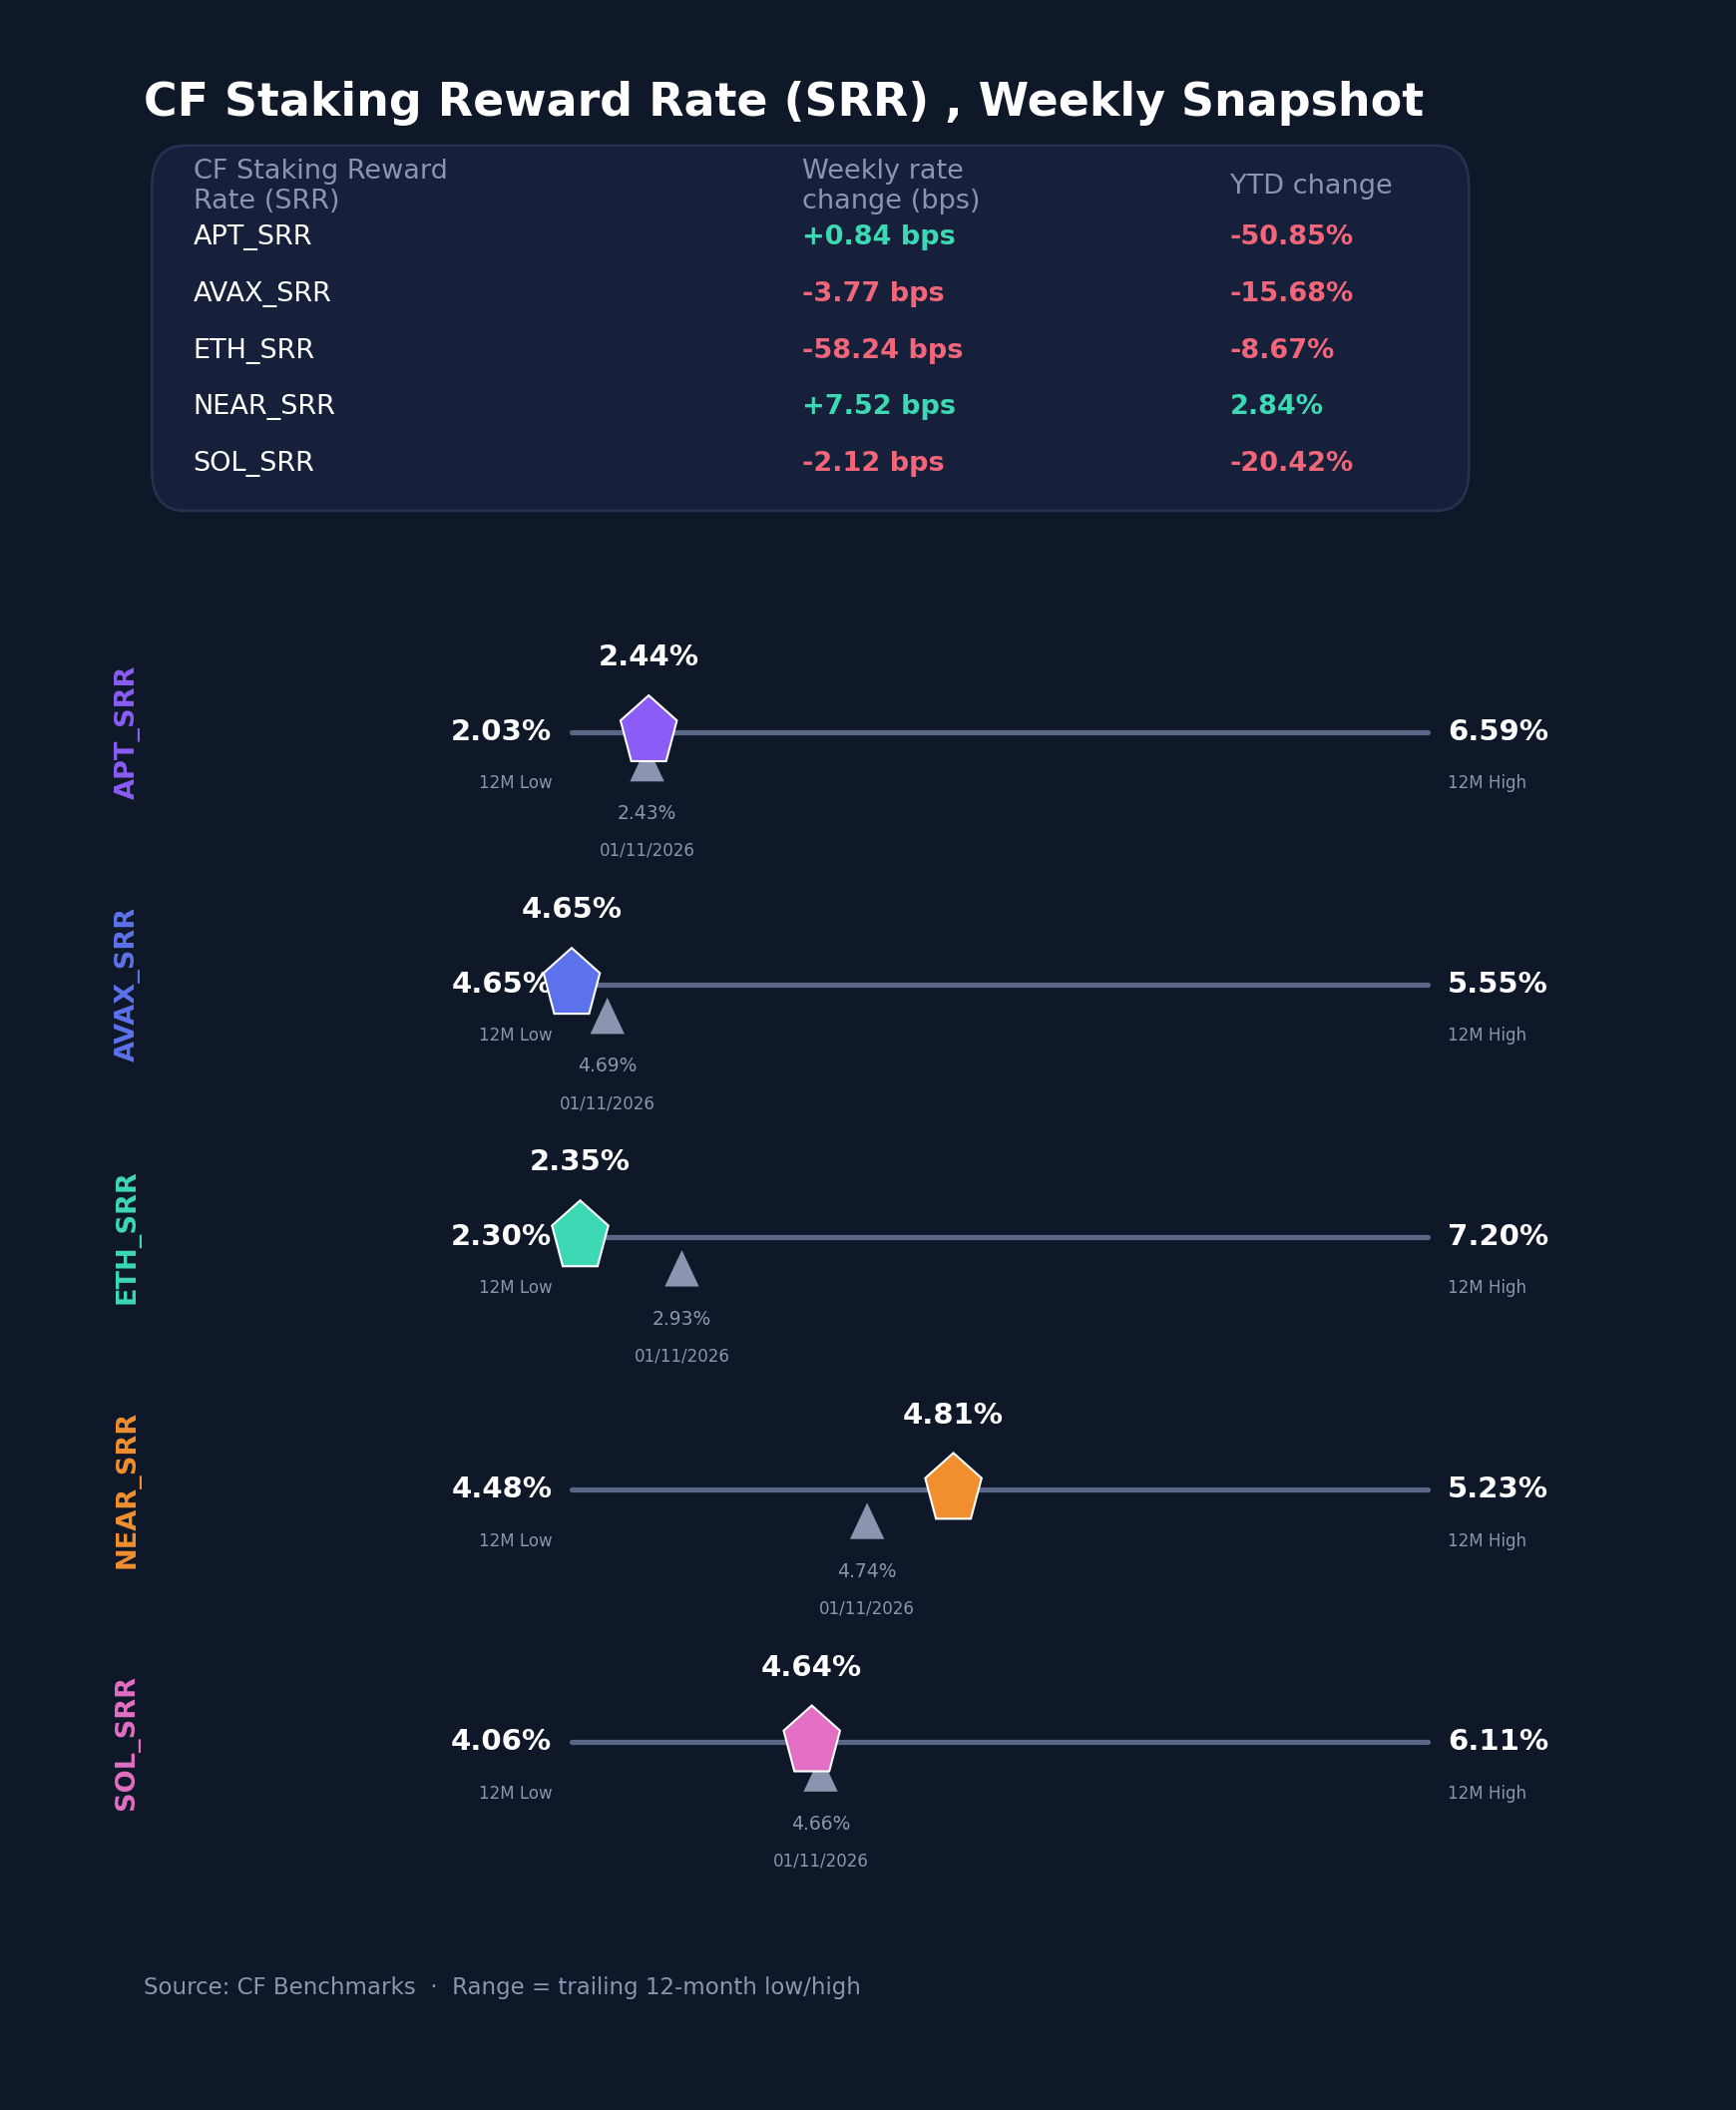
By the week's close, the CF Staking Series showed the ETH reward-rate spike fully unwound. The ETH rate fell 58.2 bps to 2.3458% from 2.9282%, a 19.89% relative index decline, and sits 4.9 bps above its 12-month low of 2.2972%. The decline came as Ethereum priority fees normalized after the movement of the stolen Binance funds lifted them the previous week. NEAR's rate rose 7.5 bps, from 4.7396% to 4.8148%, the only meaningful increase, and Aptos (APT) edged up 0.8 bps to 2.4392%. SOL slipped 2.1 bps to 4.6355% and AVAX fell 3.8 bps to 4.6483%, extending its run of 12-month lows. That leaves a 2.47pp range between ETH at the bottom of the set and NEAR at the top. YTD, the NEAR rate index is up 2.84% and the ETH index down 8.67%, while APT's is down 50.85%. Reward rates were insulated from the equity sell-off, with every move other than ETH's fee normalization under 8 bps.
Bitcoin Basis Analysis
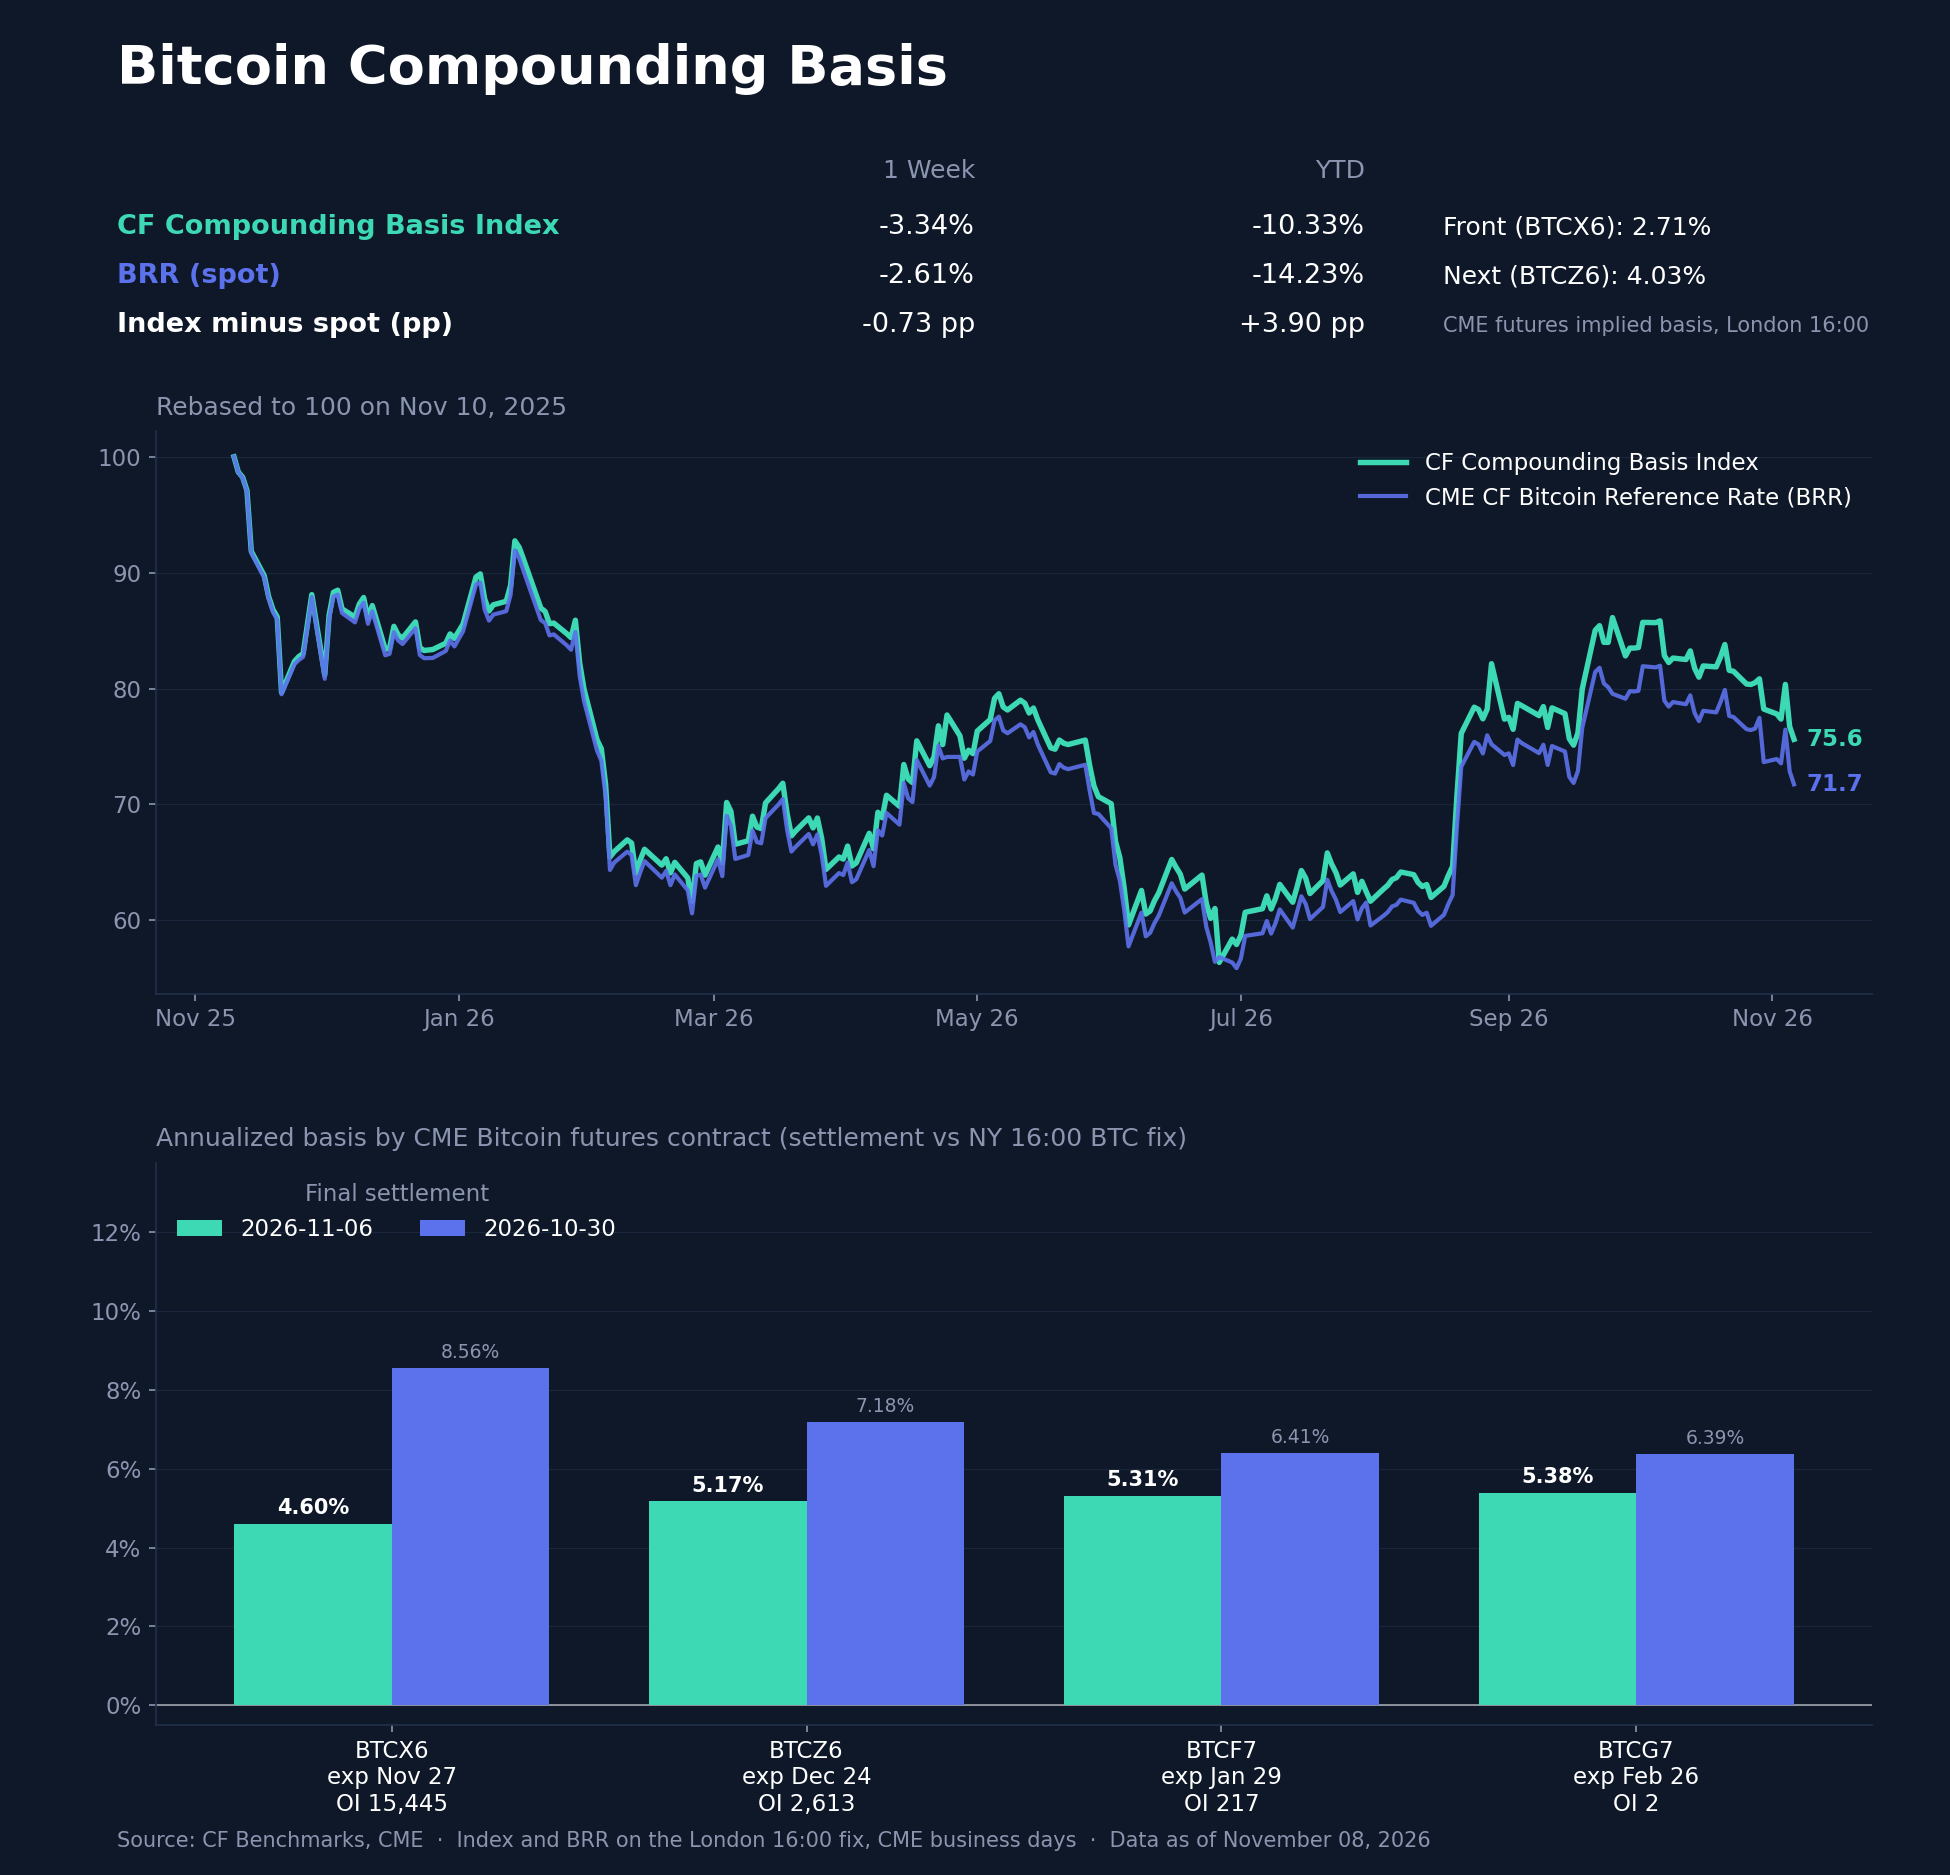
CME futures premiums compressed through the sell-off. The CF Compounding Basis Index fell 3.34% from October 30th to November 6th against a 2.61% decline in the CME CF Bitcoin Reference Rate (BRR), so the basis subtracted 0.73pp, though the index still leads spot by 3.90pp YTD. Both print on the London 16:00 fix and are not compared with the New York close used elsewhere. At Friday's settlement, annualized basis fell on every listed CME contract: November (BTCX6) to 4.60% from 8.56%, down 397 bps, December (BTCZ6) to 5.17% from 7.18%, January (BTCF7) to 5.31% from 6.41% and February (BTCG7) to 5.38% from 6.39%. The curve slopes upward again after last week's downward-sloping shape, but at a lower level throughout. The compression tracked spot, consistent with leveraged long demand fading after Thursday's liquidations.
Closing Synthesis
The midterm result lifted digital assets, and the semiconductor sell-off two sessions later took back those gains and more. Crypto stayed weak after the shock eased: it did not follow equities higher on Friday, smaller assets kept underperforming, the options surface priced more downside protection and CME basis compressed across the curve. INJ's ETF-linked gain was the only clear exception. We read the week as de-risking that outlasted its equity trigger, with BTC holding its 50-week average but unable to reclaim its 50-day.
The information contained within is for educational and informational purposes ONLY. It is not intended nor should it be considered an invitation or inducement to buy or sell any of the underlying instruments cited including but not limited to cryptoassets, financial instruments or any instruments that reference any index provided by CF Benchmarks Ltd. This communication is not intended to persuade or incite you to buy or sell security or securities noted within. Any commentary provided is the opinion of the author and should not be considered a personalised recommendation. Please contact your financial adviser or professional before making an investment decision.
Note: Some of the underlying instruments cited within this material may be restricted to certain customer categories in certain jurisdictions.
Crypto's Post Midterm Sell-Off
Digital assets extended last week's decline as a post-midterm AI-chip sell-off in equities erased a brief relief rally. Crypto sat out Friday's equity rebound, selling spread from the majors to the long tail, downside protection firmed on the options surface and CME basis compressed with spot.

Mark Pilipczuk
Factor Friday - November 6, 2026
Downside Beta led CF Benchmarks' factor table at 1.66% as the Market fell 6.17%, its largest weekly loss since June. Liquidity gained 1.51% for a second week and leads over four weeks at 4.46%, while Size, down 0.50% on the week, still leads year to date at 22.14%.
Mark Pilipczuk
Altcoins Lead October's Decline
The CME CF Crypto Market Index fell 9.32% in October, the smallest decline in the family, as Bitcoin supplied 57% of it while falling less than the index. Altcoins led the selling before the Binance theft and Bitcoin after it, so the CF Services Category Index fell furthest (-19.71%).
Mark Pilipczuk
By clicking Accept, you consent to CF Benchmarks's use of cookies.
Visit Cookie Settings to learn how CF Benchmarks uses cookies and to adjust your preferences.