
Aug 31, 2026
Bitcoin Holds the Line After Warsh's Hawkish Speech
Weekly Index Highlights, August 31, 2026
The crypto market lost momentum toward the end of the week after a surprisingly hawkish message from Fed Chair Warsh. In his first Jackson Hole keynote, he emphasized that the central bank may have more work to do on inflation, even after an in-line Core Personal Consumption Expenditures (PCE) print. That sent Bitcoin (BTC) reversing from a three-month high near $81,455 to the high $76,000s in a single session, with roughly $488 million in market-wide liquidations. Yet the CF Capitalization Series closed the week down only 0.45% to 0.80%, retaining the large majority of the prior week’s 24.20% to 29.02% debasement-trade surge. The more consequential moves this week sat beneath the index level: a sharp value-over-size factor rotation, a Solana (SOL) rally built on record spot ETF demand, and a single-token explosion in the CF DACS Infrastructure sub-category.
Market Performance Update
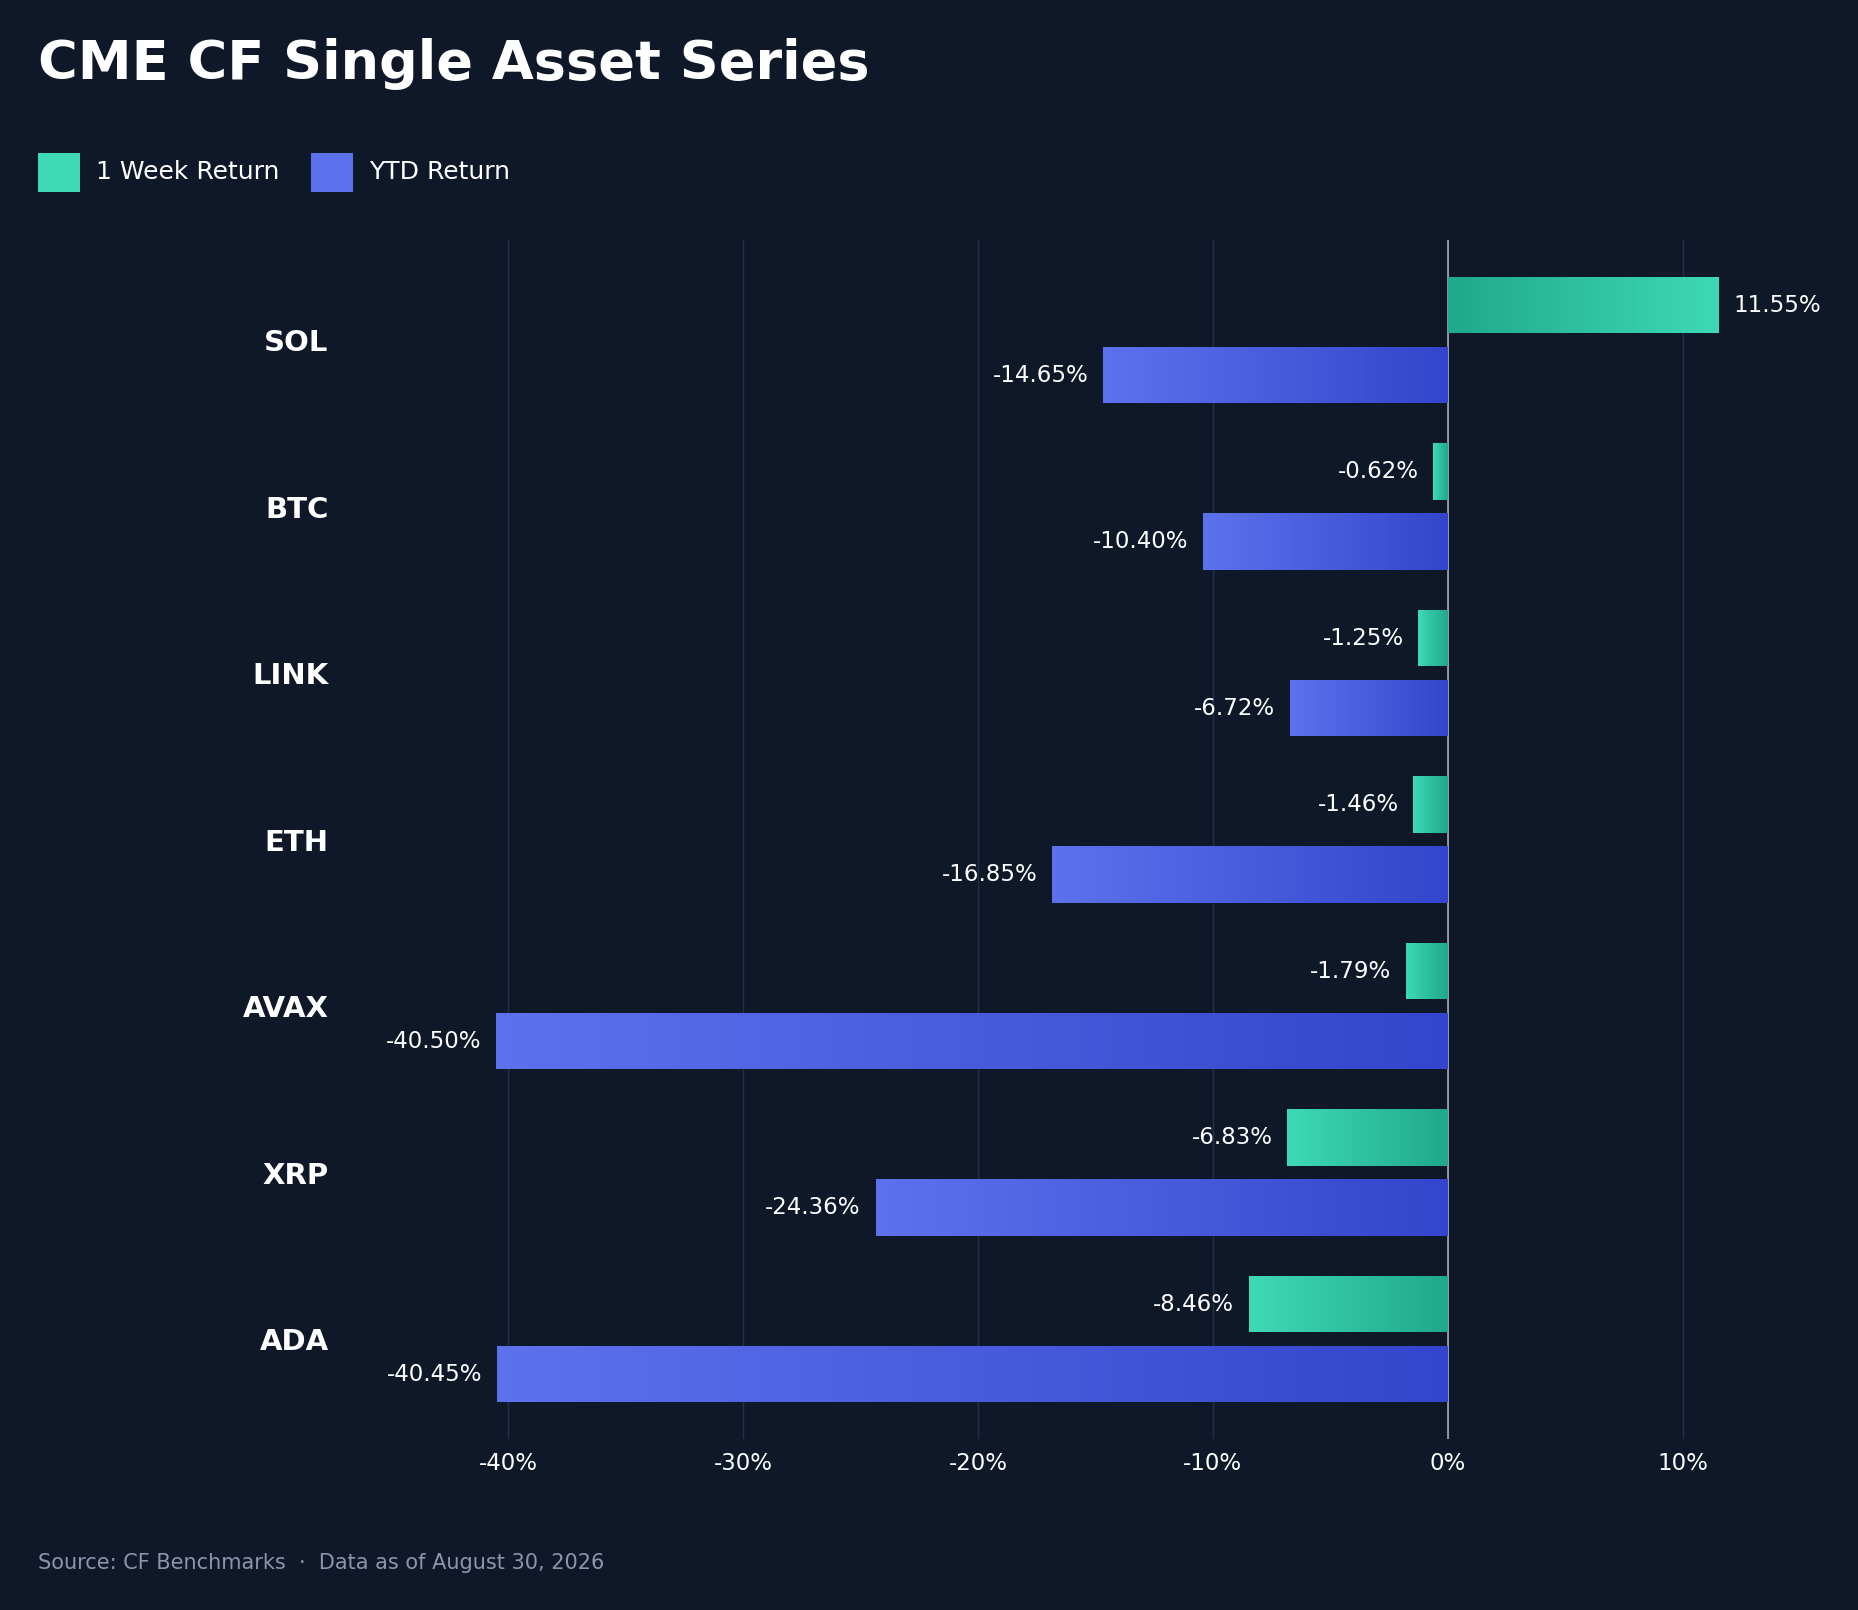
Solana (SOL) was the lone gainer among the CF Single Asset Series this week, adding 11.55% week-on-week (w/w) and narrowing its year-to-date (YTD) loss to -14.65%, while the other six names gave back a portion of last week's debasement-trade surge: Bitcoin (BTC) held nearly flat at -0.62% w/w (YTD -10.40%), Chainlink (LINK) -1.25% (YTD -6.72%), Ether (ETH) -1.46% (YTD -16.85%), Avalanche (AVAX) -1.79% (YTD -40.50%), XRP -6.83% (YTD -24.36%), and Cardano (ADA) -8.46% (YTD -40.45%), a 20.01 percentage point (pp) spread between SOL and ADA. The week's macro pivot arrived late and hit hard: BTC pushed to a three-month high near $81,455 by Friday morning, then reversed through Warsh's first Jackson Hole keynote as chair, which called underlying inflation still too high and left a rate hike on the table, sending the odds of a 2026 hike to 68% from below 50% a week earlier; the reversal ran roughly 3.0% to 4.0% intraday into the high $76,000s to high $77,000s, with approximately $488m in market-wide liquidations, more than $360m of it in long positions. Wednesday's PCE print had already set the tone, with the headline reading a tenth above consensus on both a month-over-month and year-over-year basis even as core matched consensus exactly, pulling BTC off its overnight highs before the tape stabilized into midweek. SOL's divergence had its own driver: US spot Solana ETFs booked their best inflow day of 2026 on Thursday at $60.91m, part of a run that included the year's third-largest daily intake and cumulative inflows near $1.2bn since launch, a bid heavy enough to keep SOL supported through the same Friday session that hit every other name. Against a prior week that saw every CF Single Asset name gain between 20.51% and 52.48%, this week's net give-back was shallow everywhere except XRP and ADA, which surrendered the largest share of their prior surge.
Volatility Analysis
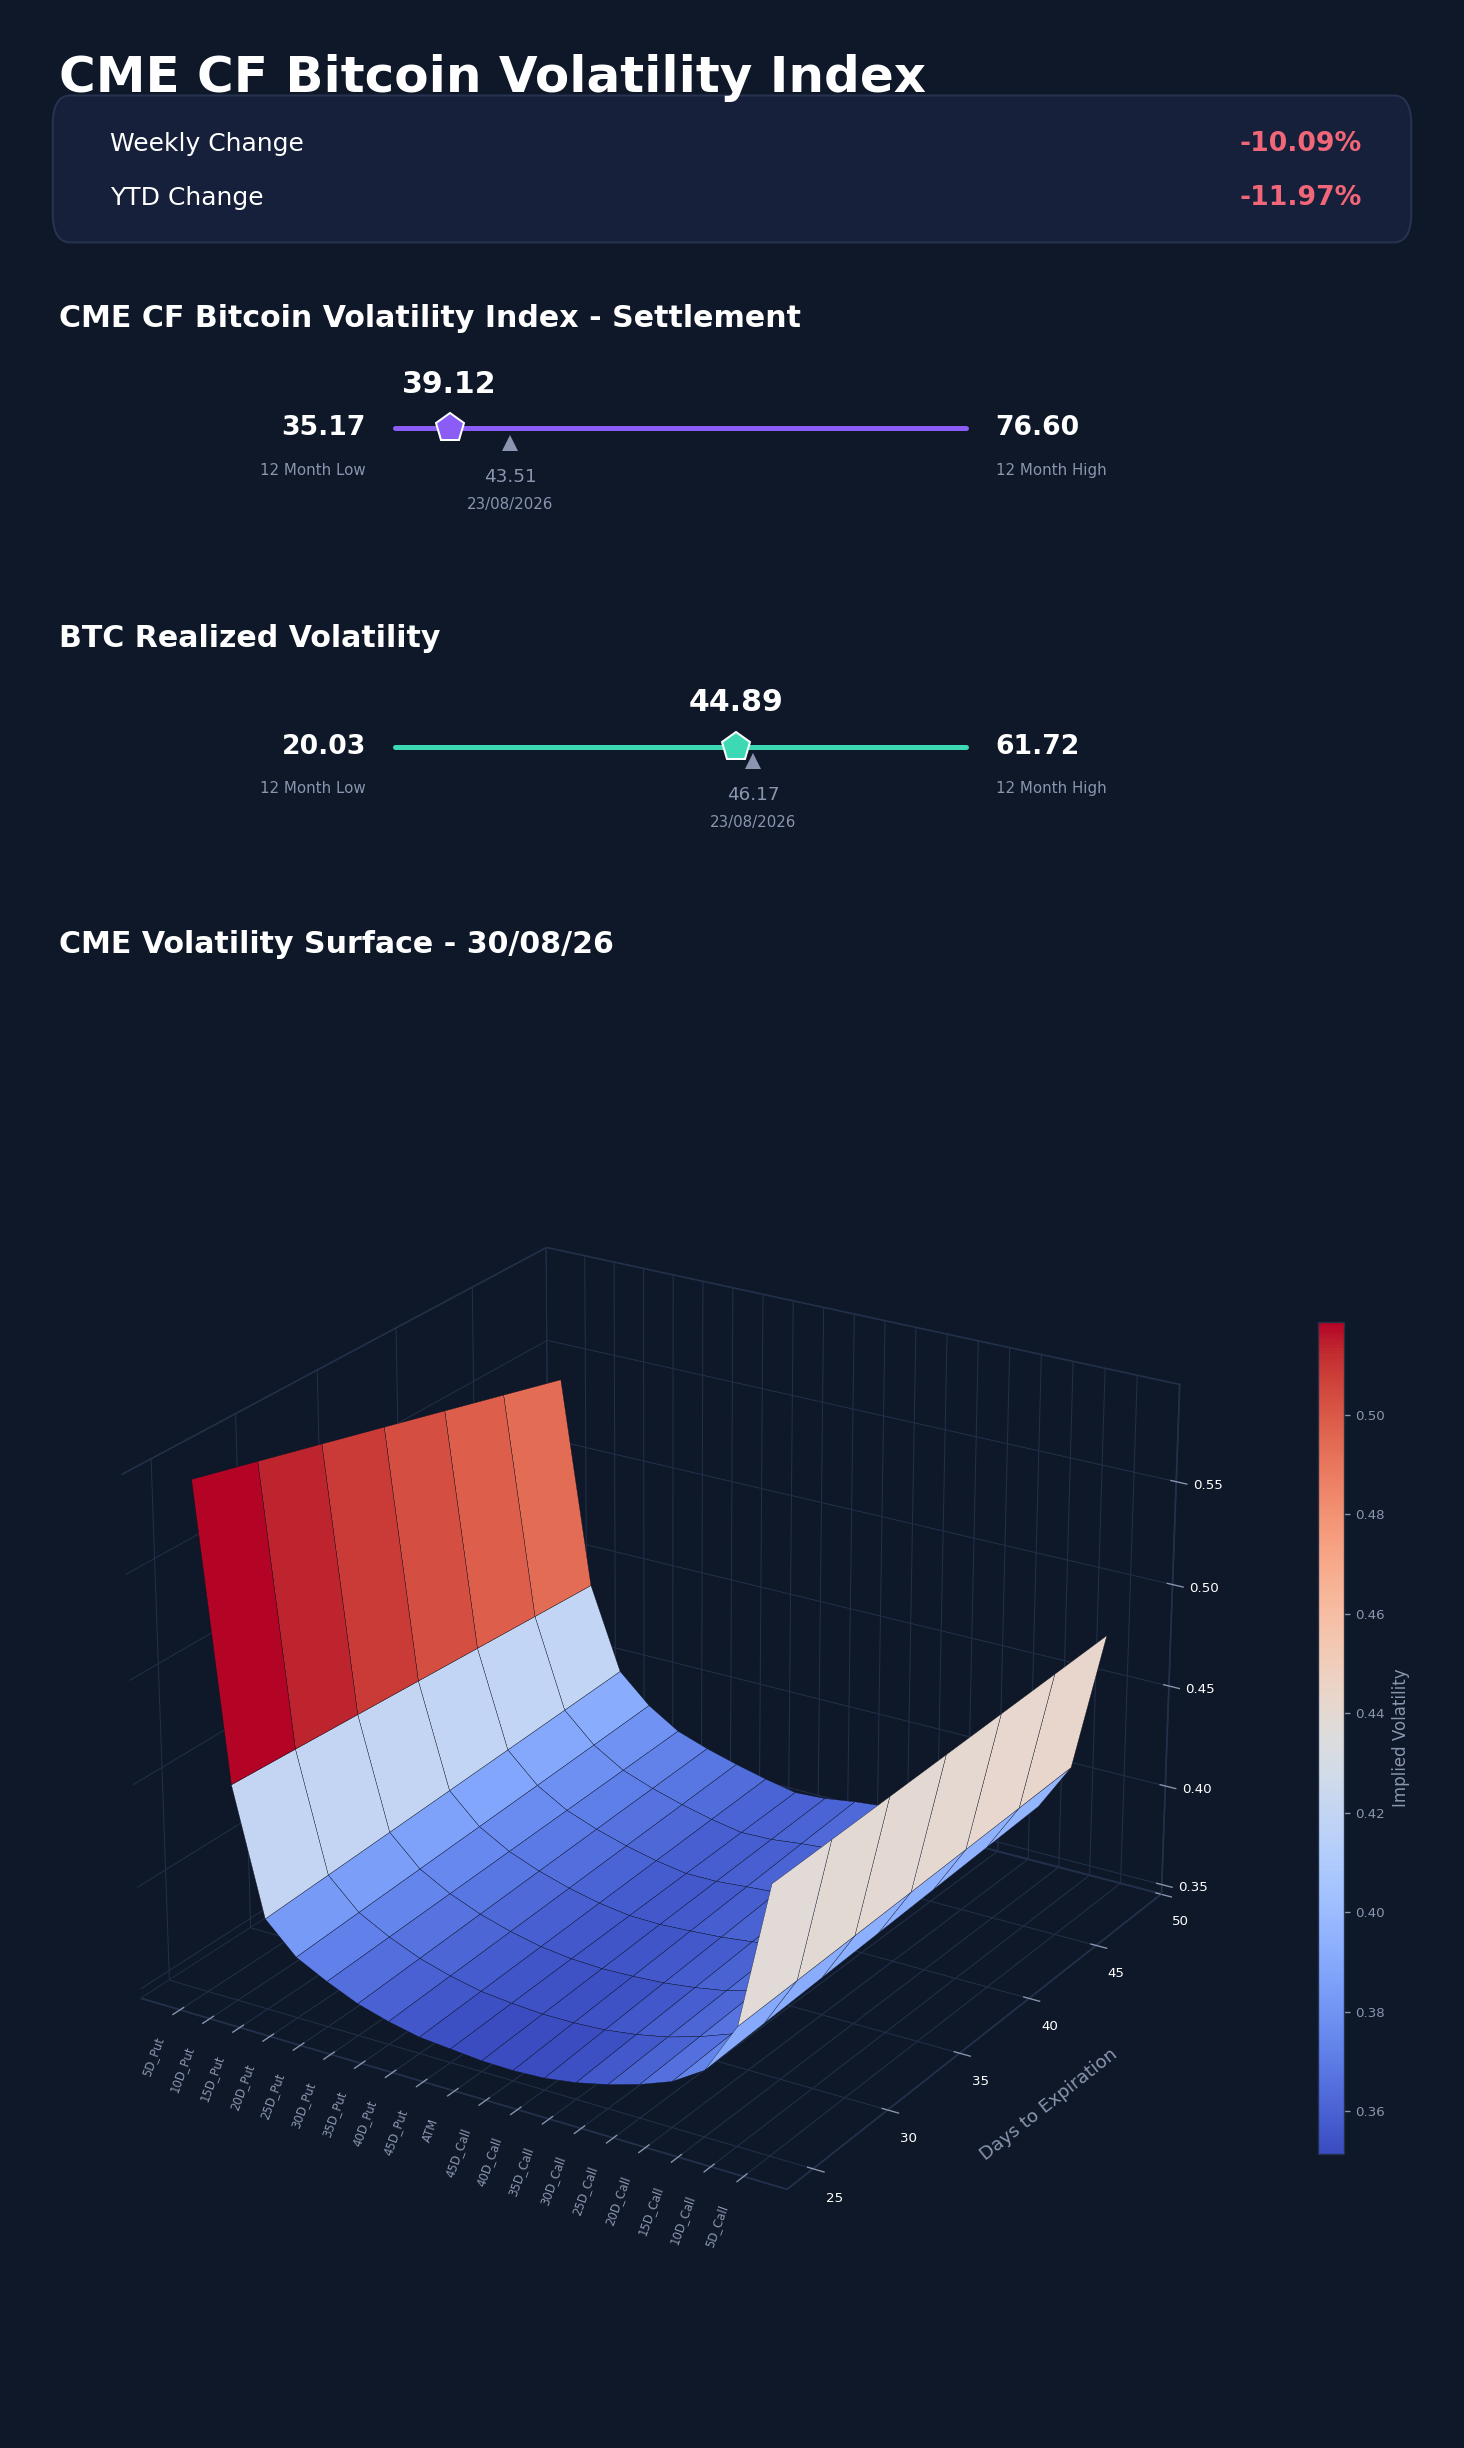
The CME CF Bitcoin Volatility Index Settlement (BVXS) fell to 39.12 from 43.51 a week earlier, a 10.09% w/w decline that left it just 3.95 vol points above its 12-month low of 35.17 and 11.97% lower on a YTD basis. Thirty-day realized volatility eased more modestly, to 44.89 from 46.17, still 24.85 points above its own 12-month floor of 20.03; the implied-realized spread widened to -5.77 vol points from -2.66 a week earlier, the settlement index pricing meaningfully less risk than the market actually delivered. That gap is notable given the week's own realized turbulence: BTC's Friday reversal, SOL's ETF-driven divergence and a single-token move exceeding 300% in the CF DACS Infrastructure sub-category (detailed in Sector Analysis) all printed inside the same seven days that BVXS compressed. The implied-vol surface told a more layered story than the settlement level alone: at the nearest exactly-matched tenor pair (28.9 days across both this week's and the prior week's snapshots), at-the-money implied vol fell 5.83 points and the smile shifted down by an average of 5.62 points across all nineteen delta nodes, but the 5-delta put wing rose 8.97 points relative to at-the-money even as the rest of the curve fell, a roughly 14.6-point divergence from the parallel move. Deep downside protection got structurally more expensive into a week that ended with the settlement index near its 12-month floor, consistent with hedgers pricing tail risk higher even as the general level of implied vol compressed.
Market Cap Index Performance
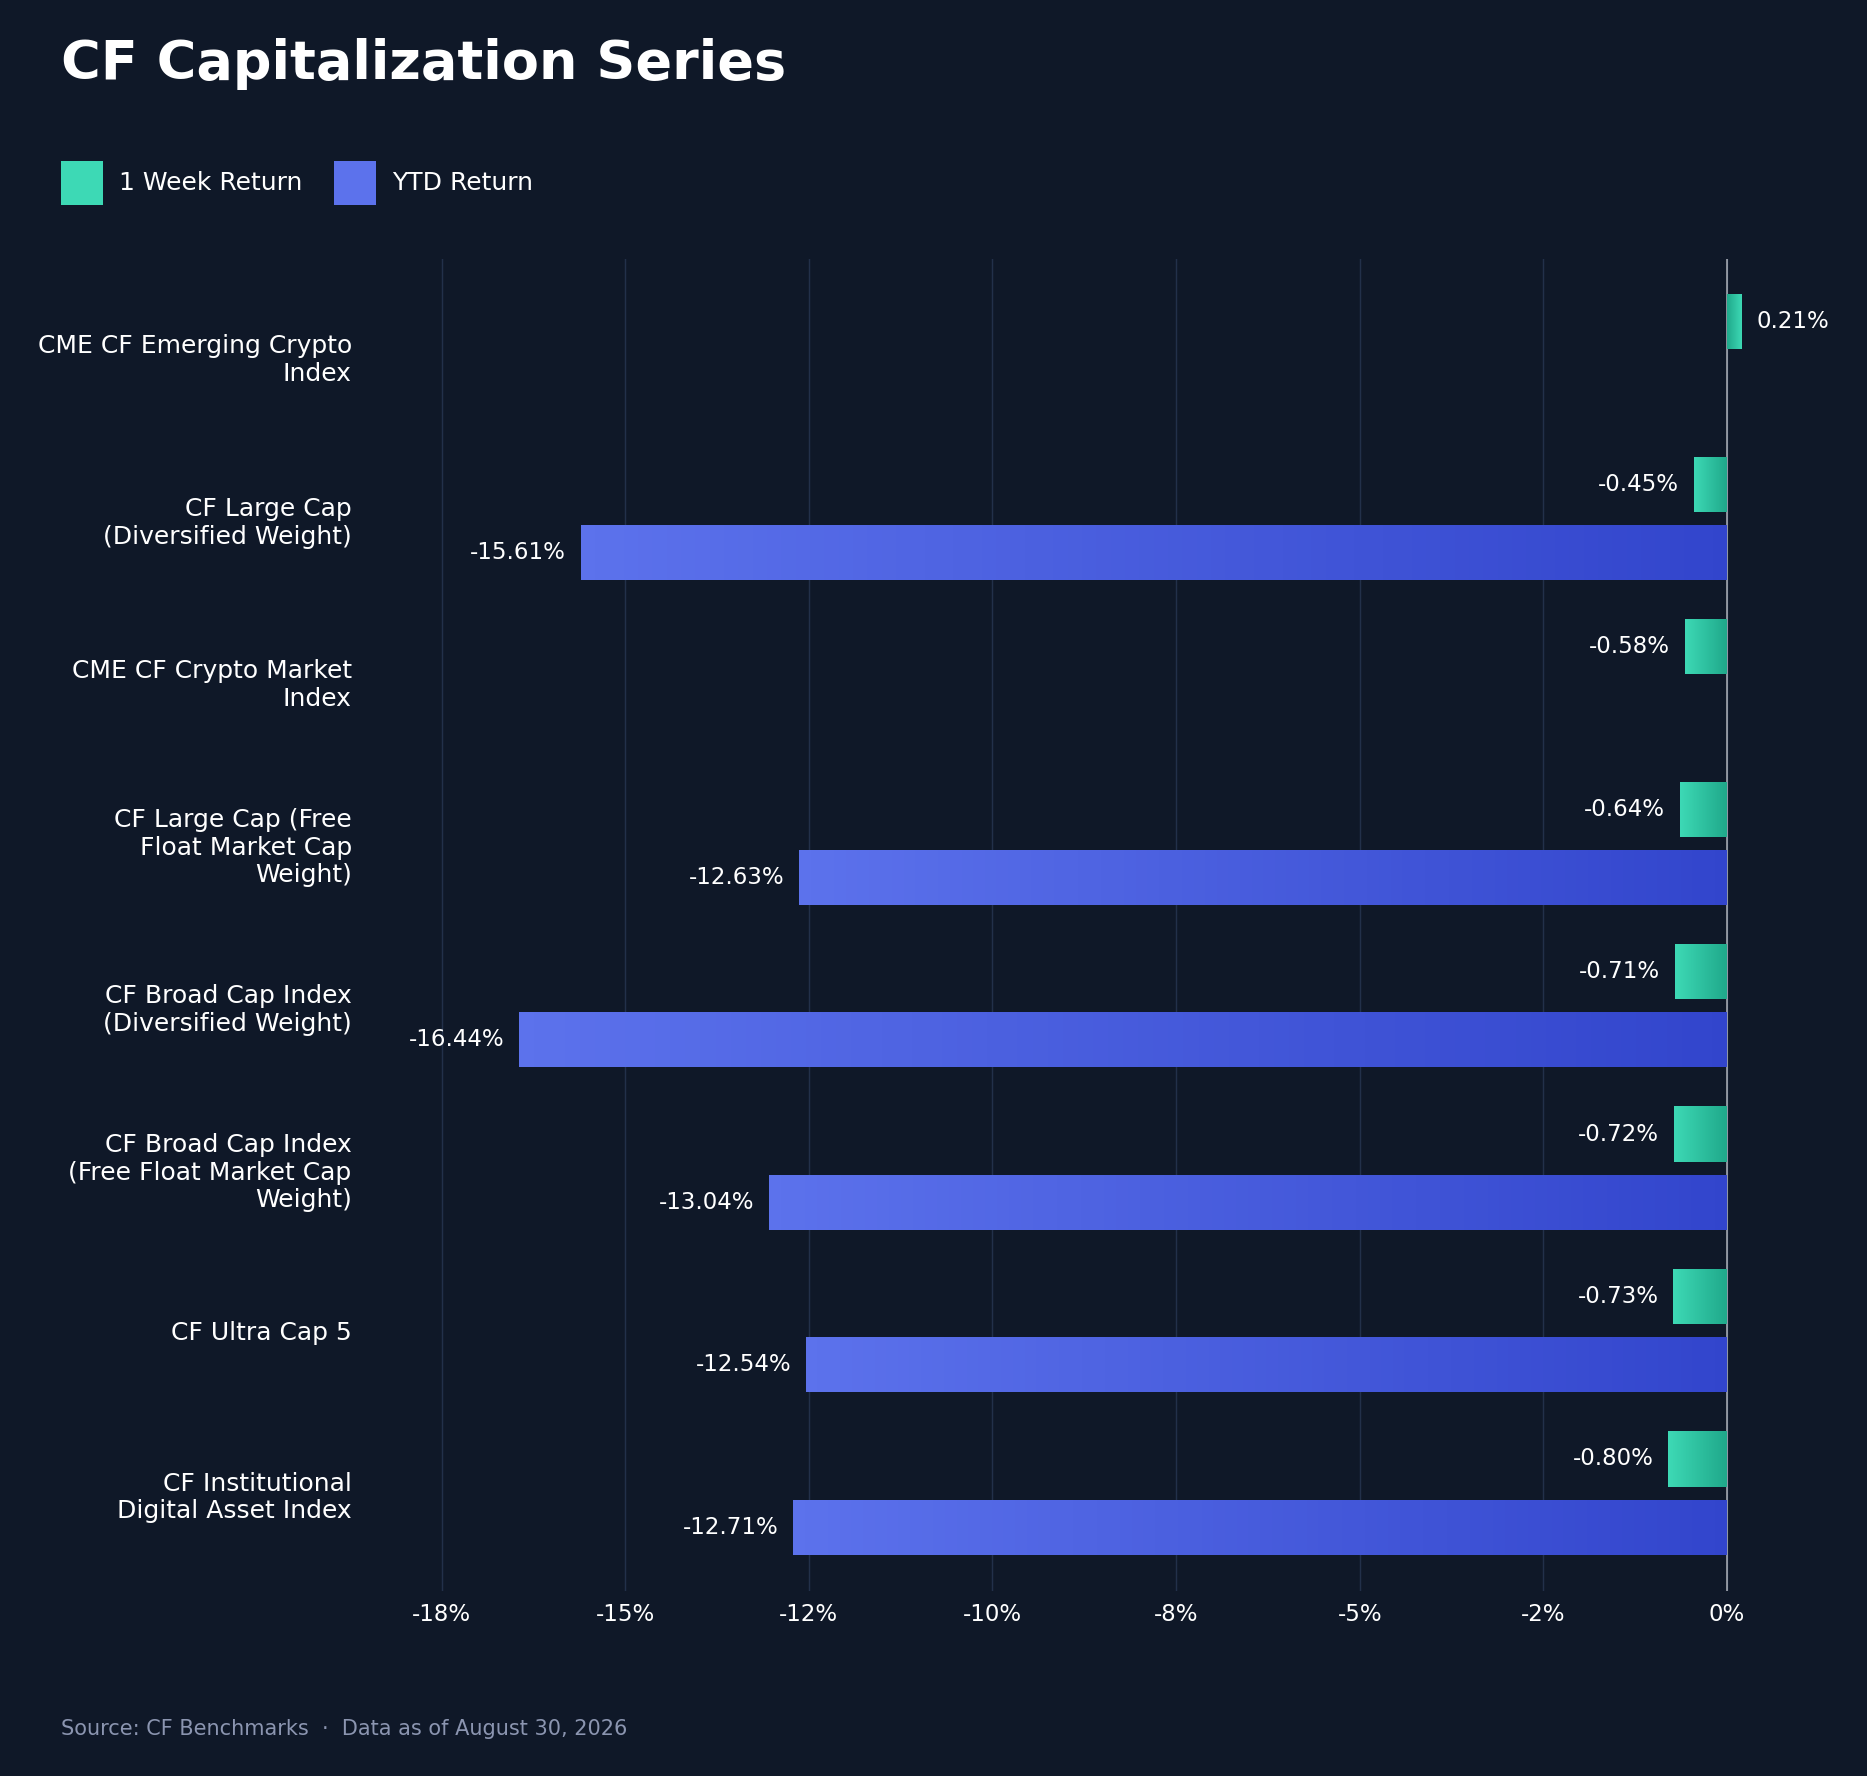
The CF Capitalization Series traded in an unusually tight band this week: the CME CF Emerging Crypto Index was the lone gainer at +0.21% w/w, ahead of CF Large Cap (Diversified Weight) at -0.45% (YTD -15.61%), the CME CF Crypto Market Index at -0.58%, CF Large Cap (Free Float Market Cap Weight) at -0.64% (YTD -12.63%), CF Broad Cap Index (Diversified Weight) at -0.71% (YTD -16.44%), CF Broad Cap Index (Free Float Market Cap Weight) at -0.72% (YTD -13.04%), CF Ultra Cap 5 at -0.73% (YTD -12.54%), and the CF Institutional Digital Asset Index at -0.80% (YTD -12.71%), a spread of just 1.01 pp between the best and worst index. The diversified-weight indices again edged out their free-float counterparts, Large Cap Diversified beating Large Cap Free Float by 0.19 pp and Broad Cap Diversified beating Broad Cap Free Float by 0.02 pp, both spreads far narrower than the moves themselves. The macro impulse behind Friday's reversal hit digital assets broadly rather than rotating within them: spot Bitcoin ETFs took in roughly $924.5m of net inflows across the week, including a $337.6m single-day intake on Monday, before that flow flipped to a $201.9m outflow on Friday, the same session Warsh's remarks were repricing rate expectations higher, and the liquidation cascade that followed ran across majors and alts together. Every cap index retained the large majority of last week's 24.20% to 29.02% surge, with breadth trading together on both the run into Friday's high and the give-back after it, consistent with a rates-driven de-risking rather than concentration in the largest-cap names.
Factors Analysis
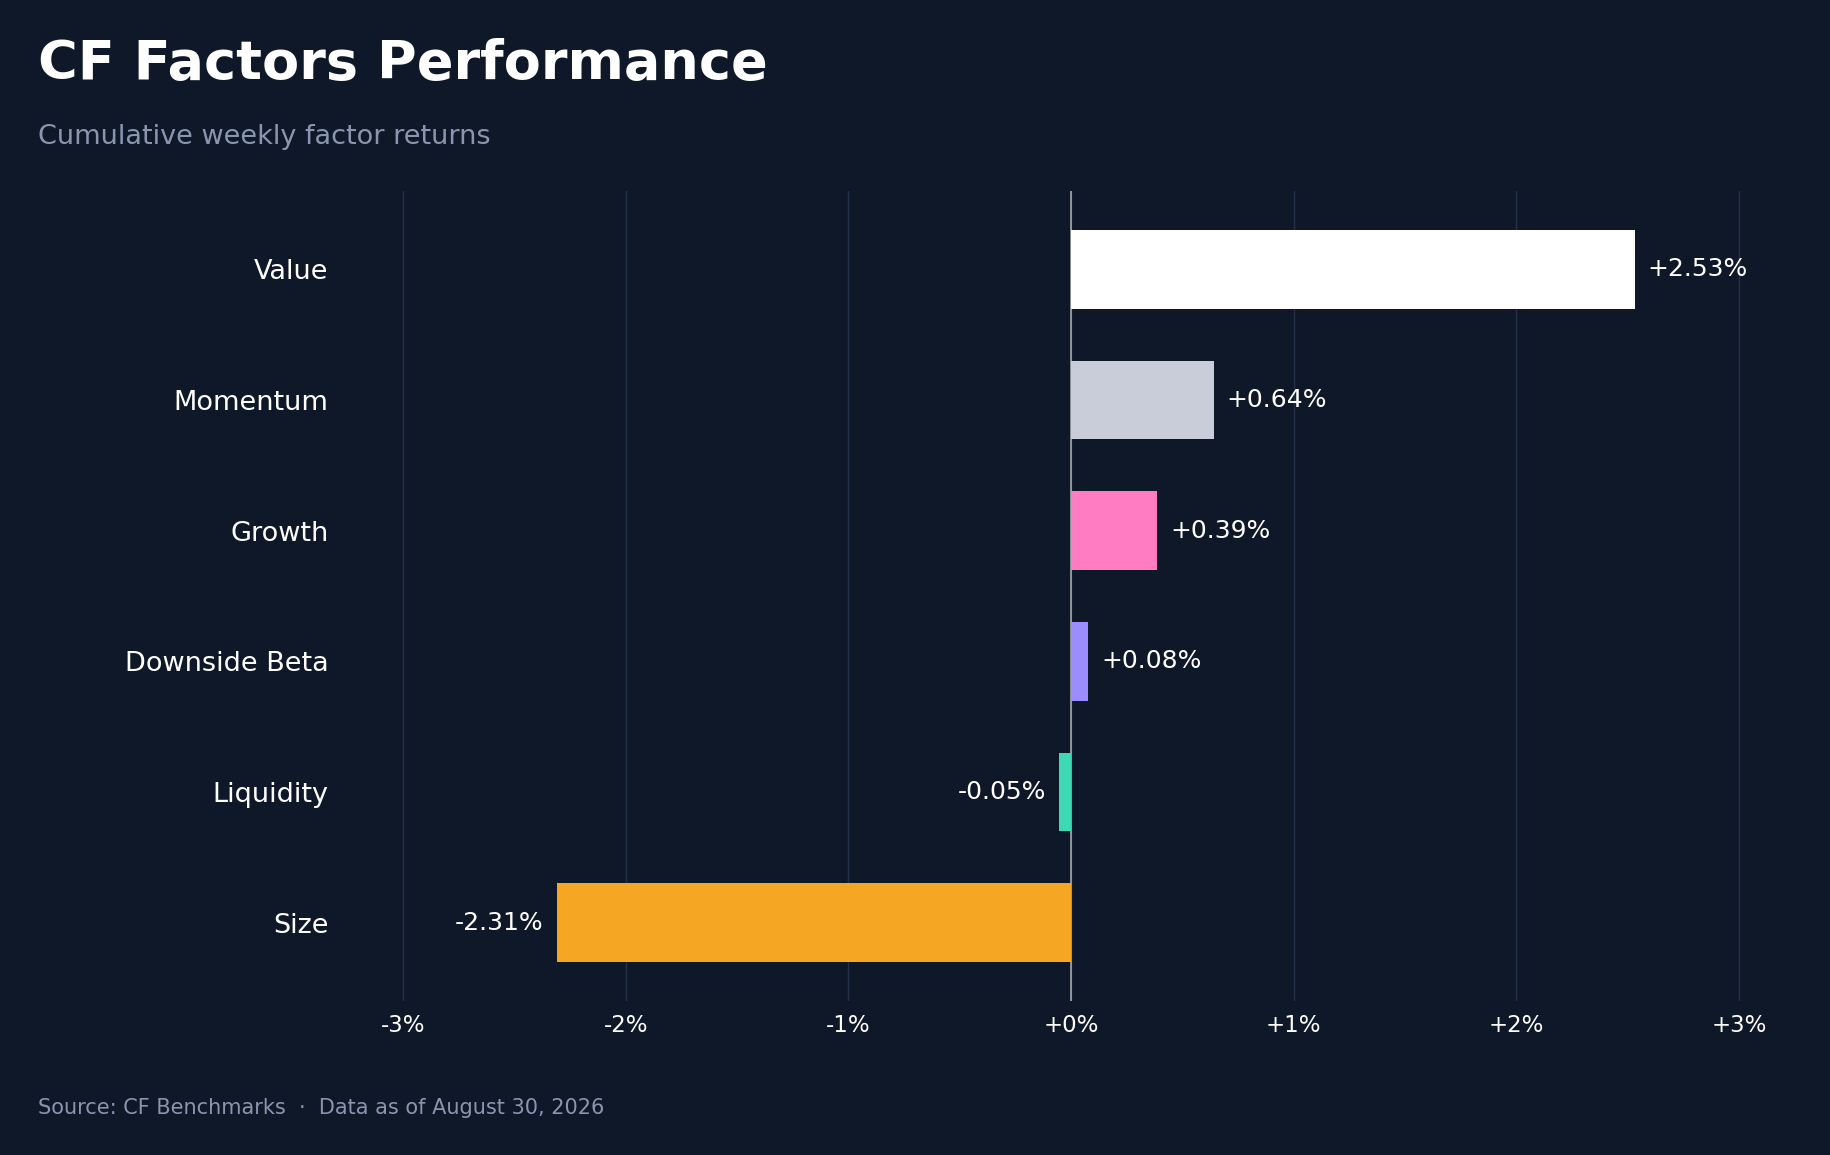
CF factor performance flipped from the prior week's ranking while the overall range compressed sharply. Value led at +2.53% cumulative for the week, followed by Momentum (+0.64%), Growth (+0.39%) and Downside Beta (+0.08%), while Liquidity (-0.05%) and Size (-2.31%) lagged, a current-week range of 4.84 pp against 12.64 pp a week earlier. The rotation against last week was the more telling figure: Value swung 7.57 pp from -5.04% to +2.53% and Downside Beta swung 5.76 pp from -5.69% to +0.08%, while Growth gave back 6.57 pp (from +6.96% to +0.39%) and Size reversed 5.89 pp (from +3.58% to -2.31%). A week that rewarded Value and Downside Beta while penalizing Size and Growth reads as a shift toward quality and away from small-cap and momentum-adjacent exposure, consistent with the risk-off impulse that ran through Friday's macro reversal.
Read our latest weekly crypto factors report: Factor Friday - August 28, 2026
Classification Series Analysis
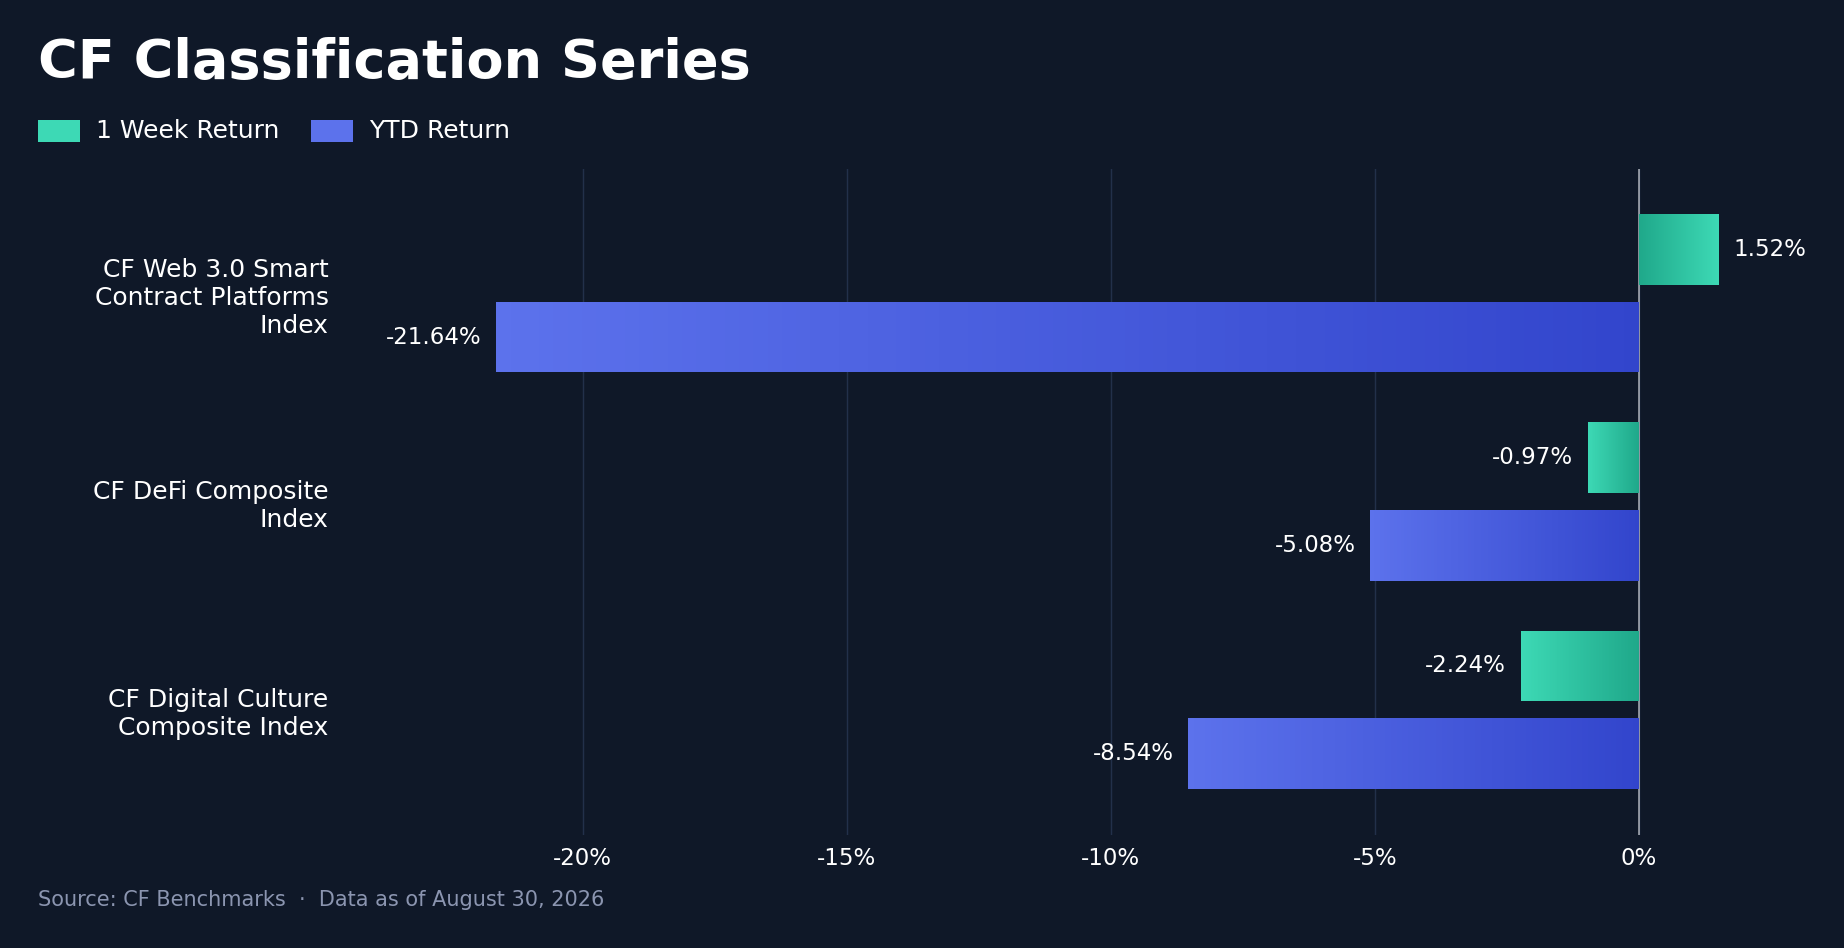
CF Web 3.0 Smart Contract Platforms Index was the only Classification Series composite to gain this week, +1.52% w/w (YTD -21.64%), ahead of CF DeFi Composite Index at -0.97% (YTD -5.08%) and CF Digital Culture Composite Index at -2.24% (YTD -8.54%), a 3.76 pp gap between the leader and laggard. The ranking inverted from a week earlier, when Digital Culture led the series at +43.29% and Web 3.0 Smart Contract Platforms brought up the rear at +28.84%; this week's relative strength in Web 3.0 tracks Solana's ETF-driven bid within the smart-contract-platform cohort, while Digital Culture's reversal to the bottom mirrors the meme-coin and gaming-heavy retracement detailed in Sector Analysis.
Sector Analysis
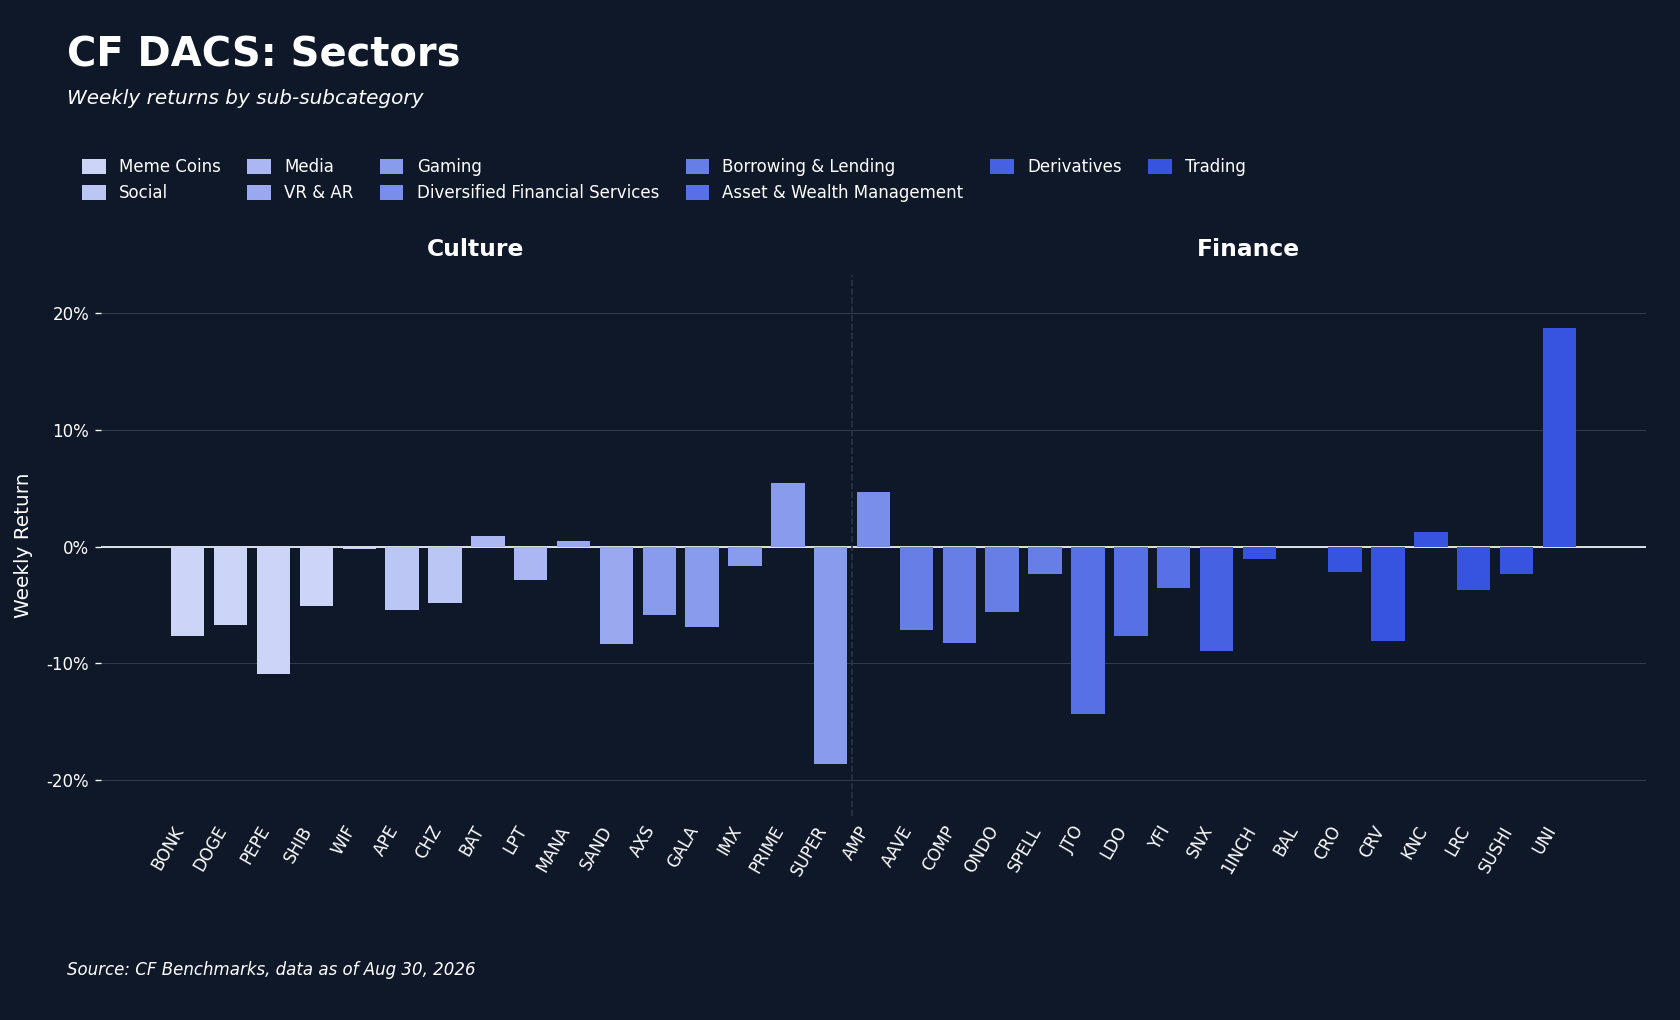
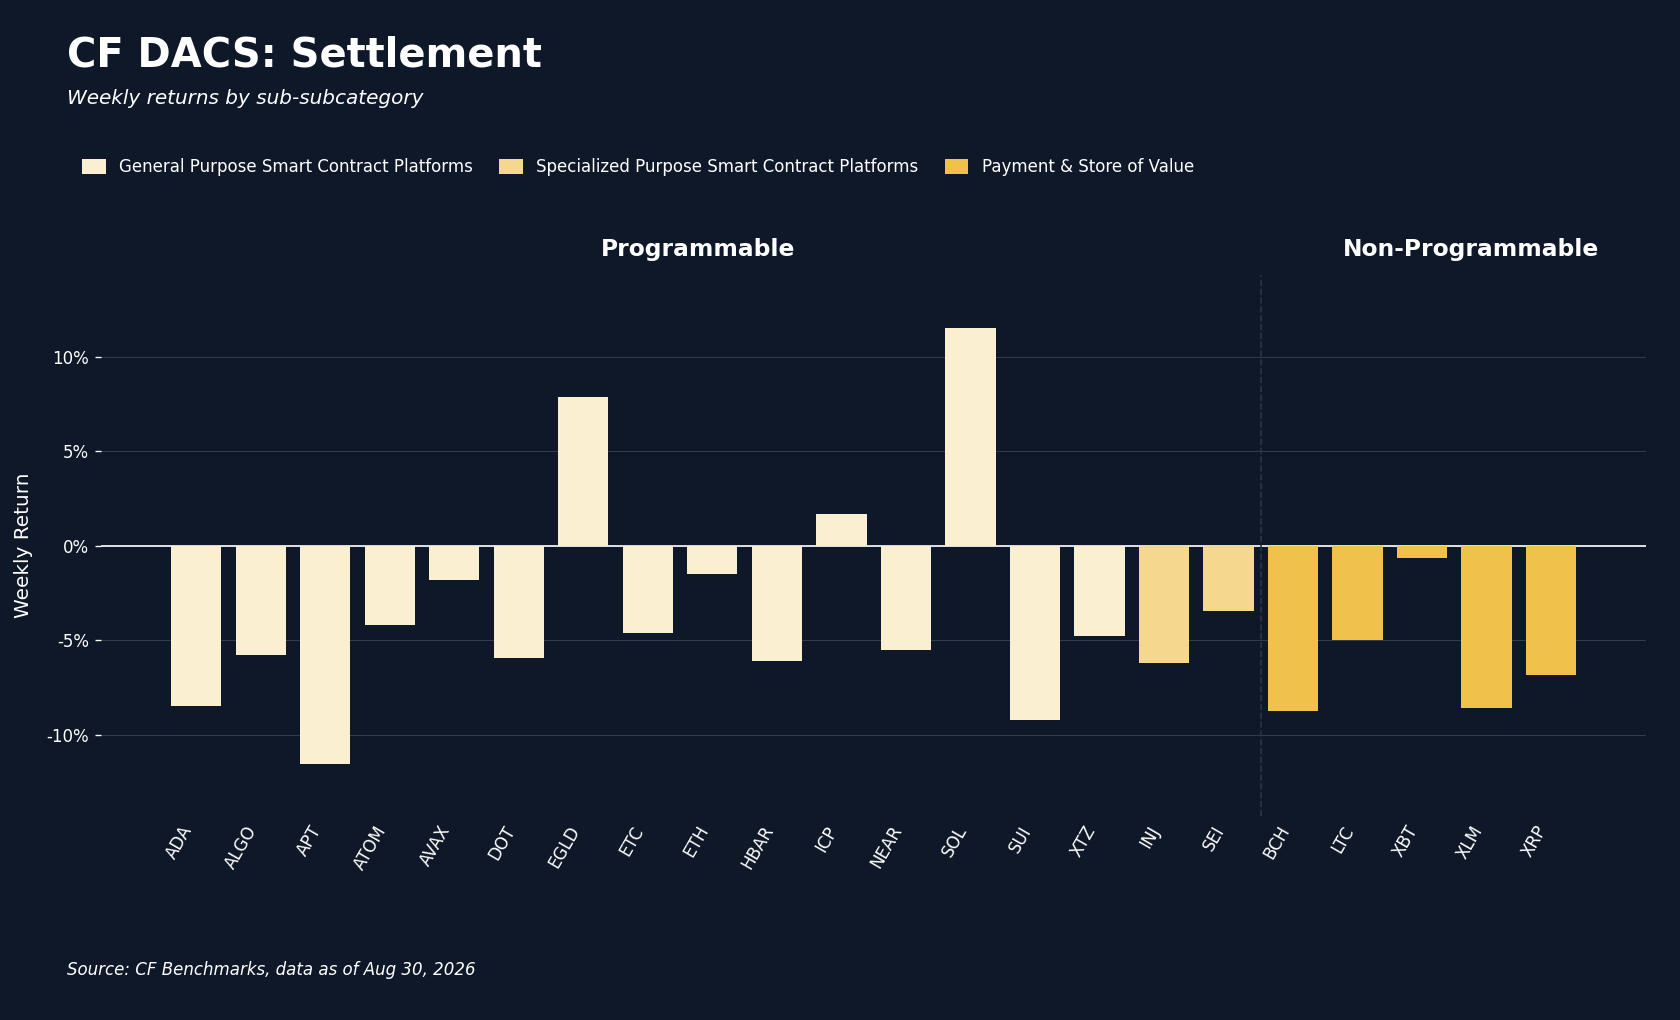
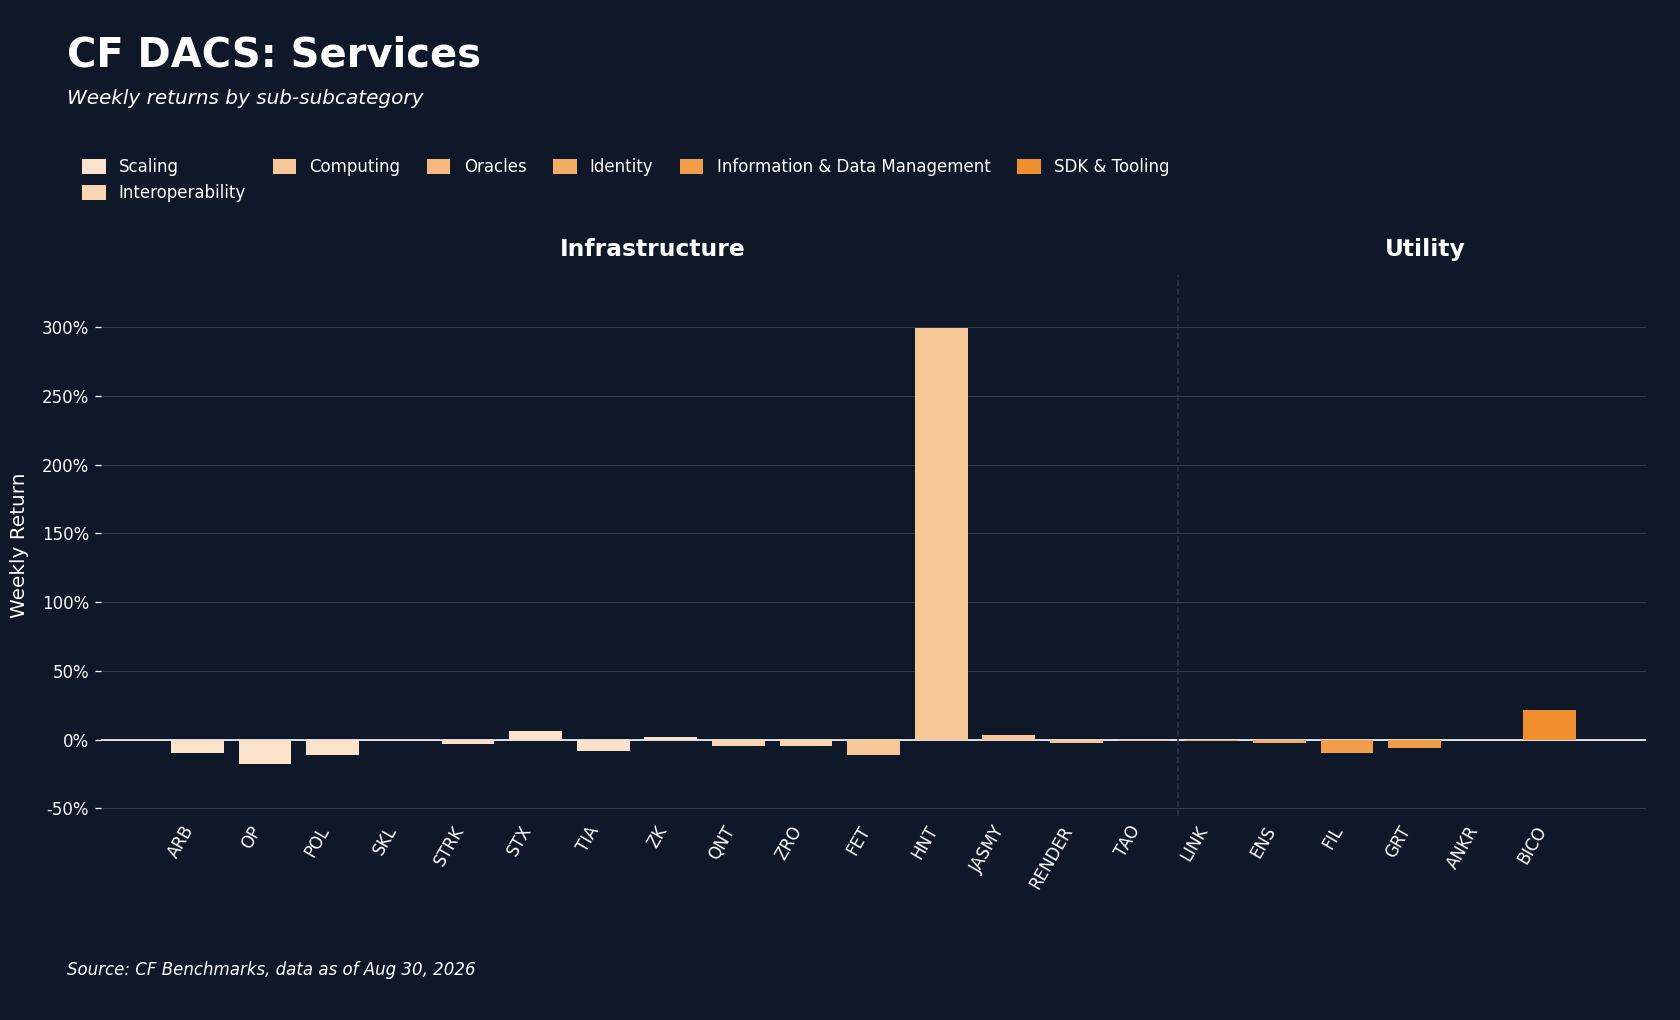
CF DACS Infrastructure was the week's only sub-category to average a positive return, +15.75% across its fifteen scored constituents, but that figure is a single-token artifact rather than a sector move: Helium (HNT) gained 299.65% w/w after the Texas city of Celina converted its municipal Wi-Fi network into carrier-grade coverage running on the Helium Network, a catalyst that triggered a short squeeze and had already pushed HNT up as much as 167% over the prior weekend. Strip HNT out and Infrastructure's remaining fourteen constituents averaged -4.53%, in line with the rest of the CF DACS universe; the sub-category's headline number should be read with that caveat attached. Utility was the only other sub-category to hold a positive average, +0.37%, lifted by Biconomy (BICO) at +21.93%, a move with no dated catalyst identified this week and left as an open question rather than a narrated cause. Excluding HNT's outsized move, the widest token-level spread across the CF DACS universe ran from BICO's +21.93% to SUPER's -18.61%, a 40.54 pp gap; including HNT, the nominal spread widens to 318.26 pp, a reminder that a single constituent can swing a sub-category average on its own. Fifty-nine of the seventy-six tokens in our universe finished the week lower, underscoring that this week's headline dispersion sat almost entirely in a small number of idiosyncratic movers against an otherwise broadly negative tape.
CF Staking Series
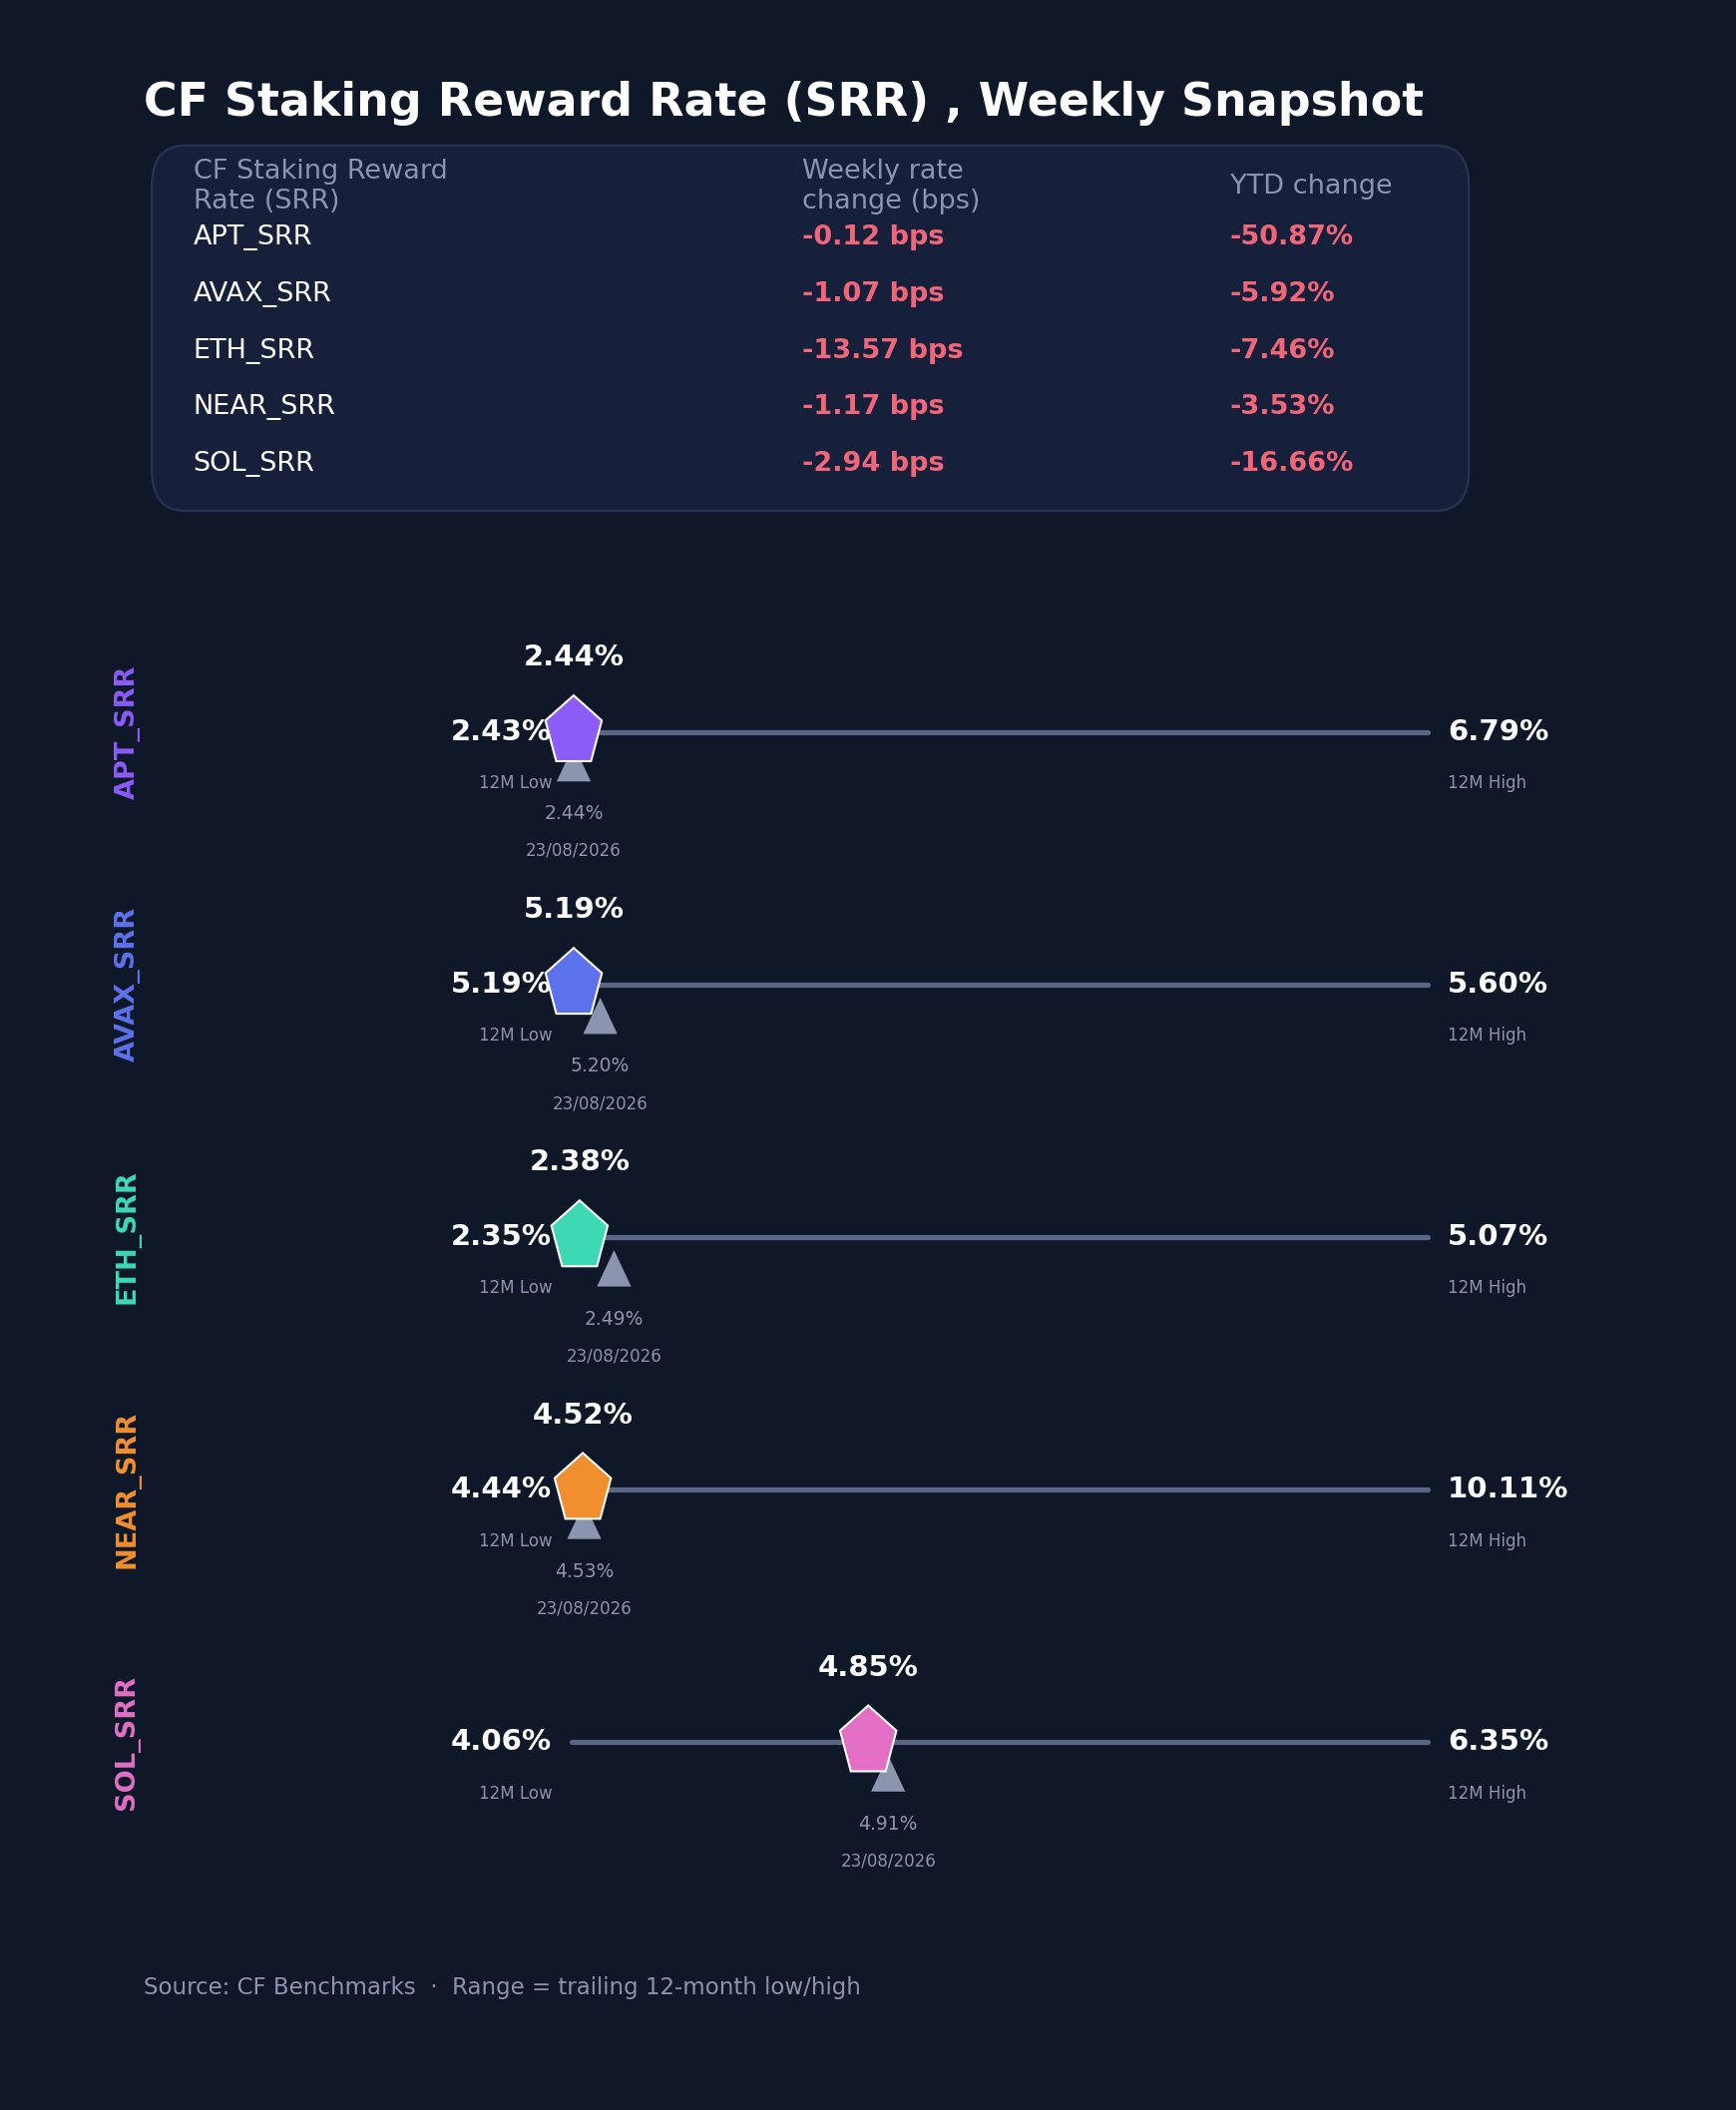
CF Staking Series relative index returns were negative across all five constituents this week, led by Aptos (APT) at -0.05% and Avalanche (AVAX) at -0.21%, followed by Near Protocol (NEAR) at -0.26% and Solana (SOL) at -0.60%, while Ether (ETH) lagged sharply at -5.40%, an order of magnitude worse than any other name in the series. Reward rates fell across the board too: ETH's staking reward rate dropped 13.57 bps to 2.3768% from 2.4863% a week earlier, more than four times the next-largest move (Solana's 2.94 bps decline, to 4.8541% from 4.9073%), while Avalanche, Near Protocol and Aptos each moved less than 1.2 bps (to 5.1861%, 4.5166% and 2.4382% respectively). The current reward-rate range across the series runs from ETH's 2.3768% to Avalanche's 5.1861%, a spread that widened this week as ETH's rate fell further from the pack. No dated validator-economics catalyst explains ETH's larger reward-rate decline; we treat it as a continuation of the broader risk-off tape's pressure on the index rather than a distinct staking-market event.
Interest Rate Analysis
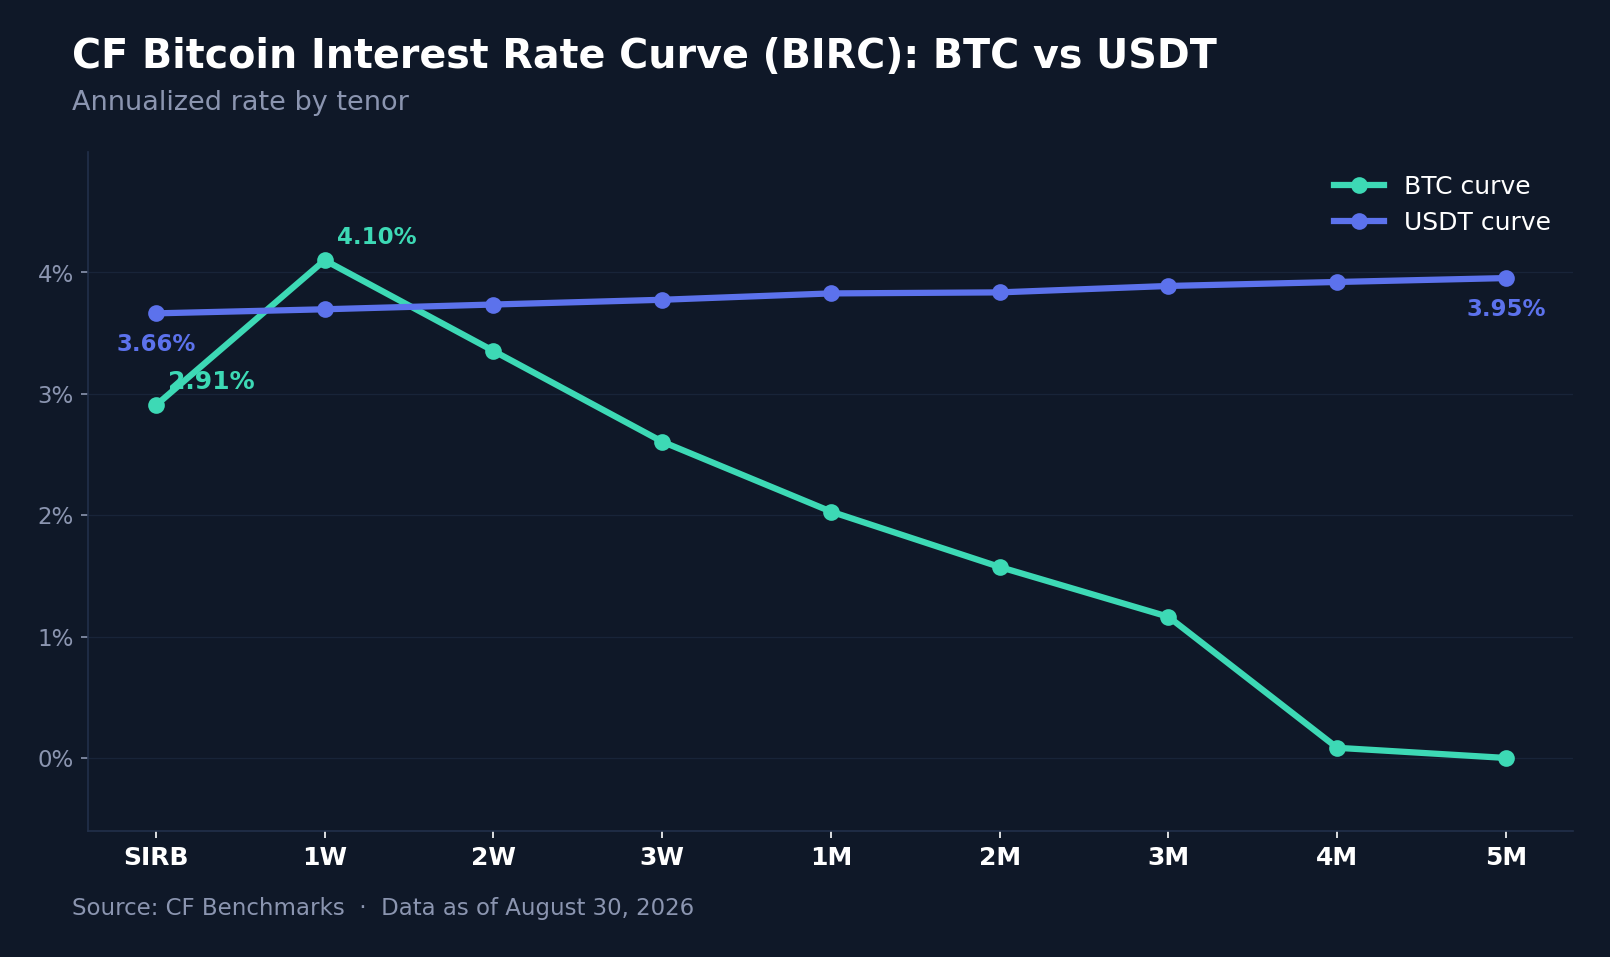
The BTC curve's front end inverted from a week ago: the Short-term Interest Rate Benchmark (SIRB) collapsed 366.1 bps to 2.9055% from 6.5664%, falling below the 1-week (1W) tenor at 4.1005% (itself up 10.5 bps), a shape flip from the prior week when SIRB sat above 1W. From there the BTC curve declined steadily through the term structure, to 3.3530% at 2-week (2W, -20.4 bps), 2.6056% at 3-week (3W, -30.2 bps), 2.0295% at 1-month (1M, -1.1 bps), 1.5733% at 2-month (2M, +13.1 bps), 1.1629% at 3-month (3M, +0.7 bps), and effectively to zero by 4-month (0.0837%, -63.5 bps) and 5-month (0.0000%, unchanged). The USDT curve moved in the opposite direction and far more uniformly, rising 20.8 to 22.5 bps across every tenor from 3.6625% at SIRB to 3.9532% at 5M, a near-parallel shift that left its gently upward-sloping shape essentially intact. The BTC curve was this week's idiosyncratic curve: its tenor-change range of -366.1 to +13.1 bps dwarfs the USDT curve's tight 20.8-to-22.5 bps band, and the SIRB collapse in particular is consistent with the Friday deleveraging event compressing near-term demand for BTC-denominated borrow just as leveraged positions were being flushed out.
Closing Synthesis
This was a week where the headline index numbers understated how much changed underneath. Fed Chair Warsh's hawkish Jackson Hole debut delivered a real, evidenced shock, a $488m liquidation event and a three-to-four percent intraday reversal in Bitcoin, yet the CF Capitalization Series gave back less than a percentage point of the prior week's 24-to-29 percent debasement-trade rally. The more durable signals sat beneath that headline: a factor market that rotated firmly toward Value and away from Size, a Bitcoin funding curve whose front end cracked even as its belly and back held together, an implied-volatility surface that compressed at the money while bidding up deep downside protection, and two idiosyncratic single-name stories, Solana's ETF-driven strength and Helium's sub-category-distorting short squeeze, that did more to move the week's dispersion than any broad rotation. We read digital assets as still absorbing an extraordinary prior week's gains rather than a market that has turned: the index-level restraint coexisted with real dispersion in factors, the funding curve and single-name catalysts, and the modest net decline is better explained by how much of last week's rally proved sticky than by how forcefully this week's catalysts hit.
The information contained within is for educational and informational purposes ONLY. It is not intended nor should it be considered an invitation or inducement to buy or sell any of the underlying instruments cited including but not limited to cryptoassets, financial instruments or any instruments that reference any index provided by CF Benchmarks Ltd. This communication is not intended to persuade or incite you to buy or sell security or securities noted within. Any commentary provided is the opinion of the author and should not be considered a personalised recommendation. Please contact your financial adviser or professional before making an investment decision.
Note: Some of the underlying instruments cited within this material may be restricted to certain customer categories in certain jurisdictions.
Factor Friday - October 9, 2026
Size led CF Benchmarks' factor table for a second week at 2.58% as the Market fell 4.98%. Size held after QNT's reversal, though its cohort spread narrows sharply without three outlier tokens, and Downside Beta and Liquidity gave back part of last week's gains.

Mark Pilipczuk
Small Cap Tokens Outperform in September
The CF Free-Float Broad Cap Index rose 10.28% in September as Bitcoin supplied 59% of the gain while trailing the index. Returns across the Capitalization Series ran from +7.74% for Ultra Cap 5 to +14.01% for Emerging Crypto, which holds no Bitcoin, as altcoins outpaced Bitcoin.
Mark Pilipczuk
CF Digital Asset Index Family Multi Asset Series – Extraordinary Rebalance Announcement
CF Digital Asset Index Family Multi Asset Series - Extraordinary Rebalance Announcement
CF Benchmarks
By clicking Accept, you consent to CF Benchmarks's use of cookies.
Visit Cookie Settings to learn how CF Benchmarks uses cookies and to adjust your preferences.