
Oct 07, 2026
Small Cap Tokens Outperform in September
Monthly Attribution - September 2026
The CF Free-Float Broad Cap Index rose 10.28% in September, with Bitcoin supplying 59% of the gain while returning less than the index itself. September was an altcoin month measured through Bitcoin-weighted benchmarks: Bitcoin returned less than every CF index that held it, so across the Capitalization Series the order of returns ran inverse to Bitcoin’s share of the gain, from +7.74% for the CF Ultra Cap 5 Index to +14.01% for the CME CF Emerging Crypto Index, which holds no Bitcoin. The two largest single-name returns, Quant at +363.26% and NEAR at +181.68%, followed institutional adoption and access news on September 24 rather than the rate path.
Market Recap
Financial conditions tightened through September and digital assets rose anyway. August payrolls added 162,000 jobs, headline CPI held at 3.4% year over year, and core prices rose 0.3% on the month against 0.2% expected. On September 16 the Federal Reserve raised its target range a quarter point to 3.75% to 4.00%, its first hike since July 2023, in a unanimous 12-to-0 vote. The 10-year Treasury yield reached 5.02% on September 15, its highest since 2007, and closed at 5.24% on September 28, while renewed US and Iranian strikes around the Strait of Hormuz took Brent from about $97 on September 7 to above $105 on September 24.
Policy cut both ways, and Bitcoin’s path followed it. A Senate cloture vote on the CLARITY Act failed 49 to 50 on September 15, short of the 60 votes required, and Bitcoin set its September low near $75,000 that day, a day before the Fed decision. The SEC issued a five-year Innovation Exemption for onchain trading of tokenized stock on September 17, and Bitcoin rose above $85,000 on September 21 for the first time since January as about $648 million of short positions were liquidated. US spot Bitcoin ETFs took in $2.65 billion in September, below August’s $3.52 billion but the second-largest month since October 2025, including a 2026-record $999 million on September 21 that turned year-to-date flows positive. US spot Ether ETFs took in $832 million, against $1.85 billion in August.
The read-through is that rates did not set the direction of the month. Bitcoin’s share of total crypto market capitalization fell below 60% in the week to September 26 and stood at 58.3% on September 28, and the largest single-name gains in CF indices followed asset-specific events on September 24: The Clearing House selected Quant for its tokenized deposit network, and the Bitwise NEAR ETF registered on NYSE Arca. The gains were crypto-specific, and Bitcoin’s weight in each benchmark determined how much of them each index kept.
Bitcoin Supplied the Gain While Lagging the Index
The CF Free-Float Broad Cap Index rose 10.28% over the month, with Settlement assets contributing 9.55 percentage points of the advance. Bitcoin returned +8.39%, below the index, yet contributed +6.07% on a 72.41% weight, 59% of the gain, with Ether adding +1.22% and Solana +0.65%. The Services and Sectors categories returned +50.83% and +22.81% but carried only 2.23% of weight and contributed +0.42% and +0.32%. One level down, Non-Programmable assets contributed +6.78% and Programmable +2.77%, and Programmable returned +14.14% on 19.57% of weight against +8.67% for Non-Programmable on 78.20%. Dispersion across the index suite was wide, from +7.74% for the CF Ultra Cap 5 Index, where Bitcoin supplied 70% of the gain, to +50.75% for the CF Services Category Index, which holds no Bitcoin.
Broad Cap: Where the Return Came From
The CF Free-Float Broad Cap Index holds 35 constituents, and Settlement represented 97.77% of its post-rebalance weight. At 72.41%, Bitcoin passed its own return through almost one-for-one, and because that return was below the index’s, the headline depended on what the rest of the basket did. Bitcoin, Ether and Solana together contributed +7.95%, and the other 32 names added +2.34%. Among the three, return rose as weight fell, with Bitcoin at +8.39%, Ether at +10.63% and Solana at +17.99%, so the largest weight earned the smallest return.
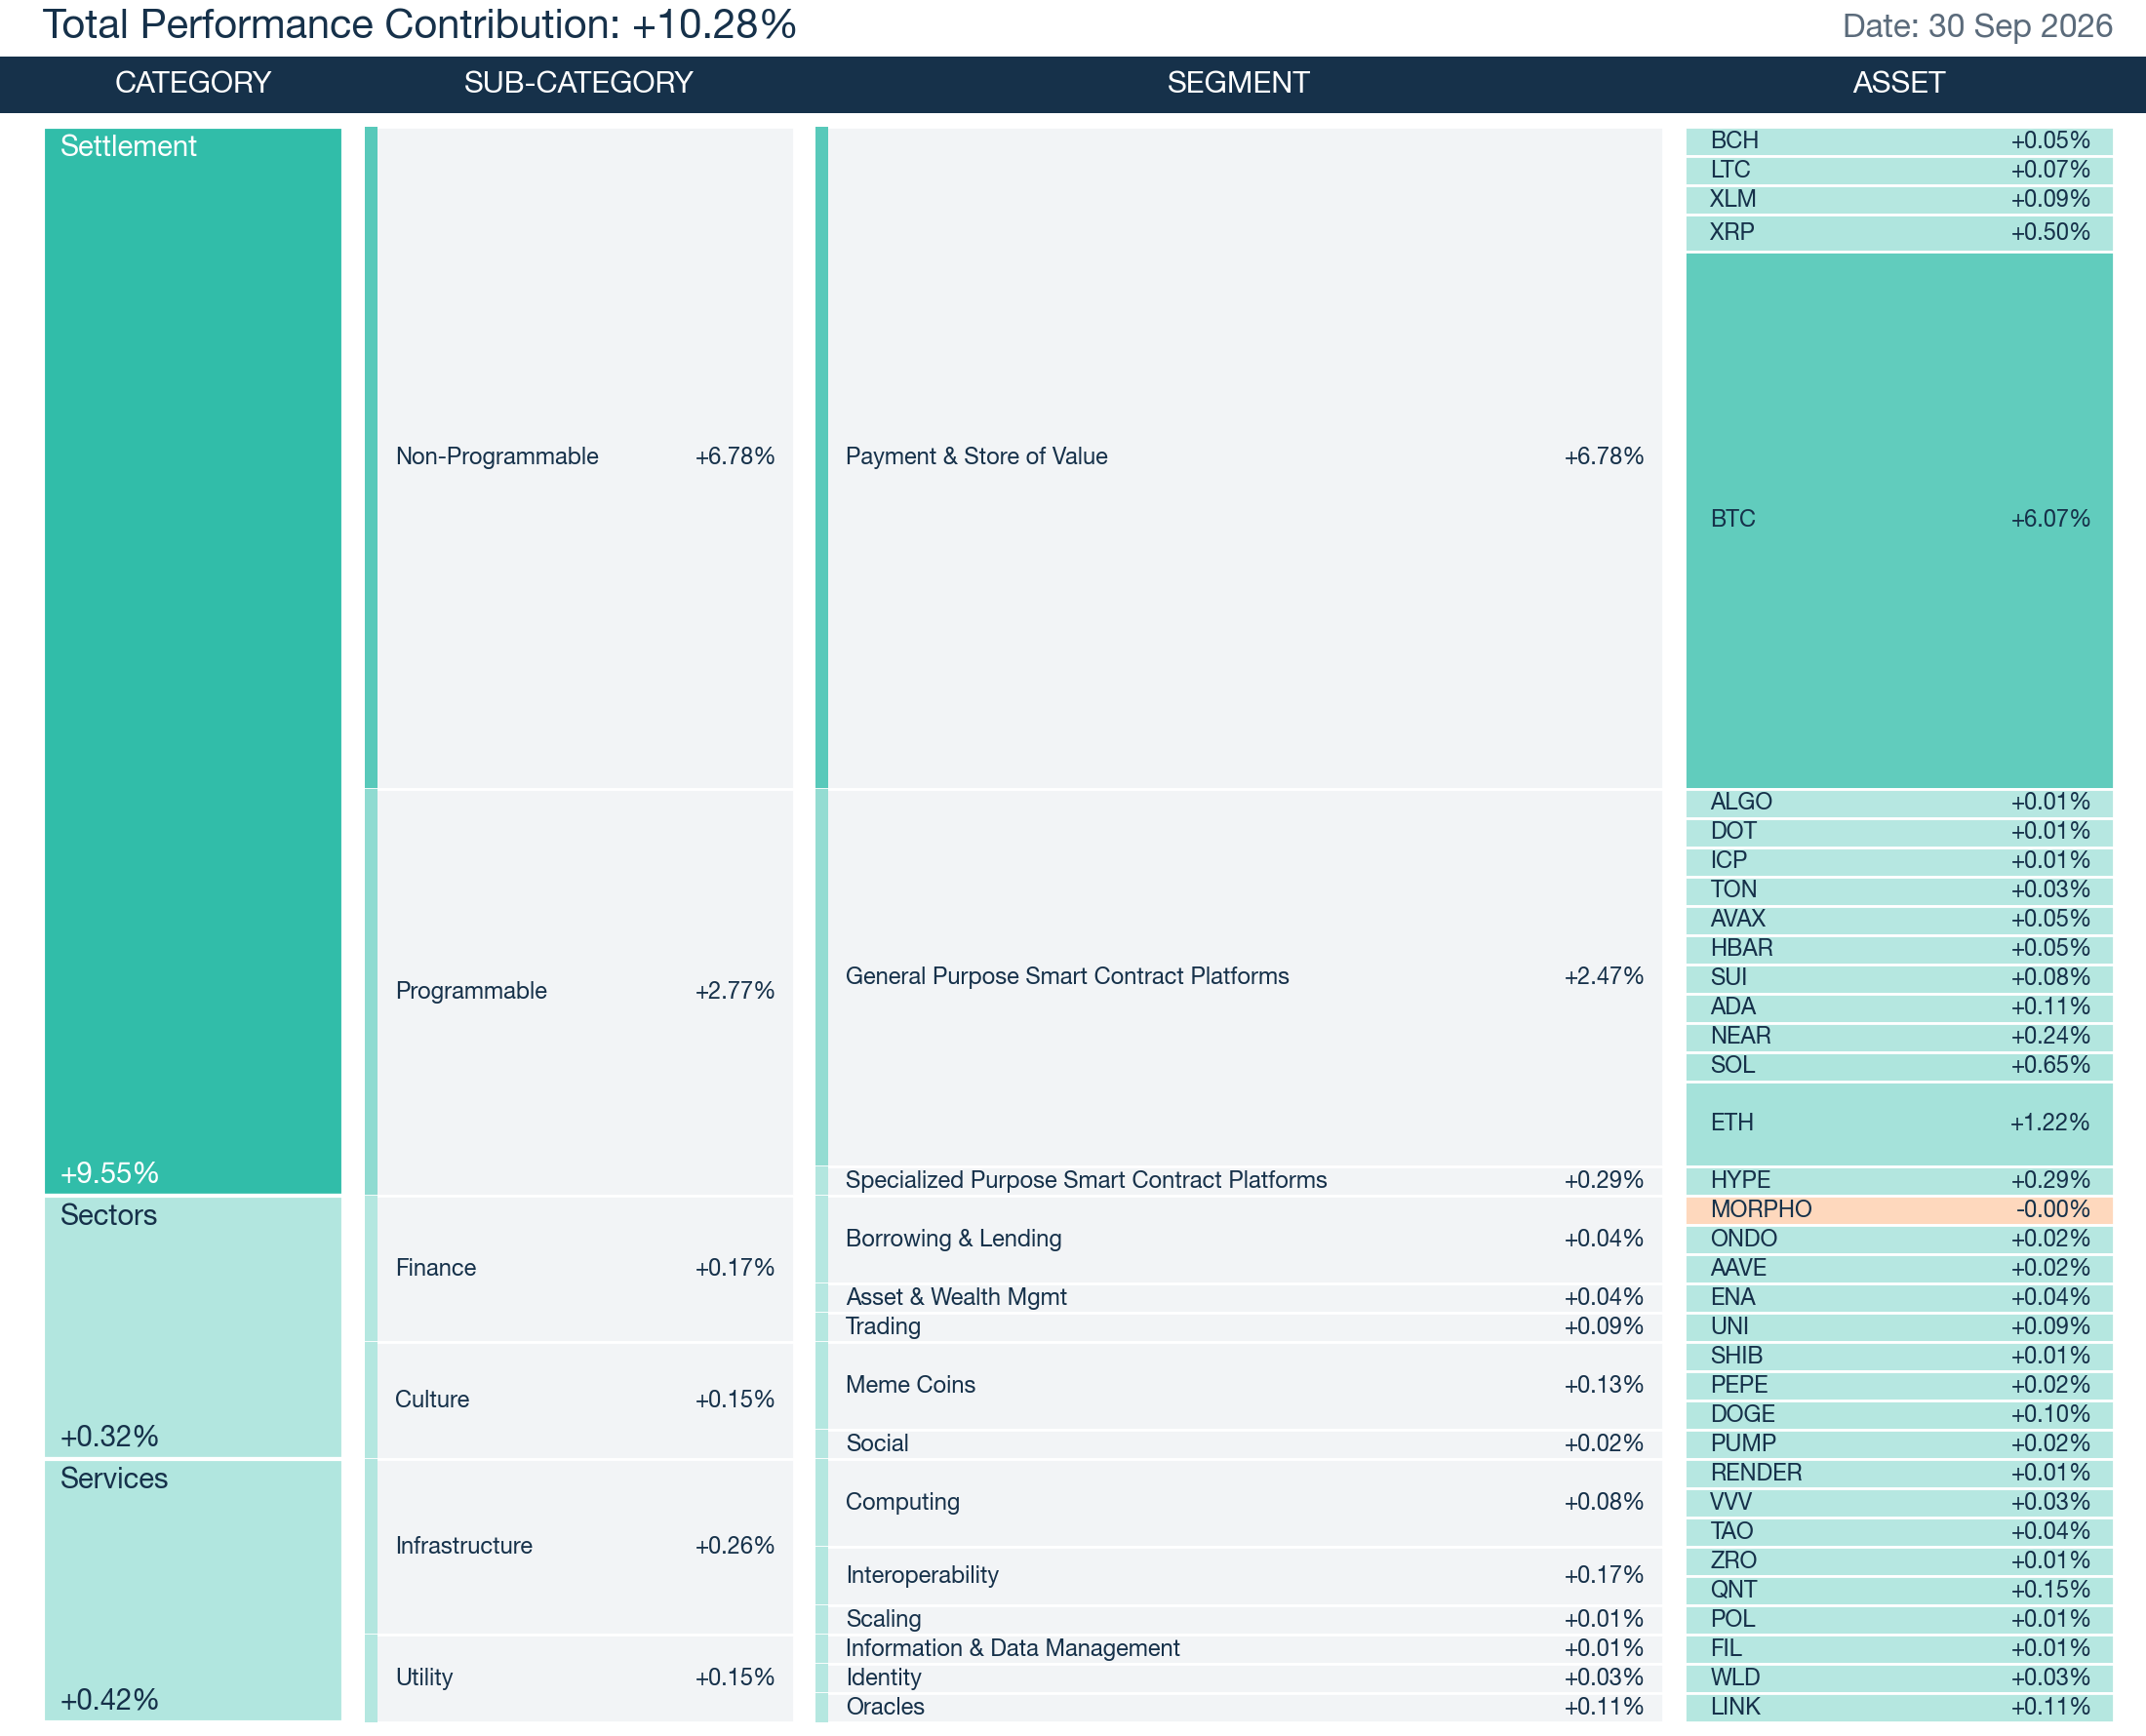
The contribution breakdown shows the same concentration. By segment, Payment & Store of Value contributed +6.78% and General Purpose Smart Contract Platforms +2.47%, with the long tail adding the remainder. Interoperability posted the highest segment return, +261.24%, on 0.06% of weight, which shows how little a very large return moved a basket this concentrated.
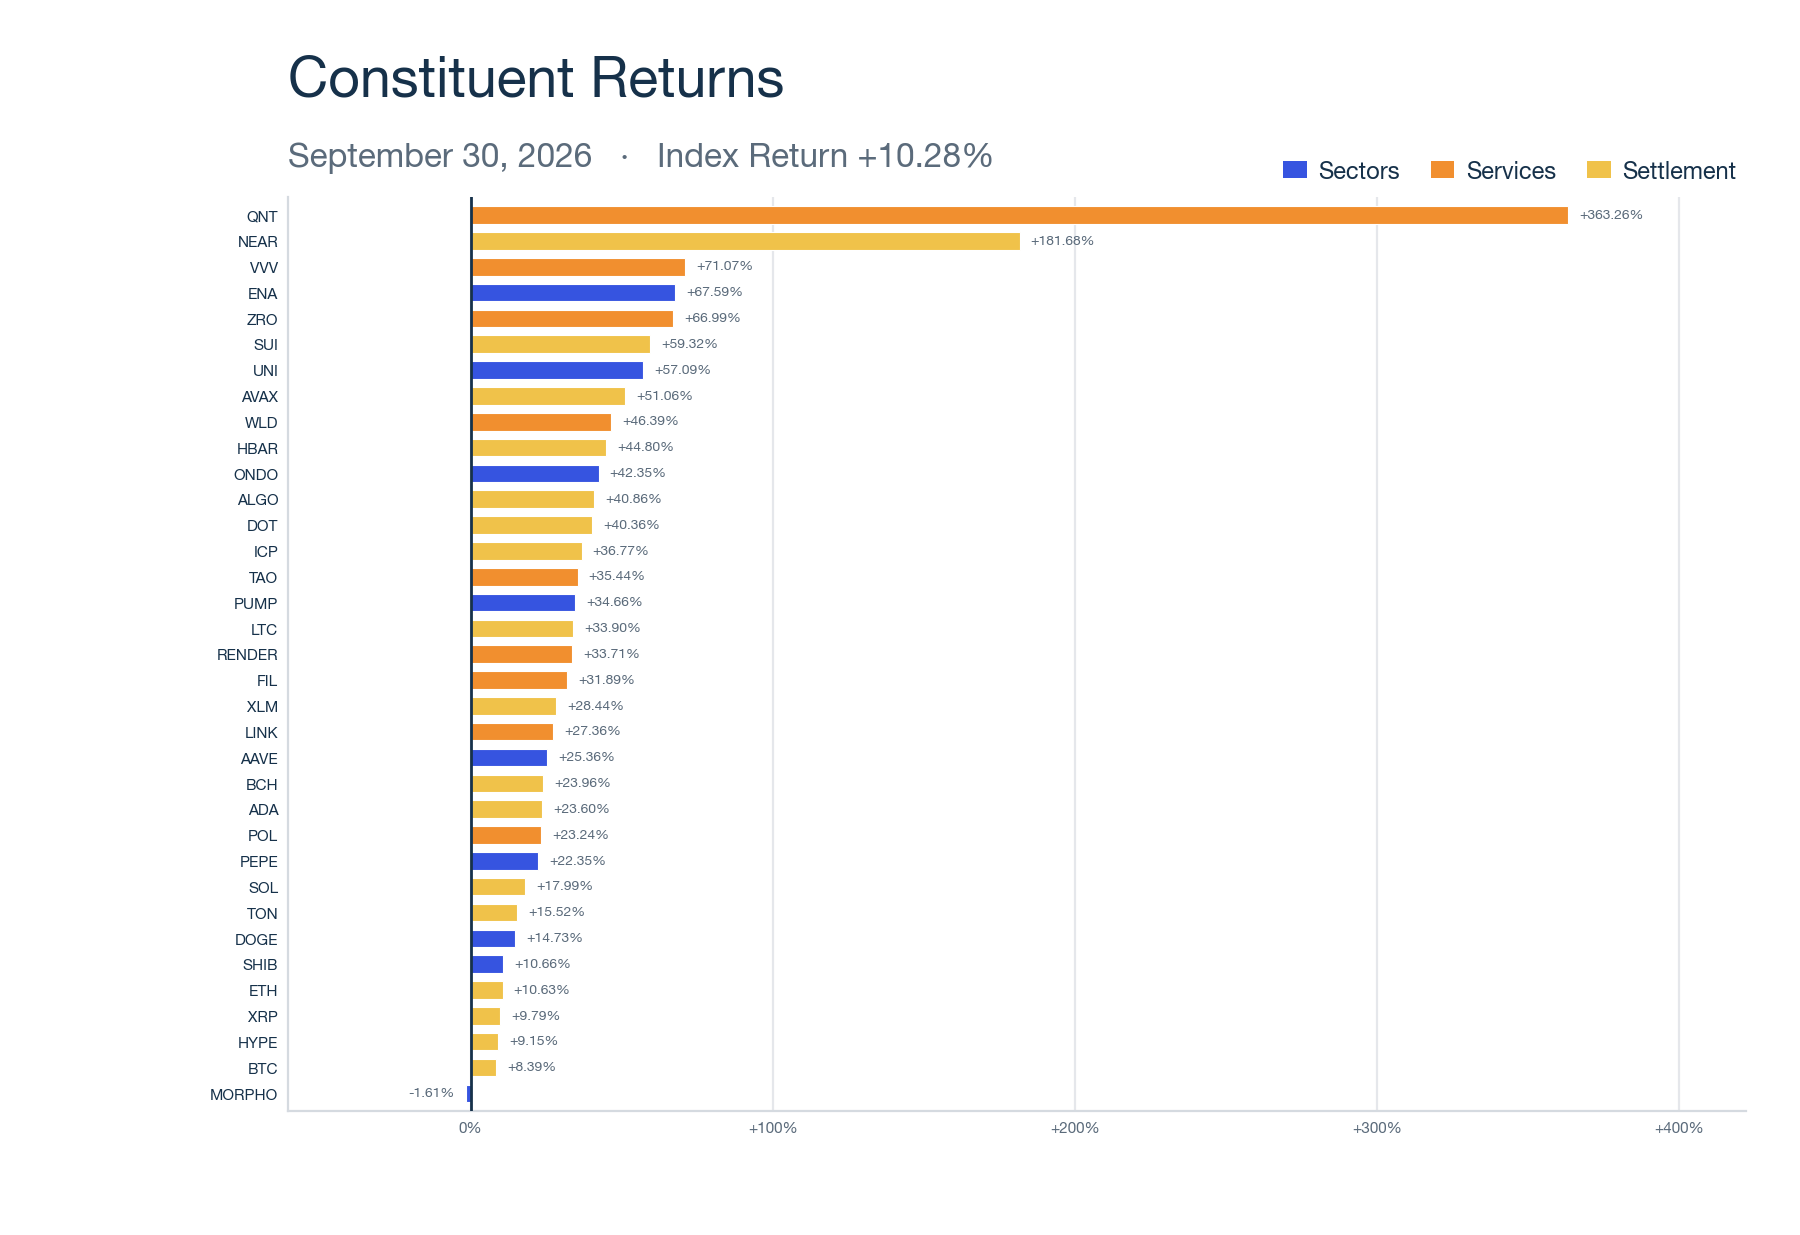
The September 1 reconstitution added MORPHO, TON and VVV, three small-weight names that together carried about 0.36% of post-rebalance weight, with TON the largest at 0.21%. Bitcoin’s weight fell by approximately 0.7 percentage points to 72.41% and Ether’s from 11.93% to 11.50%, helping fund the additions. For allocators benchmarking to the index, the entrants left sensitivity to Bitcoin and the large-capitalization core largely unchanged.
Across the Capitalization Series
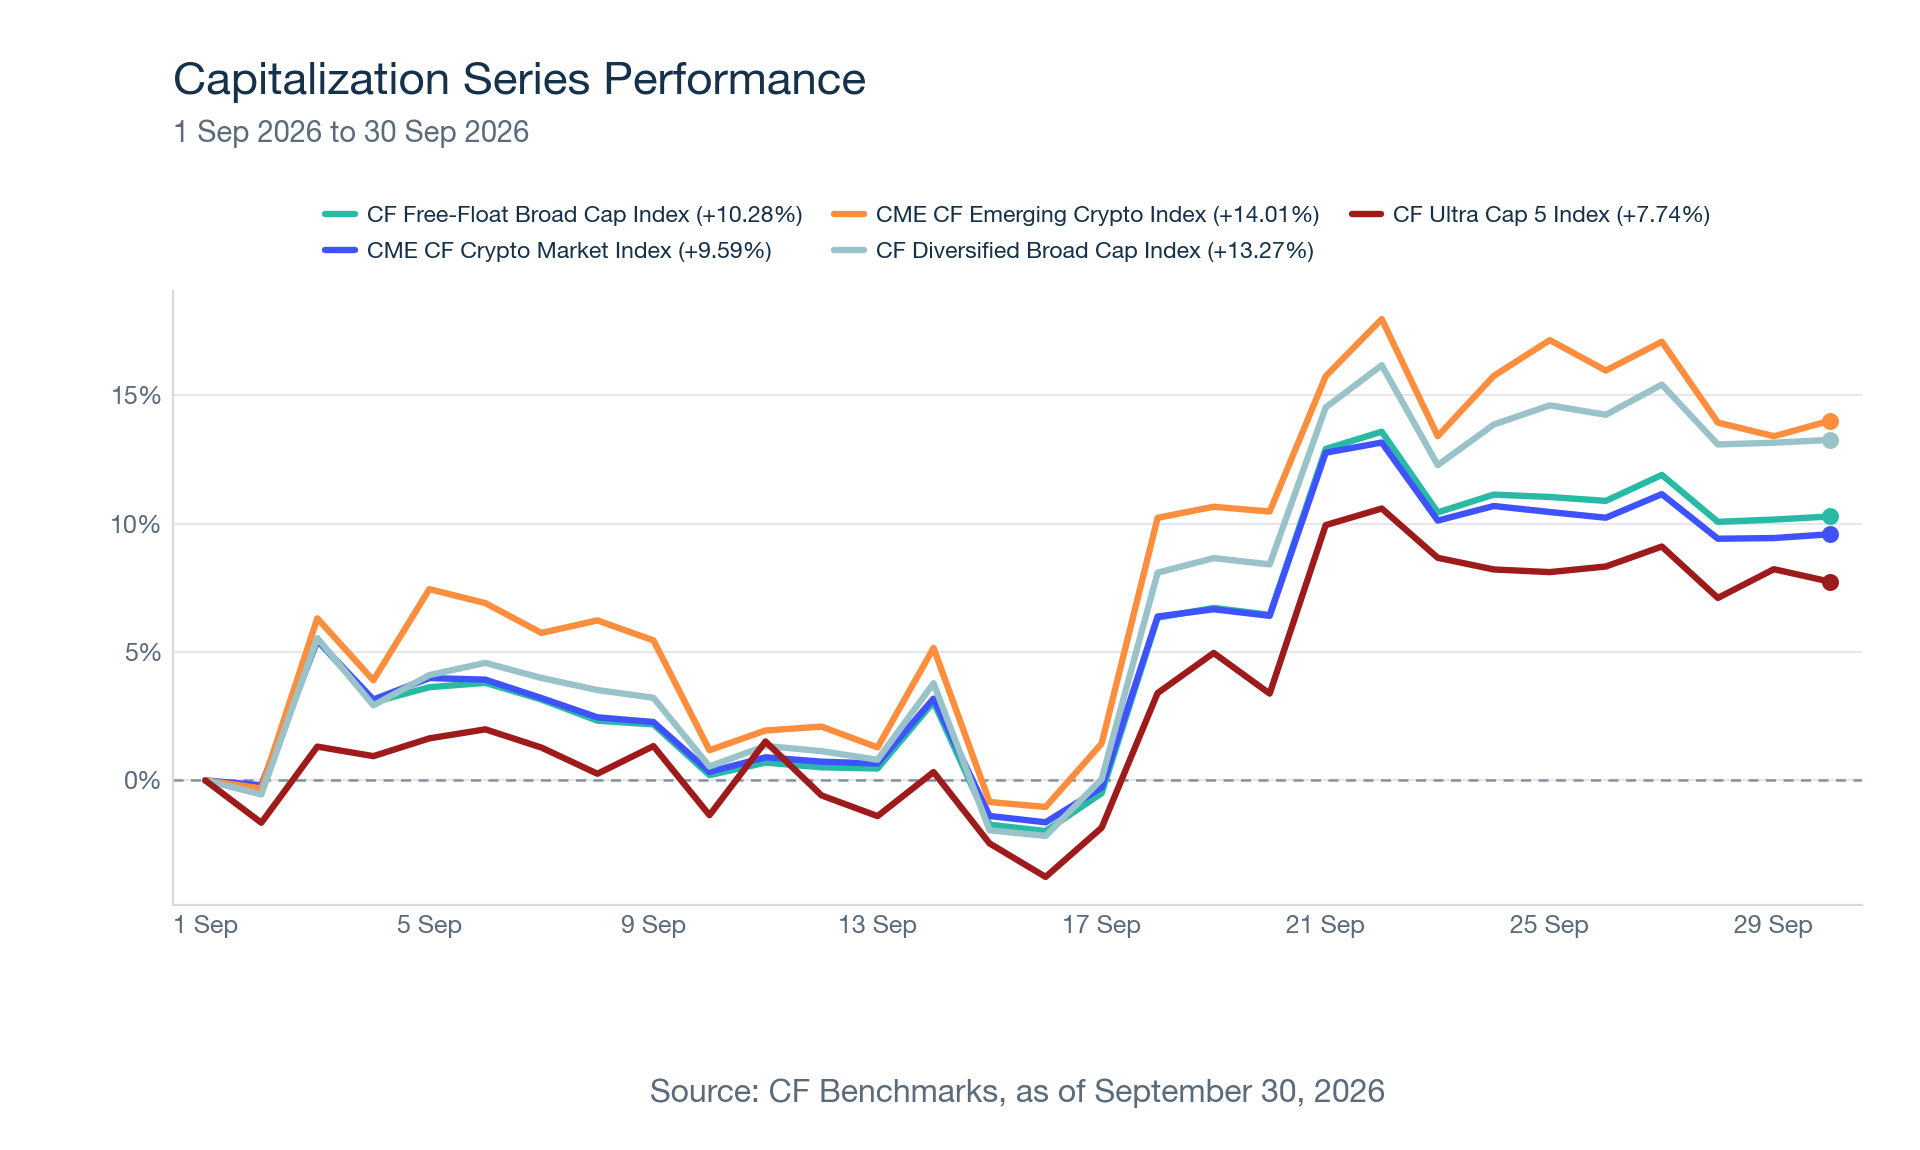
September’s returns across the Capitalization Series ran in reverse order to Bitcoin’s share of the gain. The CF Ultra Cap 5 Index returned +7.74% with Bitcoin supplying 70% of it, the CME CF Crypto Market Index returned +9.59% (63%), the CF Free-Float Broad Cap Index +10.28% (59%), the CF Diversified Broad Cap Index +13.27% (24%) and the CME CF Emerging Crypto Index +14.01%, which holds no Bitcoin.
The CF Ultra Cap 5 Index had the family’s highest Bitcoin share of the gain and its lowest return. Bitcoin’s 75.44% post-rebalance weight set the result, and the index’s own fixing time put Bitcoin’s return at +7.18% against +8.39% in the total-return baskets. Hyperliquid replaced Cardano in the reconstitution at 3.46%, and Solana, at +16.77%, was the best performer of the five.
The CF Diversified Broad Cap Index holds the same 35 names as the Free-Float index but caps Bitcoin at 38.13%, which cut Bitcoin’s share of the gain to 24%, a +3.20% contribution against +6.07% in Free-Float. Names the larger index barely held could then contribute, with NEAR adding +0.66% and Quant +0.42%, and the index returned nearly three percentage points more. The reconstitution added TON at 0.57%, alongside MORPHO and VVV, and the five largest holdings totaled 88.60% of post-rebalance weight.
The CME CF Crypto Market Index held 12 names with Bitcoin at 71.59% and returned 69 basis points less than Free-Float, as the 30 names beyond the five majors the two share added +1.55% in Free-Float against +1.04% for the seven in this index. The CME CF Emerging Crypto Index returned the most in the series with Bitcoin absent, leaving BNB, at 28.17% of the index, as the largest contributor at +3.58%.
Across the Classification Series
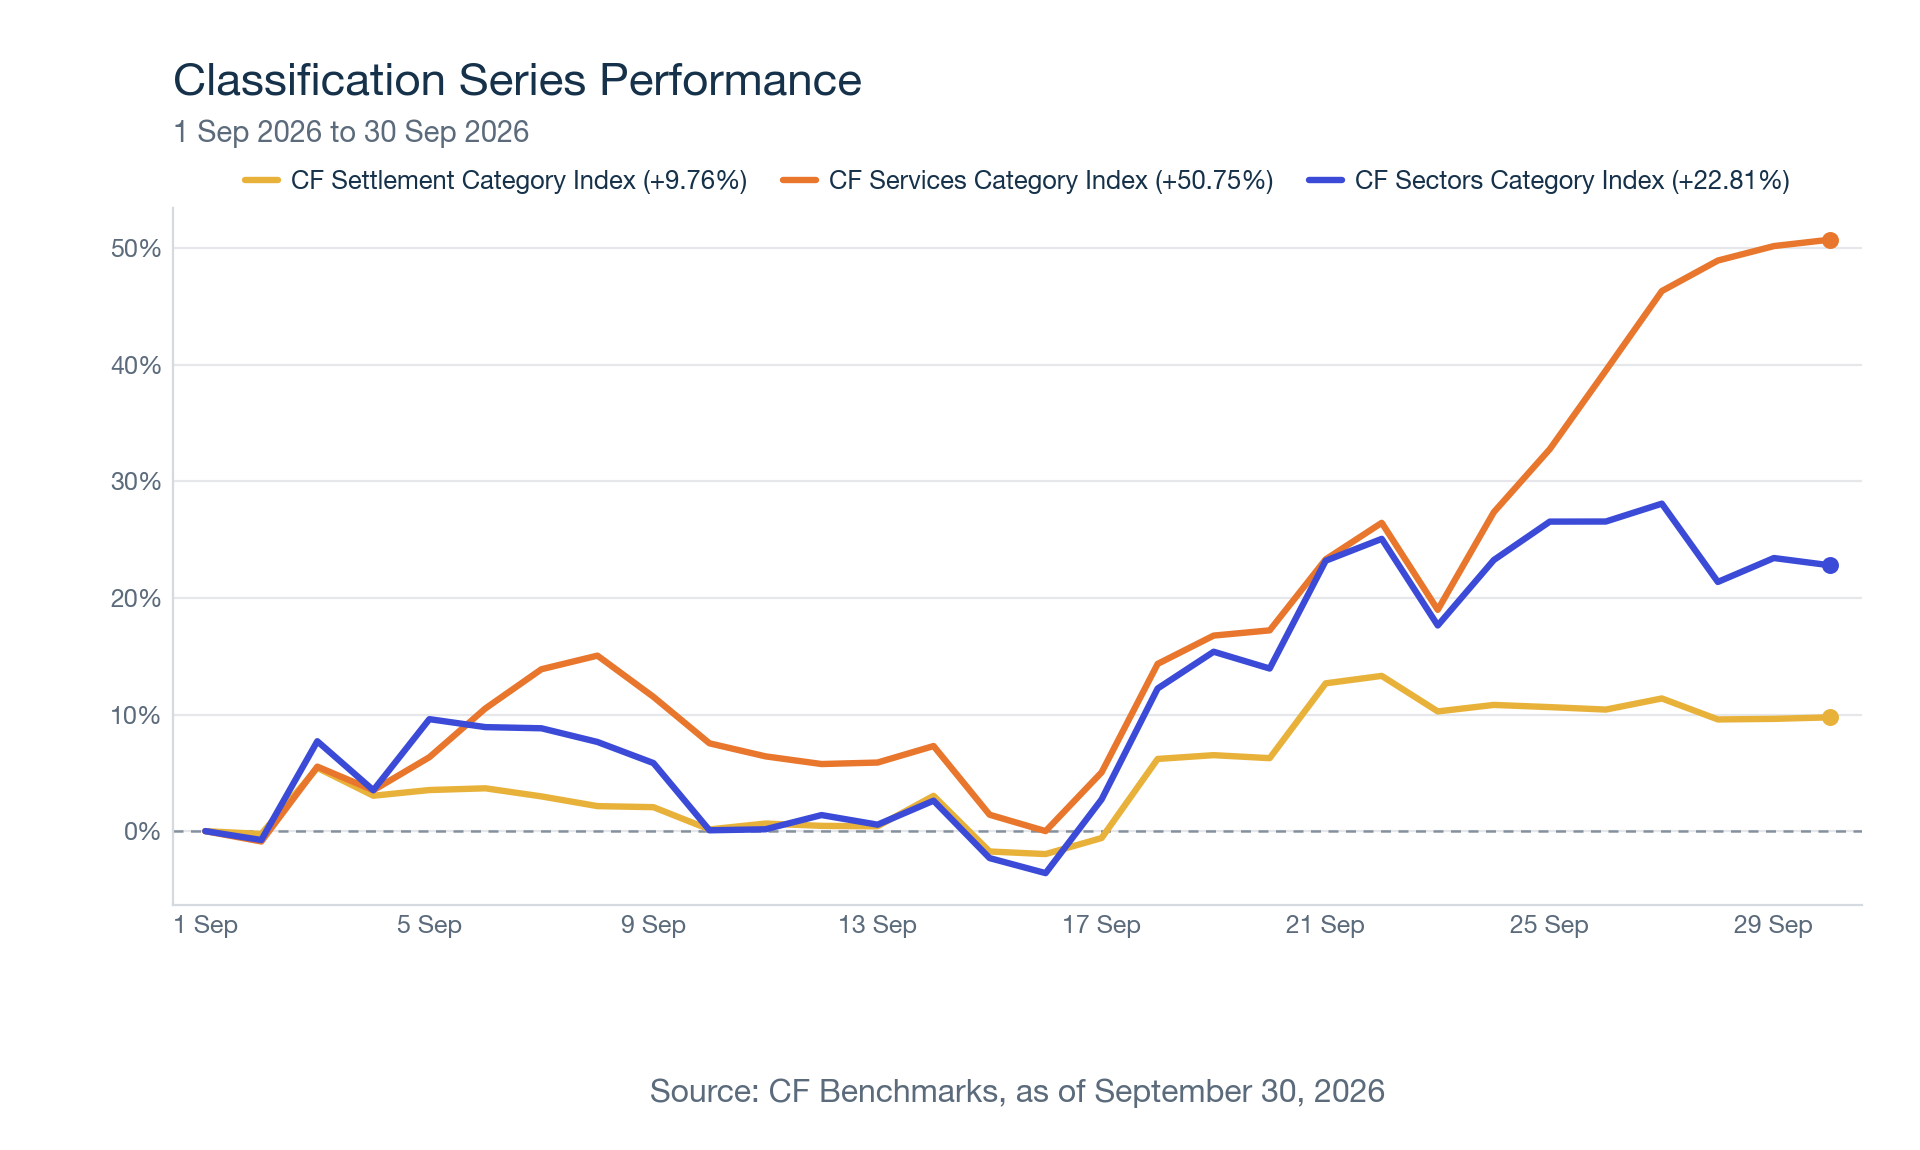
The two CF DACS category indices with no Bitcoin outreturned the one with 74.00% in it. The CF Settlement Category Index returned +9.76%, the same figure the Settlement slice posted inside the Free-Float index, which finished 0.52 percentage points higher on its 2.23% weight in Services and Sectors. The CF Sectors Category Index returned +22.81%, as Finance returned +36.92% on 33.10% of post-rebalance weight against +15.83% for Culture, while Dogecoin, at 48.50% of weight, was the largest contributor at +7.15%, with Uniswap adding +6.37% and Ethena +2.76%. The CF Services Category Index returned +50.75%, led by Quant, which contributed +18.37% on a 5.06% weight and out-contributed Chainlink, the index’s 49.87% holding, which contributed +13.65%. The same Services category added only +0.42% inside Free-Float on 0.82% of its weight, so the Classification Series index is where that return shows.
To read the full reports, please click on the respective links below:
CF Free-Float Broad Cap Index: Monthly Attribution [PDF]
CF Diversified Broad Cap Index: Monthly Attribution [PDF]
CF Ultra Cap 5 Index: Monthly Attribution [PDF]
CME CF Crypto Market Index: Monthly Attribution [PDF]
CME CF Emerging Crypto Index: Monthly Attribution [PDF]
CF Settlement Category Index: Monthly Attribution [PDF]
CF Services Category Index: Monthly Attribution [PDF]
CF Sectors Category Index: Monthly Attribution [PDF]
Our Monthly Attribution Reports are designed to help investors understand the performance of digital assets through a purpose-centric lens called the CF Digital Asset Classification Structure (CF DACS). To learn more about CF DACS, please use our interactive CF DACS Token Explorer.
The information contained within is for educational and informational purposes ONLY. It is not intended nor should it be considered an invitation or inducement to buy or sell any of the underlying instruments cited including but not limited to cryptoassets, financial instruments or any instruments that reference any index provided by CF Benchmarks Ltd. This communication is not intended to persuade or incite you to buy or sell security or securities noted within. Any commentary provided is the opinion of the author and should not be considered a personalised recommendation. Please contact your financial adviser or professional before making an investment decision.
Note: Some of the underlying instruments cited within this material may be restricted to certain customer categories in certain jurisdictions.
Small Cap Tokens Outperform in September
The CF Free-Float Broad Cap Index rose 10.28% in September as Bitcoin supplied 59% of the gain while trailing the index. Returns across the Capitalization Series ran from +7.74% for Ultra Cap 5 to +14.01% for Emerging Crypto, which holds no Bitcoin, as altcoins outpaced Bitcoin.

Mark Pilipczuk
CF Digital Asset Index Family Multi Asset Series – Extraordinary Rebalance Announcement
CF Digital Asset Index Family Multi Asset Series - Extraordinary Rebalance Announcement
CF Benchmarks
Changes to the Token Market Price Benchmarks Series - Market Prices – 06 October 2026
The Administrator has confirmed changes to the Token Market Price Family for the period 29 September 2026 to 06 October 2026
CF Benchmarks
By clicking Accept, you consent to CF Benchmarks's use of cookies.
Visit Cookie Settings to learn how CF Benchmarks uses cookies and to adjust your preferences.