
May 25, 2026
Weekly Index Highlights, May, 25, 2026
Market Performance Update
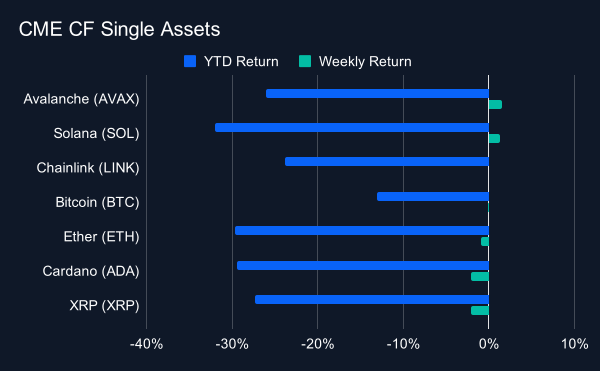
Digital asset performance was split sharply by size and beta over the May 18th to May 23rd stretch, with the seven-name CF Single Asset Series moving within a tight -2.1% to +1.5% week-on-week (w/w) band after the prior week's -9.3% to -3.5% drawdown. Avalanche (AVAX) led at +1.5% w/w, trimming its year-to-date (YTD) loss to -26.1%, with Solana (SOL) close behind at +1.3% (YTD -32.0%) and Chainlink (LINK) effectively flat at 0.0% (YTD -23.8%). Bitcoin (BTC) was marginally lower at -0.1% w/w, keeping its YTD print at -13.1% and the shallowest of the set. Ether (ETH) slipped 0.9% (YTD -29.6%), while Cardano (ADA) and XRP (XRP) tied for the laggard spot at -2.1% each, leaving ADA at -29.4% YTD and XRP at -27.4%. The weekly range between AVAX's +1.5% and XRP's -2.1% was therefore a 3.6 percentage point (pp) spread, less than half the 5.8 pp spread observed a week earlier. Given that the previous week was broadly negative, with every name down by between 3.5% and 9.3%, the most recently completed week stabilized the tape at the headline level without a meaningful retracement. The pattern shows higher-beta layer-one names recovering modestly while mega-cap and payments-oriented exposures drifted lower, leaving YTD losses still running from BTC's -13.1% to SOL's -32.0%, broadly unchanged versus the prior weekly print.
Volatility Analysis
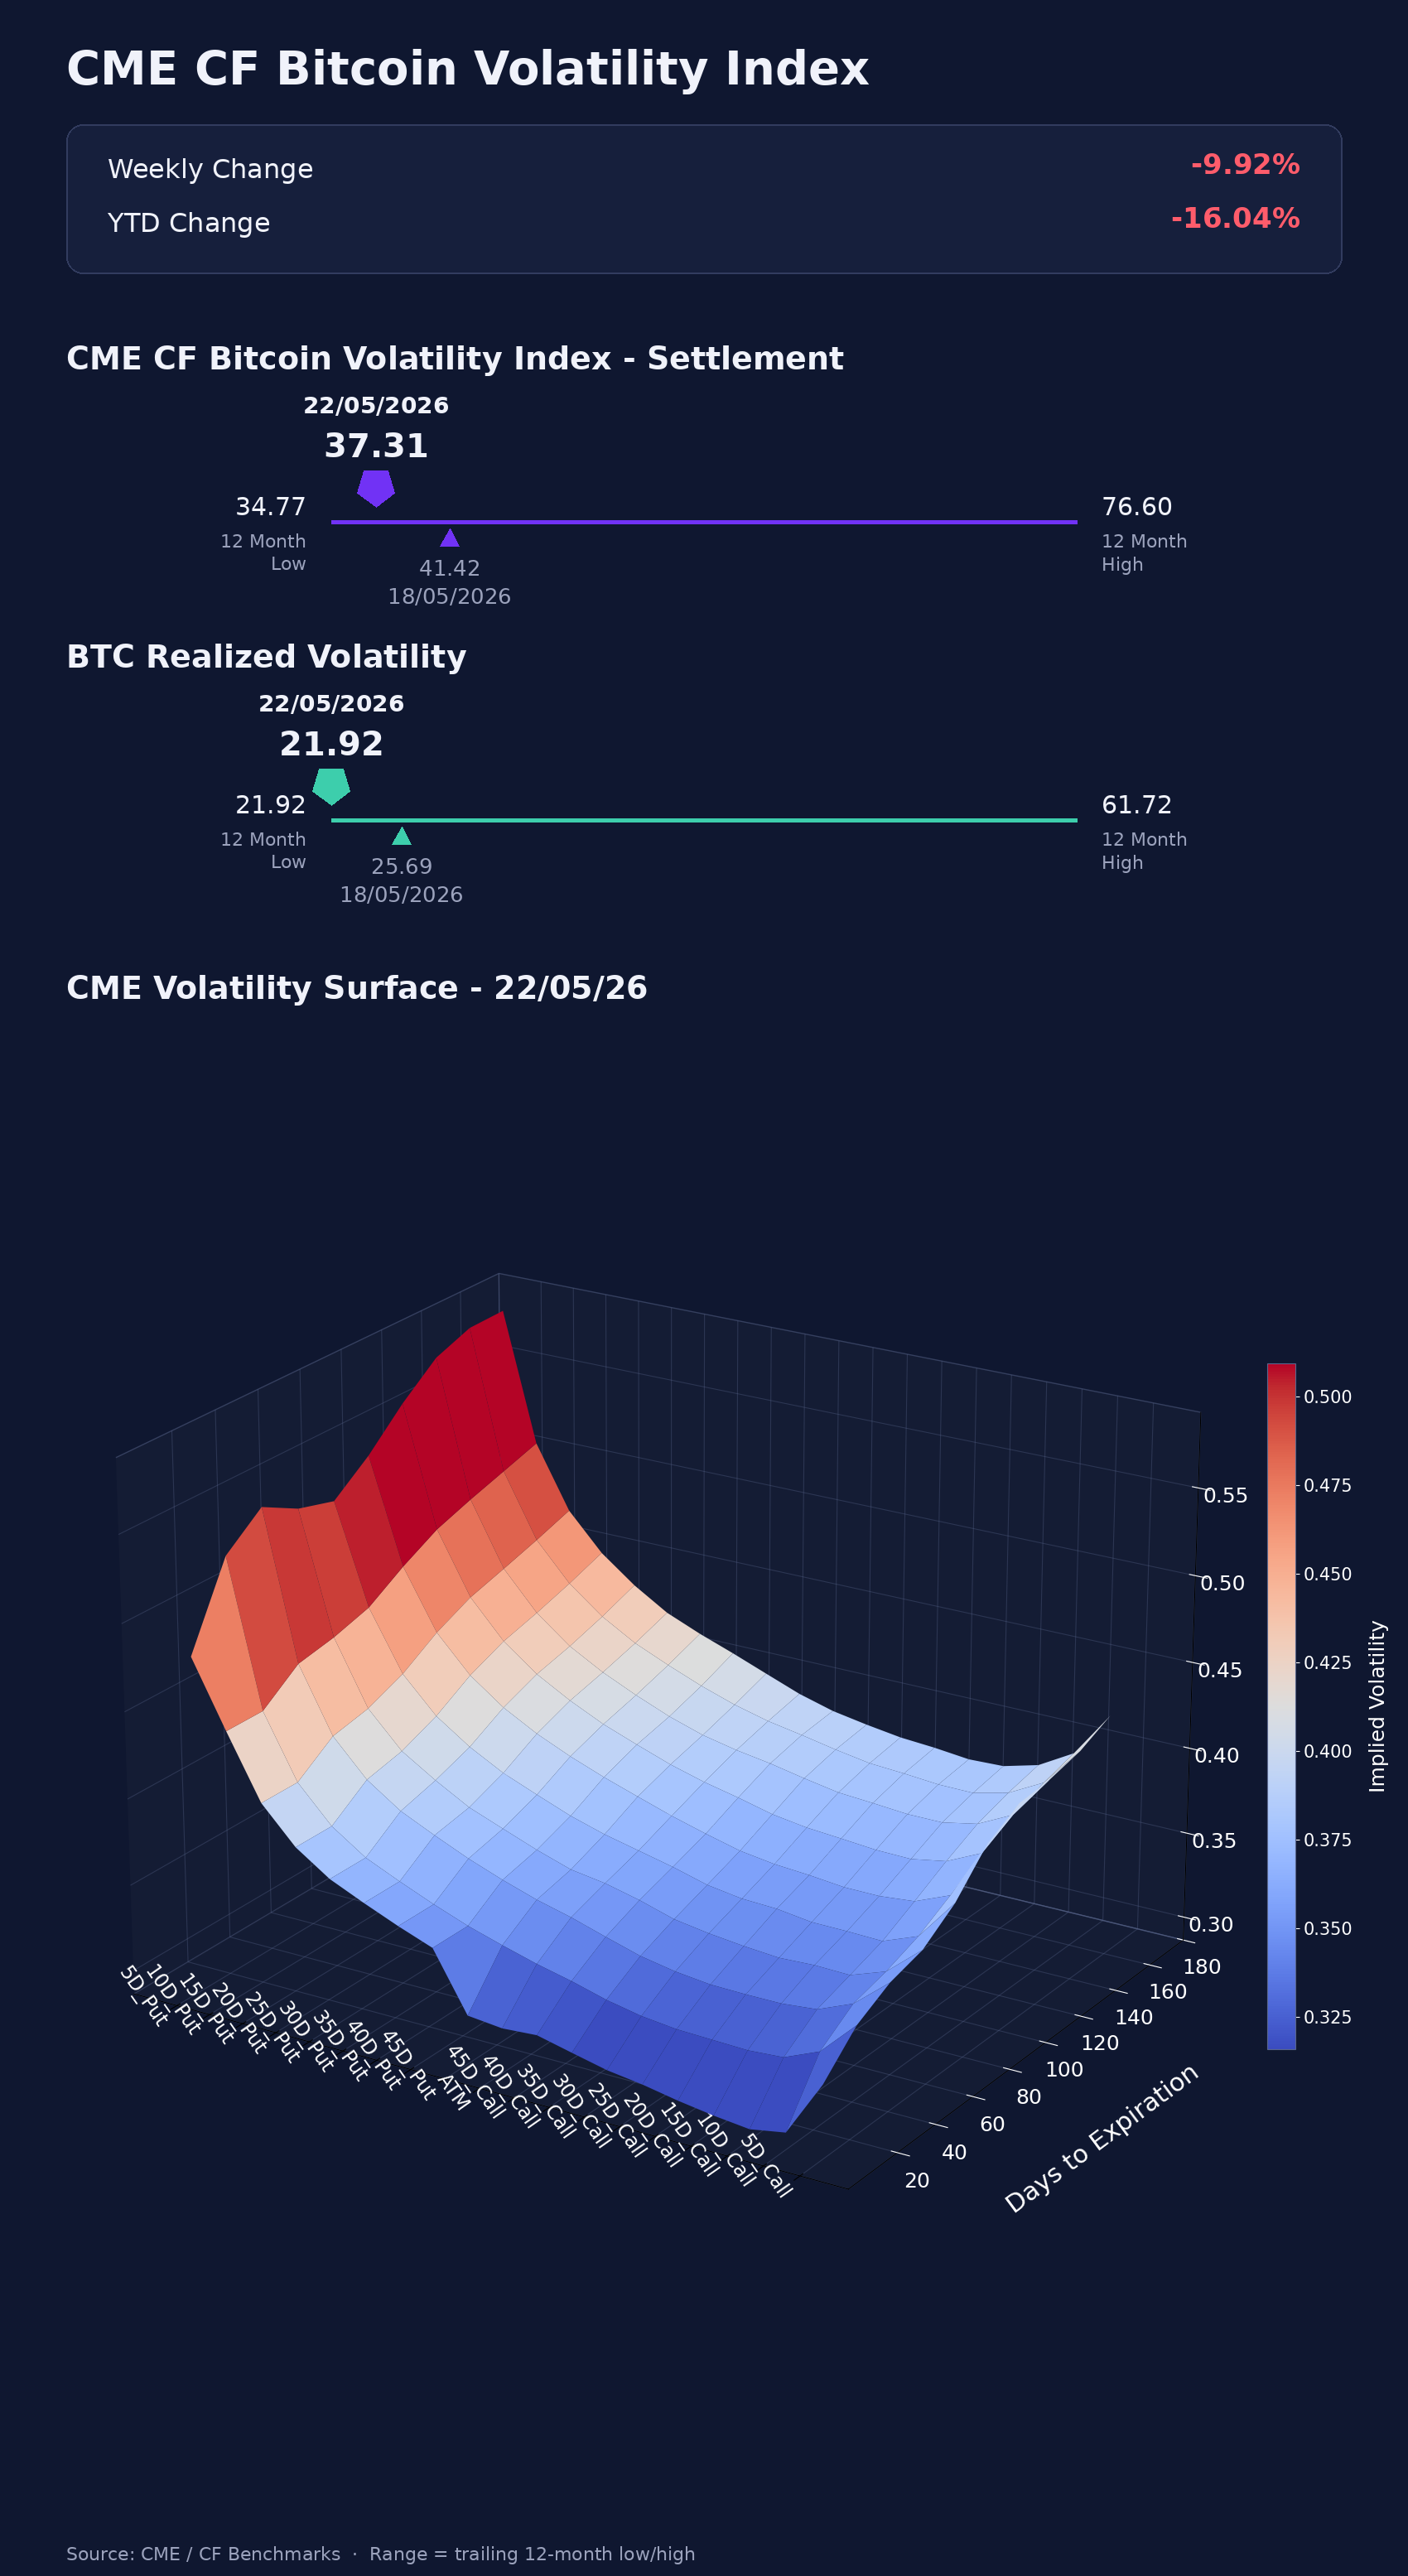
Bitcoin volatility cooled across both implied and realized terms over the May 18th to May 22nd business week, with the implied premium widening over realized as the spot tape stabilized. Our CME CF Bitcoin Volatility Index, Settlement (BVXS) moved from its close on Friday May 15th of 40.50, to 37.31 by the close on Friday May 22nd; within the current-week business window of May 18th to May 22nd, it fell from 41.42 to 37.31, a 9.92% decline. Realized volatility moved further, falling from 30.92 on May 15th to 21.92 on May 22nd, and from 25.69 to 21.92 across the current-week observation. That left implied volatility 15.39 vol. points above realized volatility at the May 22nd close, compared with 9.58 vol. points a week earlier. The move therefore reflects realized volatility compressing faster than implied: options markets repriced forward volatility lower, while backward-looking realized volatility fell 9.00 vol. points over the week. Relative to the 12-month range, BVXS now sits 2.54 vol. points above its 34.77 low, while realized volatility matched its 12-month low of 21.92. With BVXS down 16.04% YTD against a start-of-year reference of 44.44, the surface can be read as a continued bleed in spot risk premia, even as the implied-to-realized gap widened on faster realized compression.
Market Cap Index Performance
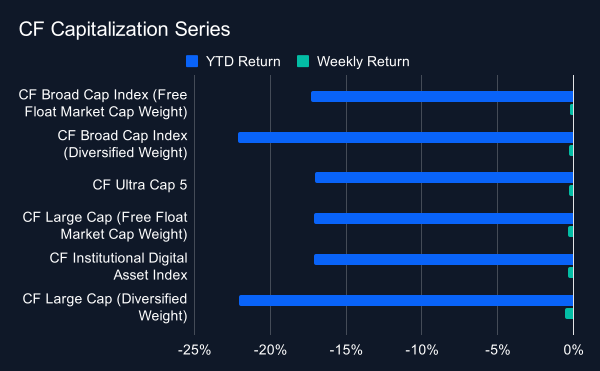
Capitalization indices were uniformly weaker over the week but clustered in a narrow band, with weekly returns ranging from -0.24% to -0.58%. The CF Broad Cap Index (Free Float Market Cap Weight) led at -0.24% w/w, leaving it at -17.3% YTD, while the CF Broad Cap Index (Diversified Weight) declined 0.29% (YTD -22.2%). CF Ultra Cap 5 fell 0.32% (YTD -17.1%), with the CF Large Cap (Free Float Market Cap Weight) and CF Institutional Digital Asset Index both at approximately -0.33% (YTD -17.1% each). The CF Large Cap (Diversified Weight) was the weakest at -0.58% (YTD -22.1%). The 0.04 pp gap between the broad diversified index and the large-cap free-float gauge was effectively zero at the headline level, while the 0.29 pp lead of Broad Cap Diversified over Large Cap Diversified points to constructive breadth beneath the mega-cap layer. Diversified-weighted exposure also remained roughly 5.0 pp behind the equivalent free-float YTD measure, indicating that the longer-running drag from broader-market exposure remained intact even as weekly breadth turned modestly favorable.
Factor Analysis
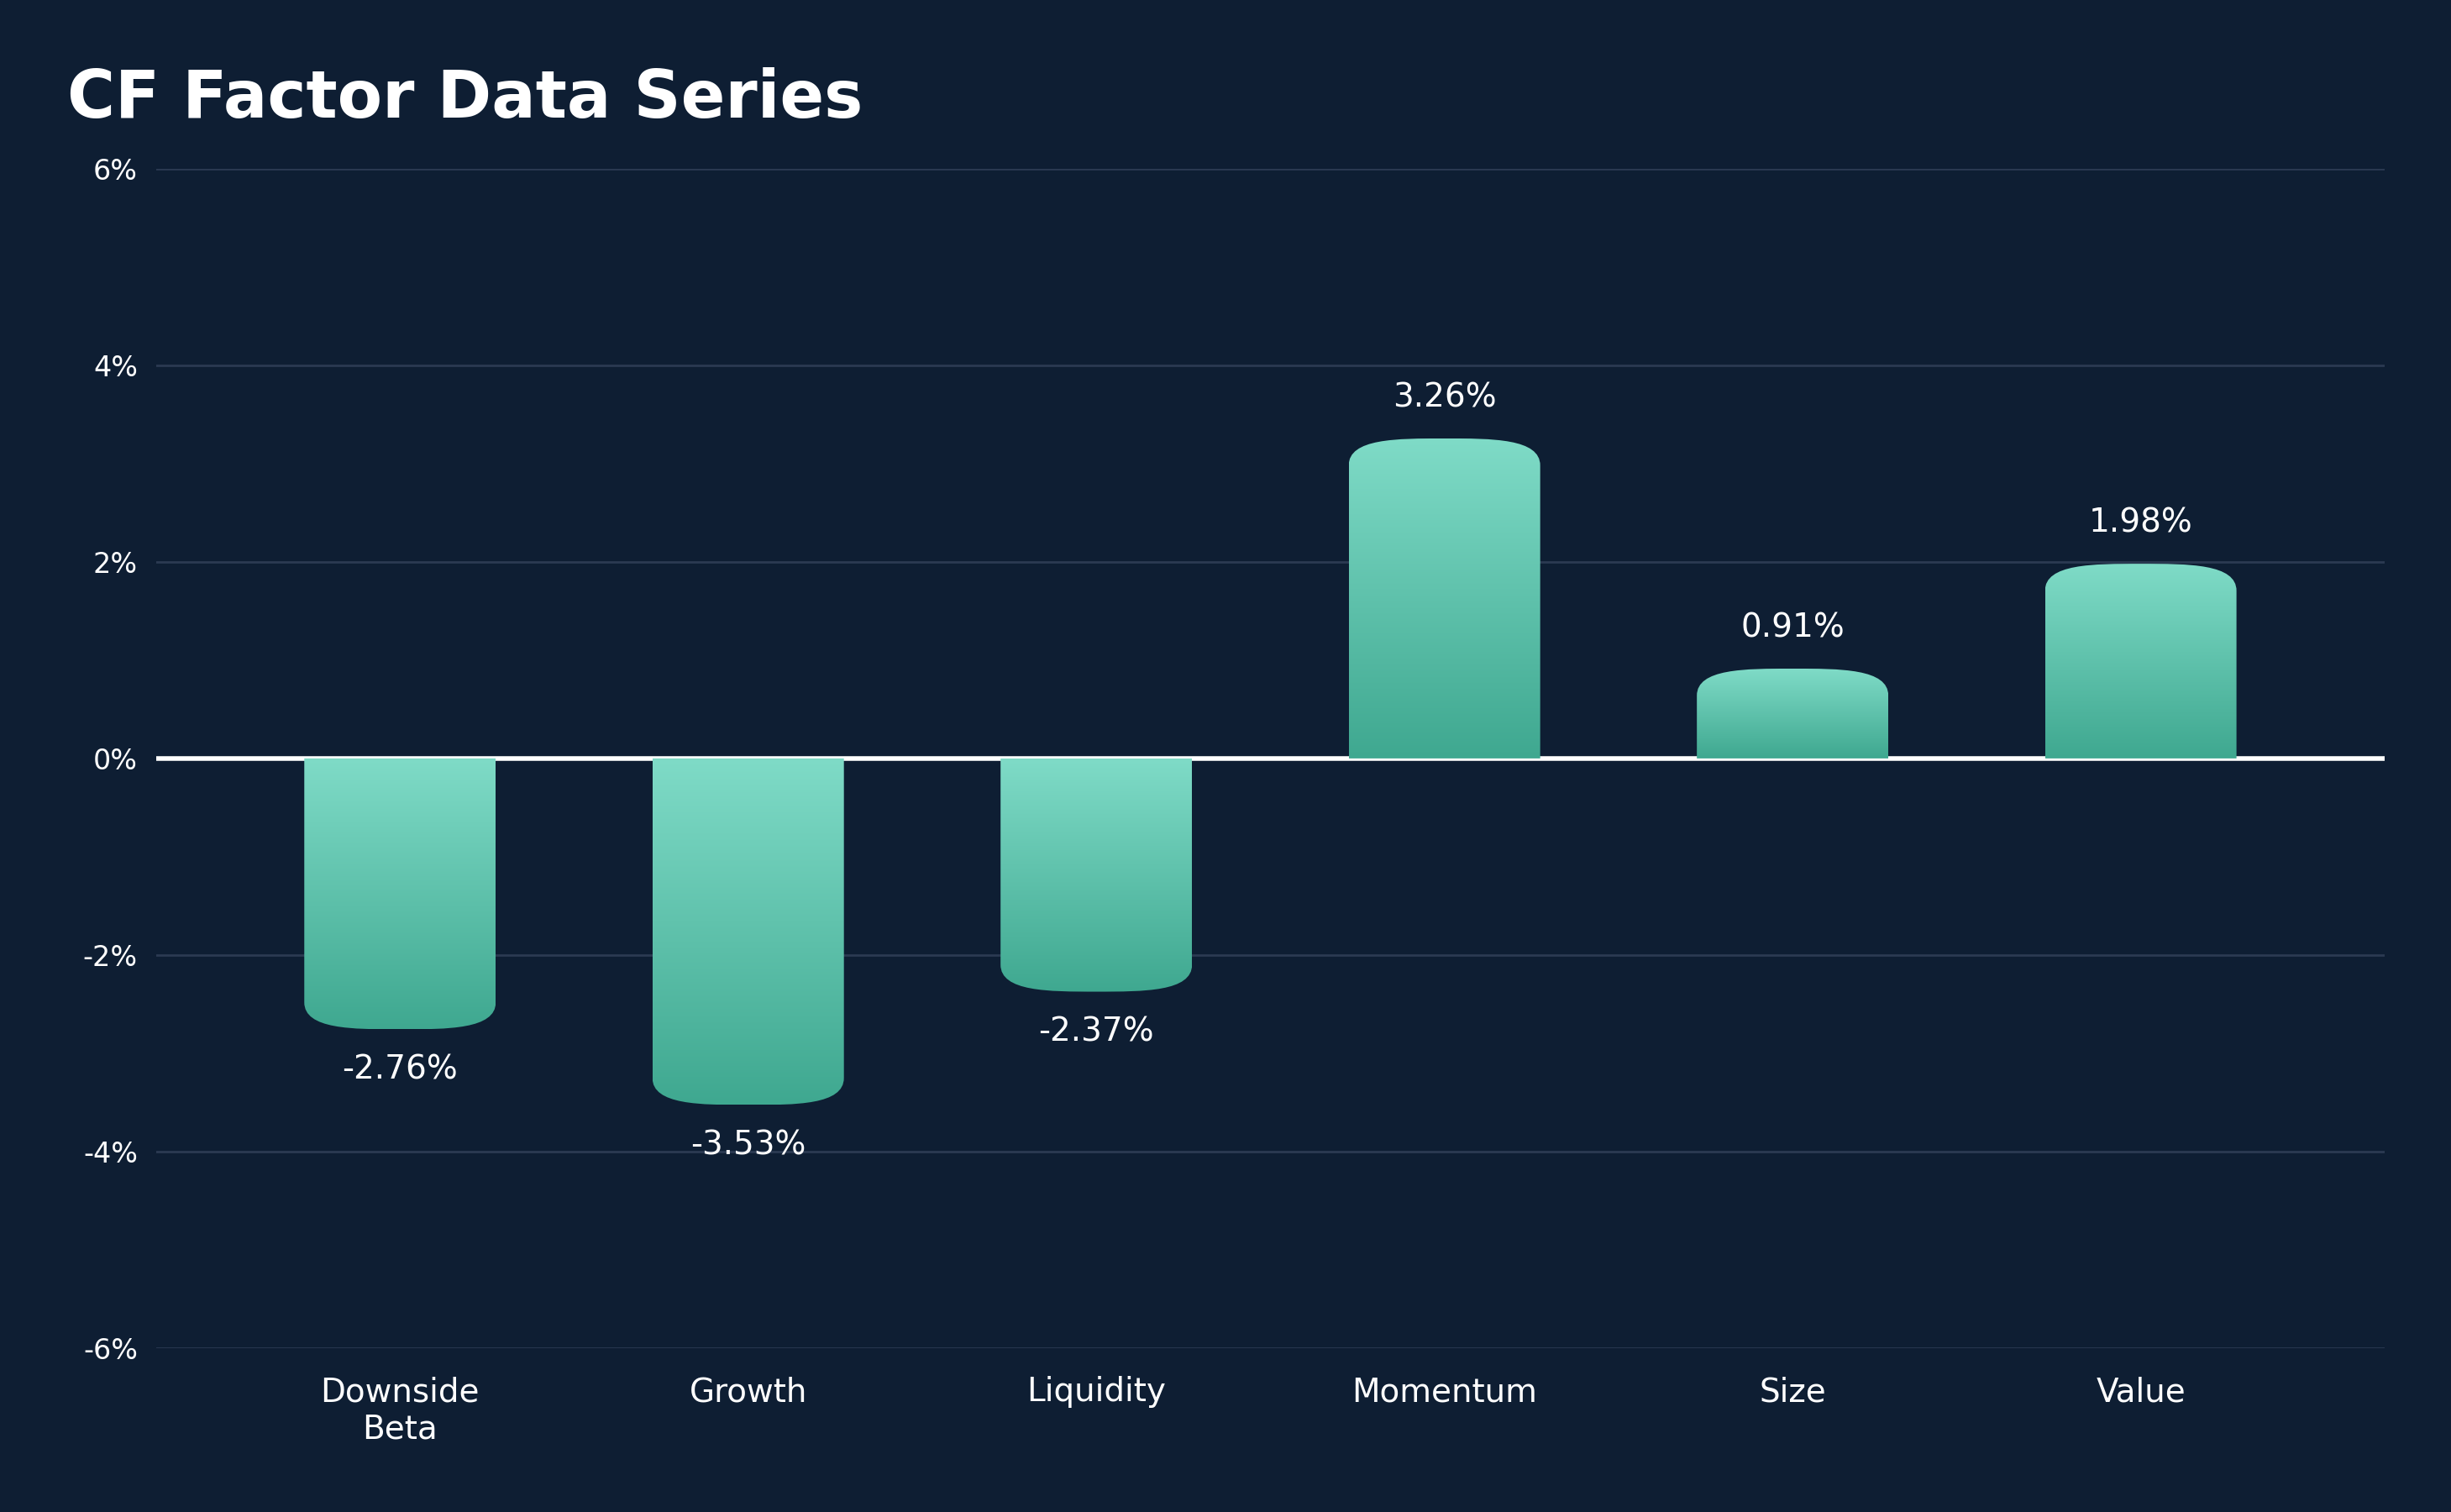
Factor returns rotated decisively across styles after the prior week's defensive lead. Momentum printed at 3.3% on Friday May 22nd after -2.7% on May 16th, a 6.0 pp swing into the top spot. Value also reversed, moving from -1.9% to +2.0%, while Size shifted from -2.4% to +0.9%. The weaker side of the factor set was dominated by Growth, Downside Beta and Liquidity: Growth moved from +0.3% to -3.5%, Downside Beta from +3.8% to -2.8%, and Liquidity from +1.2% to -2.4%. Weekly factor returns therefore ranged from Growth's -3.5% to Momentum's 3.3%, a 6.8 pp spread. All told, the readings point to investors paying for Momentum and Value while cutting Downside Beta and Liquidity, a near-exact mirror of the prior week's preference set. The 6.6 pp Downside Beta reversal was the largest absolute switch in the factor set, with the 6.0 pp Momentum reversal close behind, anchoring the style rotation as the dominant theme of the week.
Read our latest weekly crypto factors report: Factor Friday - May 22, 2026
Classification Series Analysis
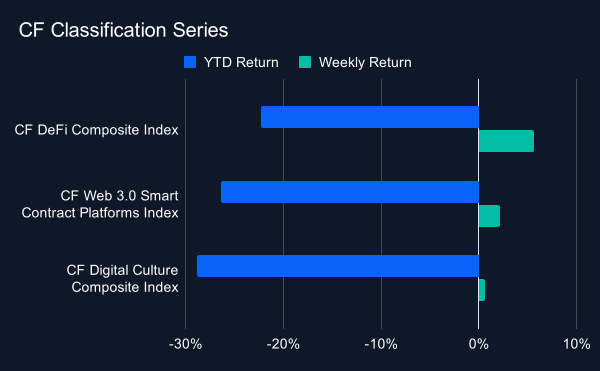
Across the CF Classification Series, thematic exposure moved into positive territory, with returns of 0.7% to 5.6% after the prior week's -10.9% to -8.7% drawdown. The CF DeFi Composite Index led at +5.6% w/w (YTD -22.3%), followed by the CF Web 3.0 Smart Contract Platforms Index at +2.2% (YTD -26.4%) and the CF Digital Culture Composite Index at +0.7% (YTD -28.9%). DeFi outperformed Web 3.0 platforms by 3.5 pp and Culture by 4.9 pp on the week, with Web 3.0 sitting 1.5 pp ahead of Culture. The current-week range of 4.9 pp was substantially wider than the prior week's 2.2 pp band, driven by DeFi's outperformance, and sat well clear of BTC's -0.1% w/w move, a 5.8 pp spread between DeFi and the mega-cap anchor. YTD drawdowns from -22.3% to -28.9% show that the recovery remained incomplete across all three composites, though DeFi's relative lead has reduced its YTD loss to the shallowest of the group.
Sector Analysis
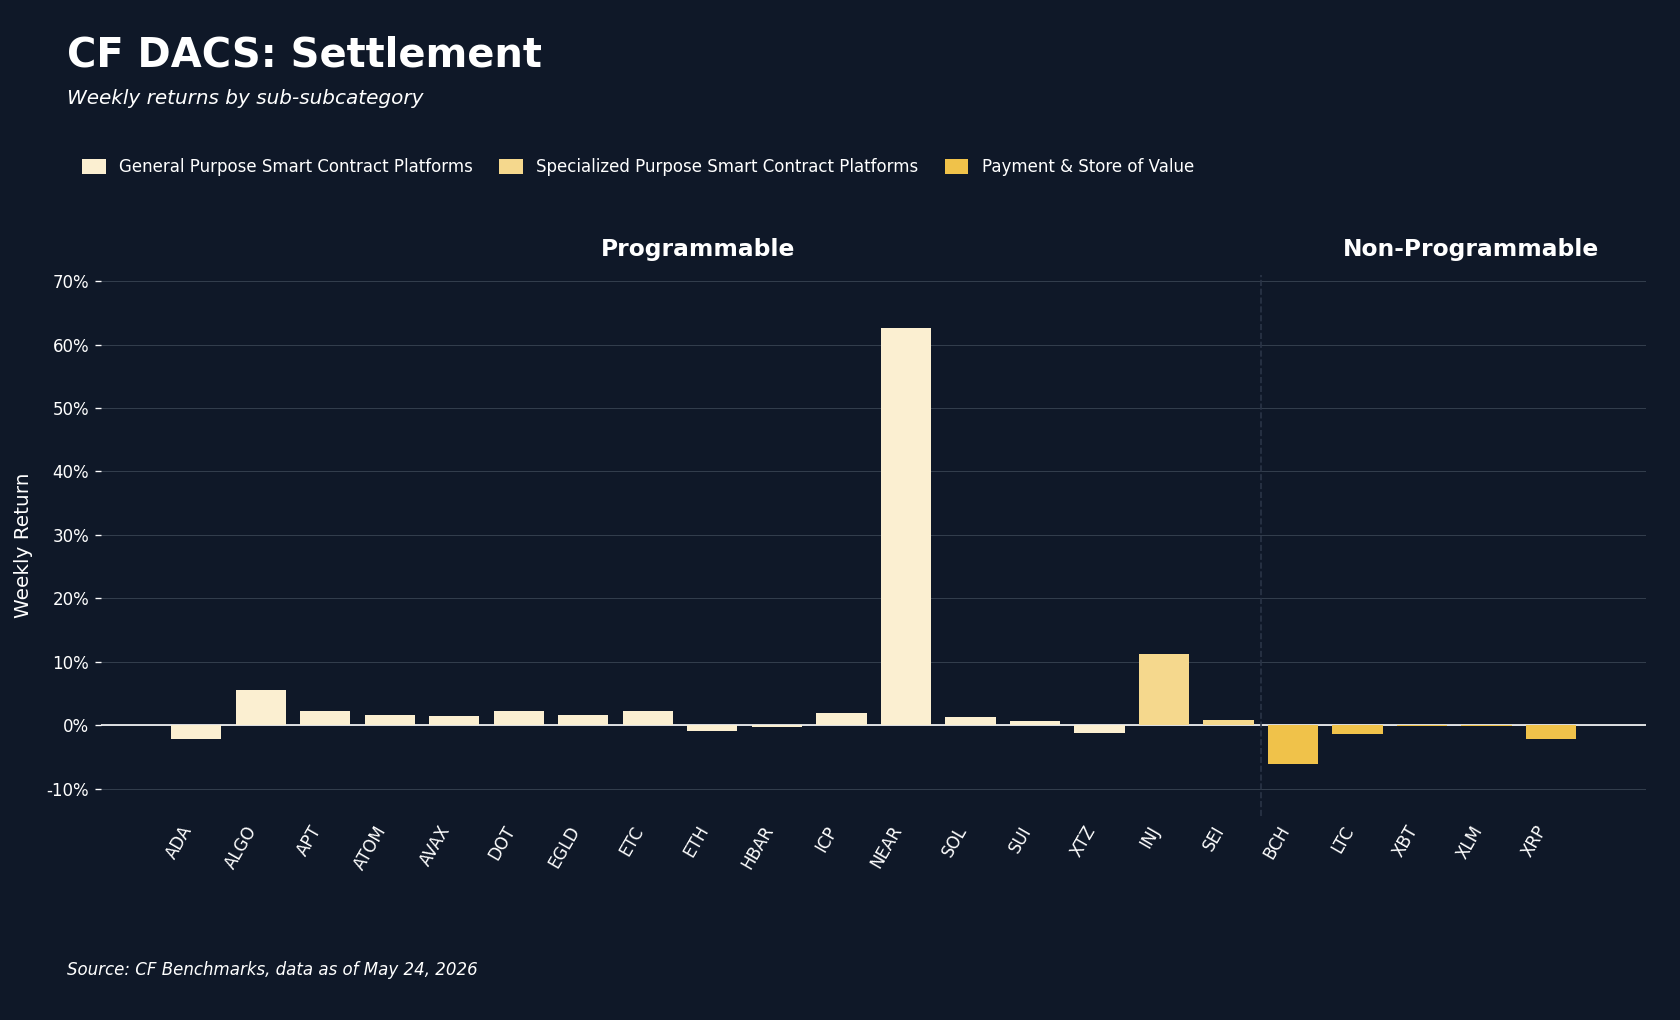
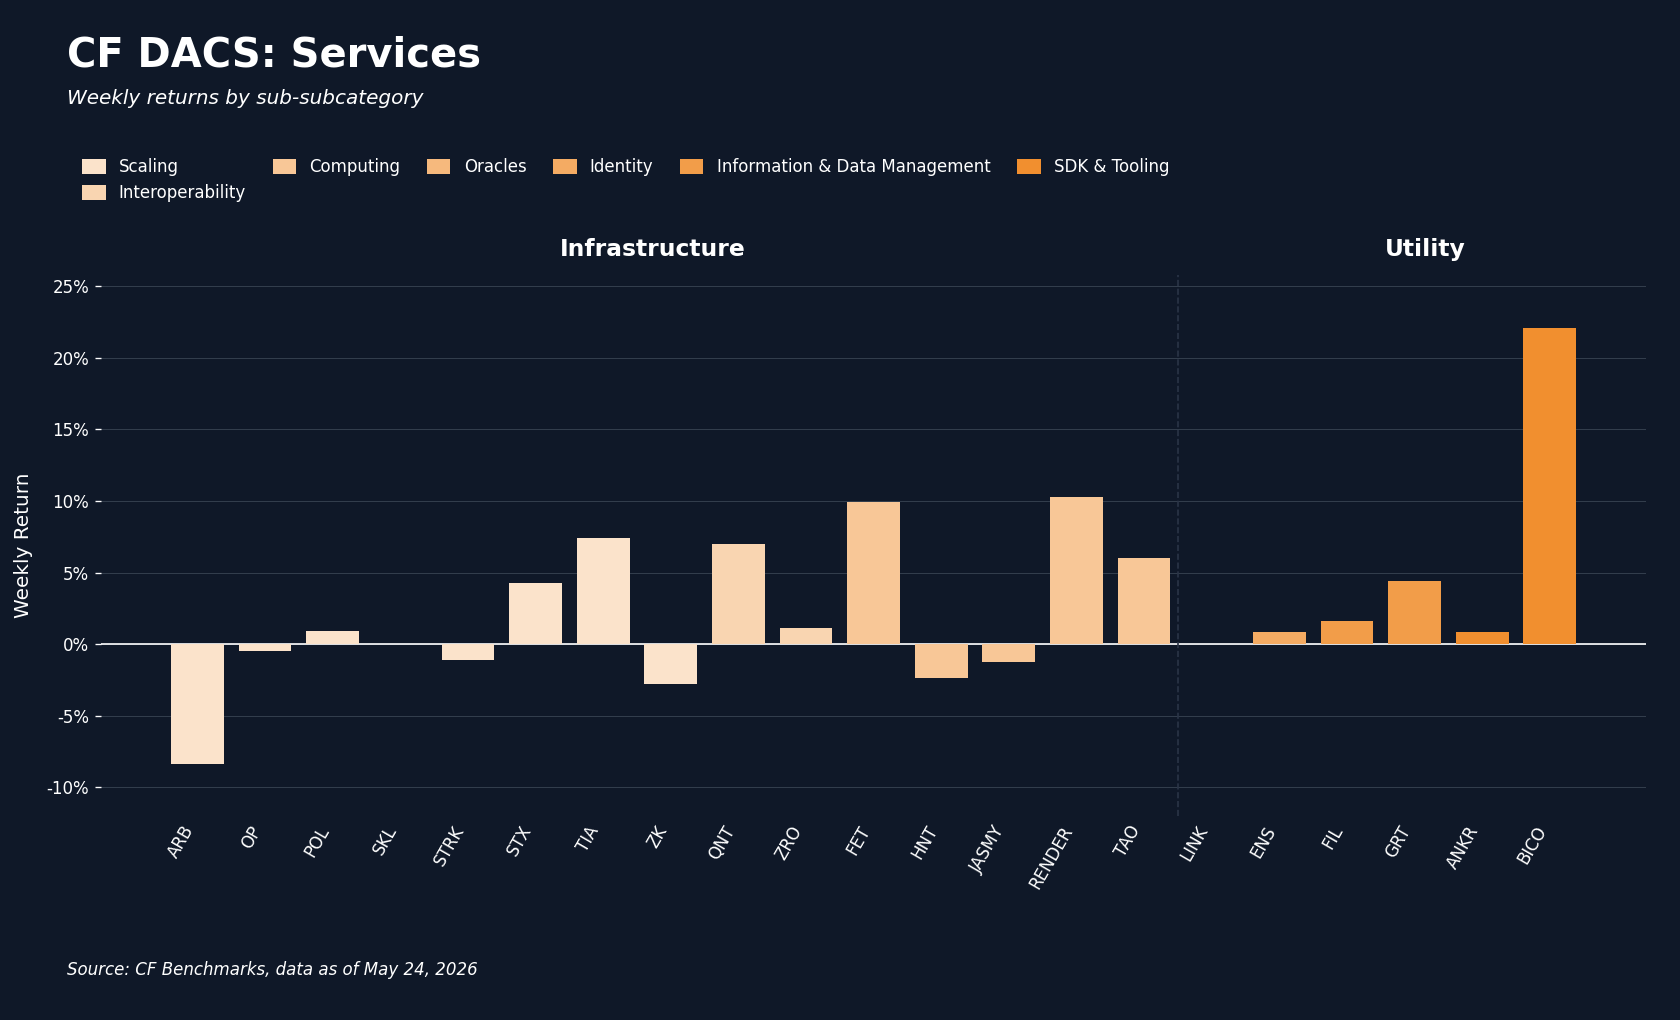
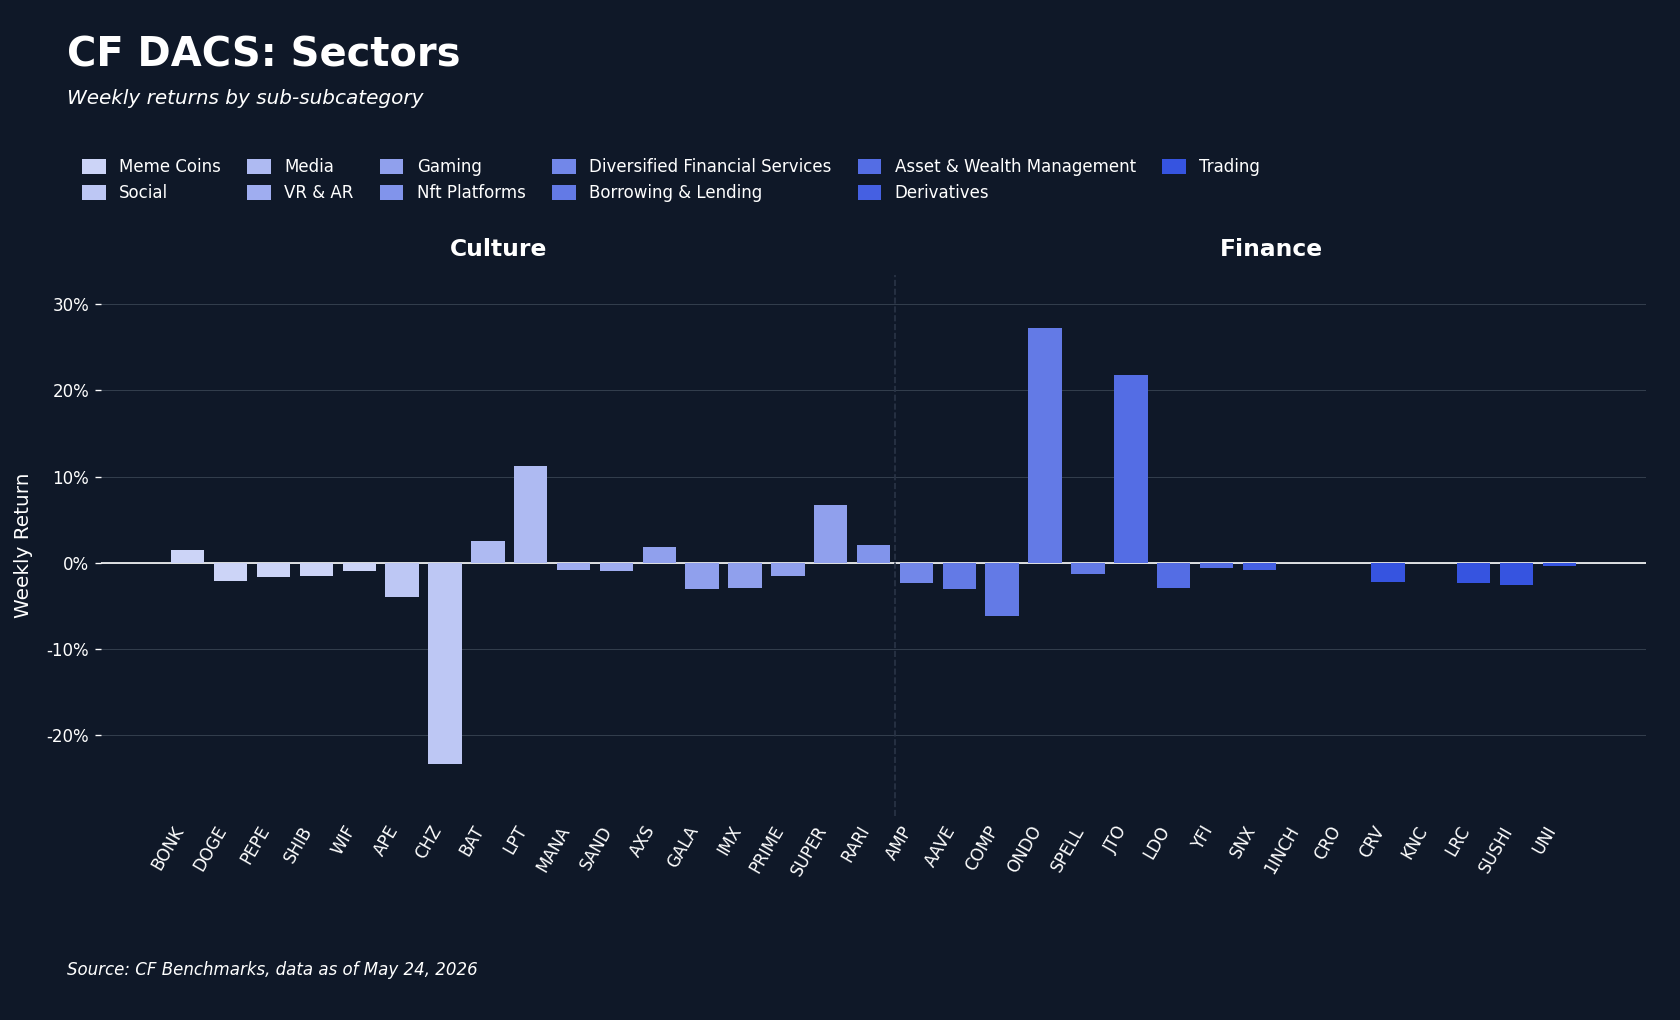
Sector performance across our CF Digital Asset Classification Structure (CF DACS) taxonomy was positive on average but bifurcated beneath the surface, with sector averages spanning -2.0% to +5.4% w/w. The Programmable Sub-Category led at +5.4% on average, anchored by NEAR at +62.7%, INJ at +11.2% and ALGO at +5.6%, although ETH (-0.9%), XTZ (-1.2%) and ADA (-2.1%) sat among the laggards within the same complex. Utility followed at +5.0%, helped by BICO at +22.1% and GRT at +4.4%, with LINK essentially unchanged. Infrastructure averaged +2.0%, with RENDER (+10.3%), FET (+9.9%) and TIA (+7.4%) carrying the leadership, against ARB (-8.4%) and ZK (-2.8%) as the largest drags. Finance averaged +1.5%, with ONDO (+27.3%) and JTO (+21.8%) providing most of the lift, while COMP (-6.2%) and AAVE (-3.0%) weighed. Culture averaged -1.0%, with LPT (+11.2%) and SUPER (+6.7%) offset by CHZ at -23.3%, APE at -3.9% and GALA at -3.0%. Non-Programmable was the laggard at -2.0% on average, with BCH at -6.1% and XRP at -2.1% the largest contributors to the drag. The 7.34 pp Programmable-versus-Non-Programmable spread shows that higher-beta smart contract platforms carried the week, while the Non-Programmable Payment and Store of Value constituents lagged. Across individual DACS constituents, returns ran from NEAR at +62.7% to CHZ at -23.3%, an 85.95 pp token-level spread that captures the depth of dispersion beneath the index-level averages.
CF Staking Series
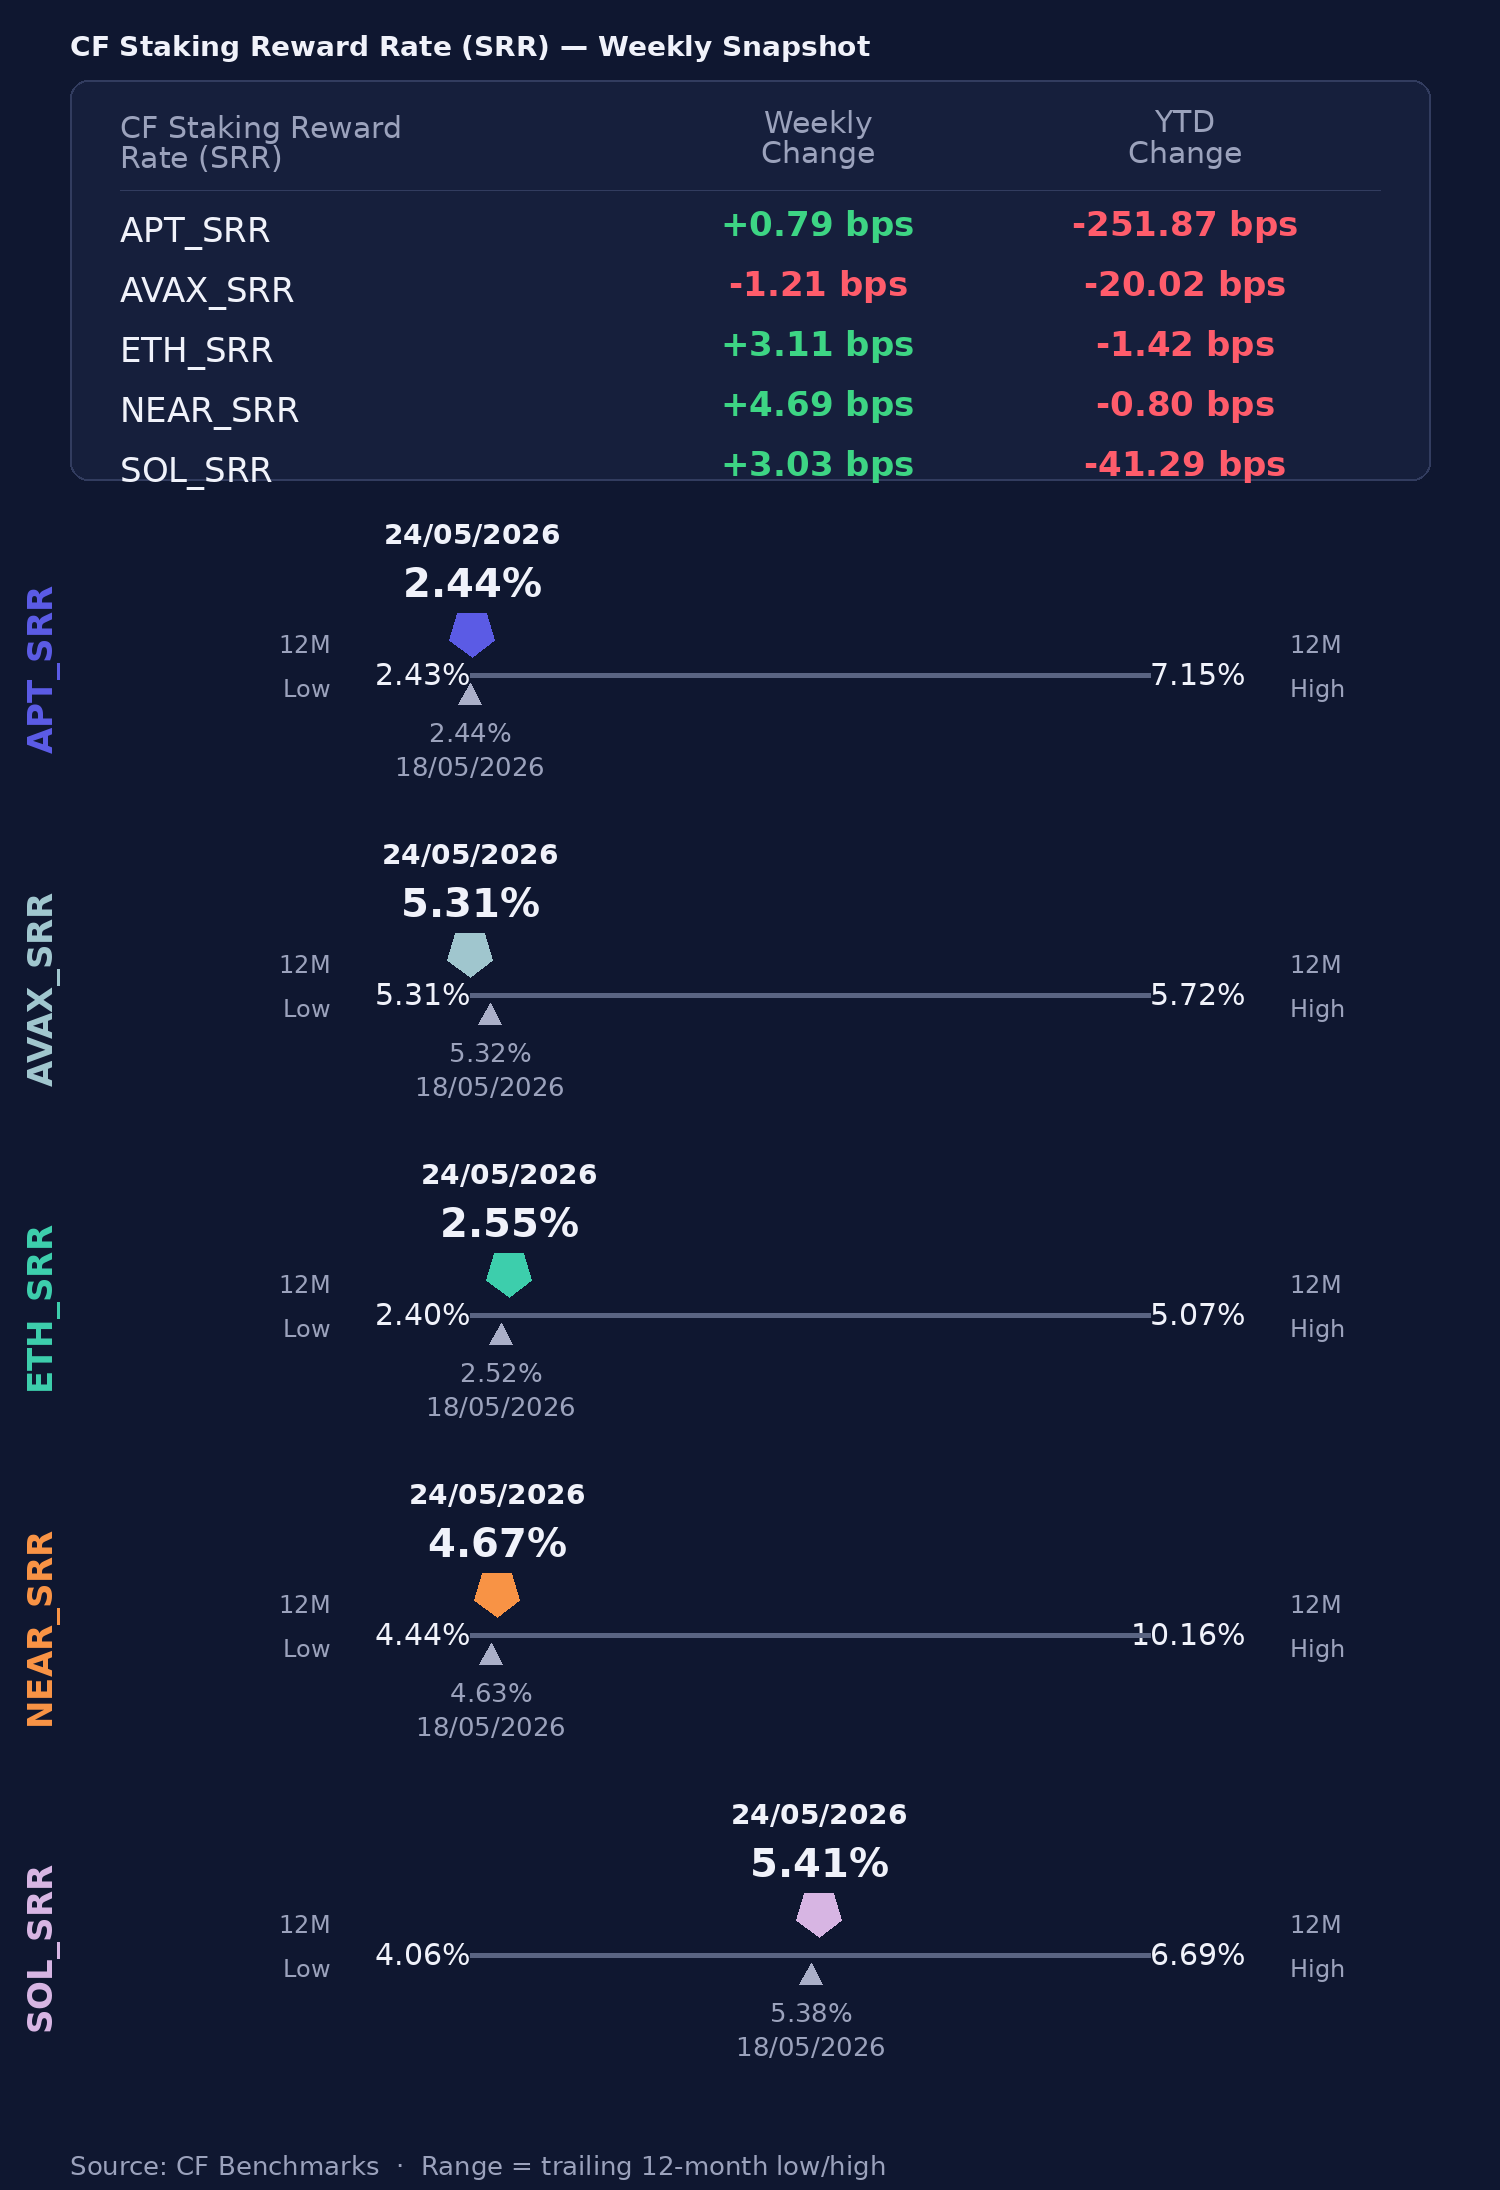
Within the CF Staking Series, weekly index relative change ran from -0.2% to +1.2%. APT Staking returned +0.3% over the measurement period. Between May 17th and May 23rd, its reward rate moved from 2.4362% to 2.4442%, a +0.8 bps change. AVAX Staking posted a relative change of -0.2%. Over the same Day 1 to Day 7 window, its reward rate moved from 5.3294% to 5.3123%, a -1.7 bps change. ETH Staking led the set at +1.2%, even as its reward rate fell from 2.5904% to 2.5543%, a -3.6 bps move. NEAR Staking posted a +1.0% change, with its reward rate moving from 4.6665% to 4.6738%, or +0.7 bps. SOL Staking added +0.6%, with its reward rate rising from 5.3867% to 5.4117% between the current edition and the prior one, a +2.5 bps change. Reward-rate changes therefore spanned -3.6 bps to +2.5 bps, with ETH providing the lower bound and SOL the upper. The 1.4 pp gap between ETH's +1.2% and AVAX's -0.2% defined the cross-sectional range, while the tight reward-rate band suggests staking economics held steady against a backdrop of broadly constructive spot performance among most of the underlying tokens.
Interest Rate Analysis
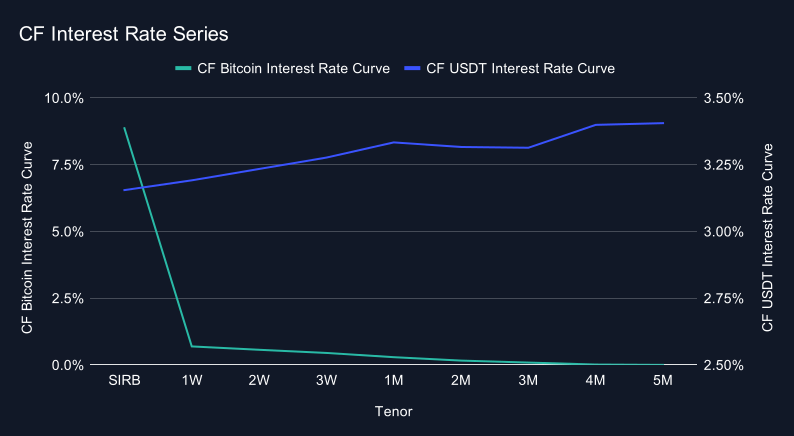
Funding conditions ended the most recent week with a sharp Bitcoin Session Interest Rate (SIRB) reset lower alongside a broadly easier USDT curve. BTC SIRB moved from 14.30% to 8.86%, a -543.4 bps decrease, while the BTC 1W tenor moved from 0.73% to 0.69%, or -3.6 bps. The rest of the BTC curve was mixed: 2W rose 17.7 bps and 3W rose 9.9 bps, while 1M fell 4.2 bps, 2M fell 17.6 bps and 3M fell 18.4 bps. The USDT curve was more uniform. USDT SIRB moved from 3.37% to 3.15%, a -21.7 bps change, with 1W and 3M lower by 20.7 bps and 17.0 bps respectively, and every other USDT tenor lower by between 14.7 bps and 19.5 bps. Note that the accompanying chart shows the current term-structure levels, with USDT sloping modestly upward from SIRB at 3.15% to the 5M tenor at 3.41%, and BTC decaying from SIRB at 8.86% to near-zero at the back end, while the discussion above describes week-on-week changes along each curve. Across both curves, tenor changes ranged from -543.4 bps to +17.7 bps. The configuration shows BTC's overnight benchmark unwinding a meaningful share of the prior week's reset, while USDT funding eased broadly between roughly 15 and 22 bps. That left the BTC front end the more idiosyncratic of the two curves, with the back end softening even as the very short maturities firmed.
The information contained within is for educational and informational purposes ONLY. It is not intended nor should it be considered an invitation or inducement to buy or sell any of the underlying instruments cited including but not limited to cryptoassets, financial instruments or any instruments that reference any index provided by CF Benchmarks Ltd. This communication is not intended to persuade or incite you to buy or sell security or securities noted within. Any commentary provided is the opinion of the author and should not be considered a personalised recommendation. Please contact your financial adviser or professional before making an investment decision.
Note: Some of the underlying instruments cited within this material may be restricted to certain customer categories in certain jurisdictions.
Small Cap Tokens Outperform in September
The CF Free-Float Broad Cap Index rose 10.28% in September as Bitcoin supplied 59% of the gain while trailing the index. Returns across the Capitalization Series ran from +7.74% for Ultra Cap 5 to +14.01% for Emerging Crypto, which holds no Bitcoin, as altcoins outpaced Bitcoin.

Mark Pilipczuk
CF Digital Asset Index Family Multi Asset Series – Extraordinary Rebalance Announcement
CF Digital Asset Index Family Multi Asset Series - Extraordinary Rebalance Announcement
CF Benchmarks
Changes to the Token Market Price Benchmarks Series - Market Prices – 06 October 2026
The Administrator has confirmed changes to the Token Market Price Family for the period 29 September 2026 to 06 October 2026
CF Benchmarks
By clicking Accept, you consent to CF Benchmarks's use of cookies.
Visit Cookie Settings to learn how CF Benchmarks uses cookies and to adjust your preferences.