
Aug 10, 2026
Bitcoin Climbs as Volatility Nears a 52-Week Low
Weekly Index Highlights, August 10, 2026
Digital assets rose as the week's rates debate moved from a hawkish setup toward a softer labor signal. July ISM Manufacturing opened stronger than expected and Thursday's Fedspeak left a September rate hike roughly 55% priced, but Friday's employment report changed the balance: nonfarm payrolls fell 23k against consensus near 80k, May and June were revised down a combined 103k, and average hourly earnings rose 0.1% month on month against 0.3% expected. Hike odds fell to 40% by the close, the 2-year Treasury yield ended 8.7 bps lower at 4.203% and the dollar index eased 0.37% to 99.56; Bitcoin (BTC) gained 2.59% week-on-week (w/w) and every CF Capitalization Series index rose inside a 0.60 percentage point (pp) band. ETF flows reinforced that broad response, though BlackRock's IBIT absorbed roughly 81% of the 853.5m dollars in spot Bitcoin exchange-traded fund creations.
Market Performance Update
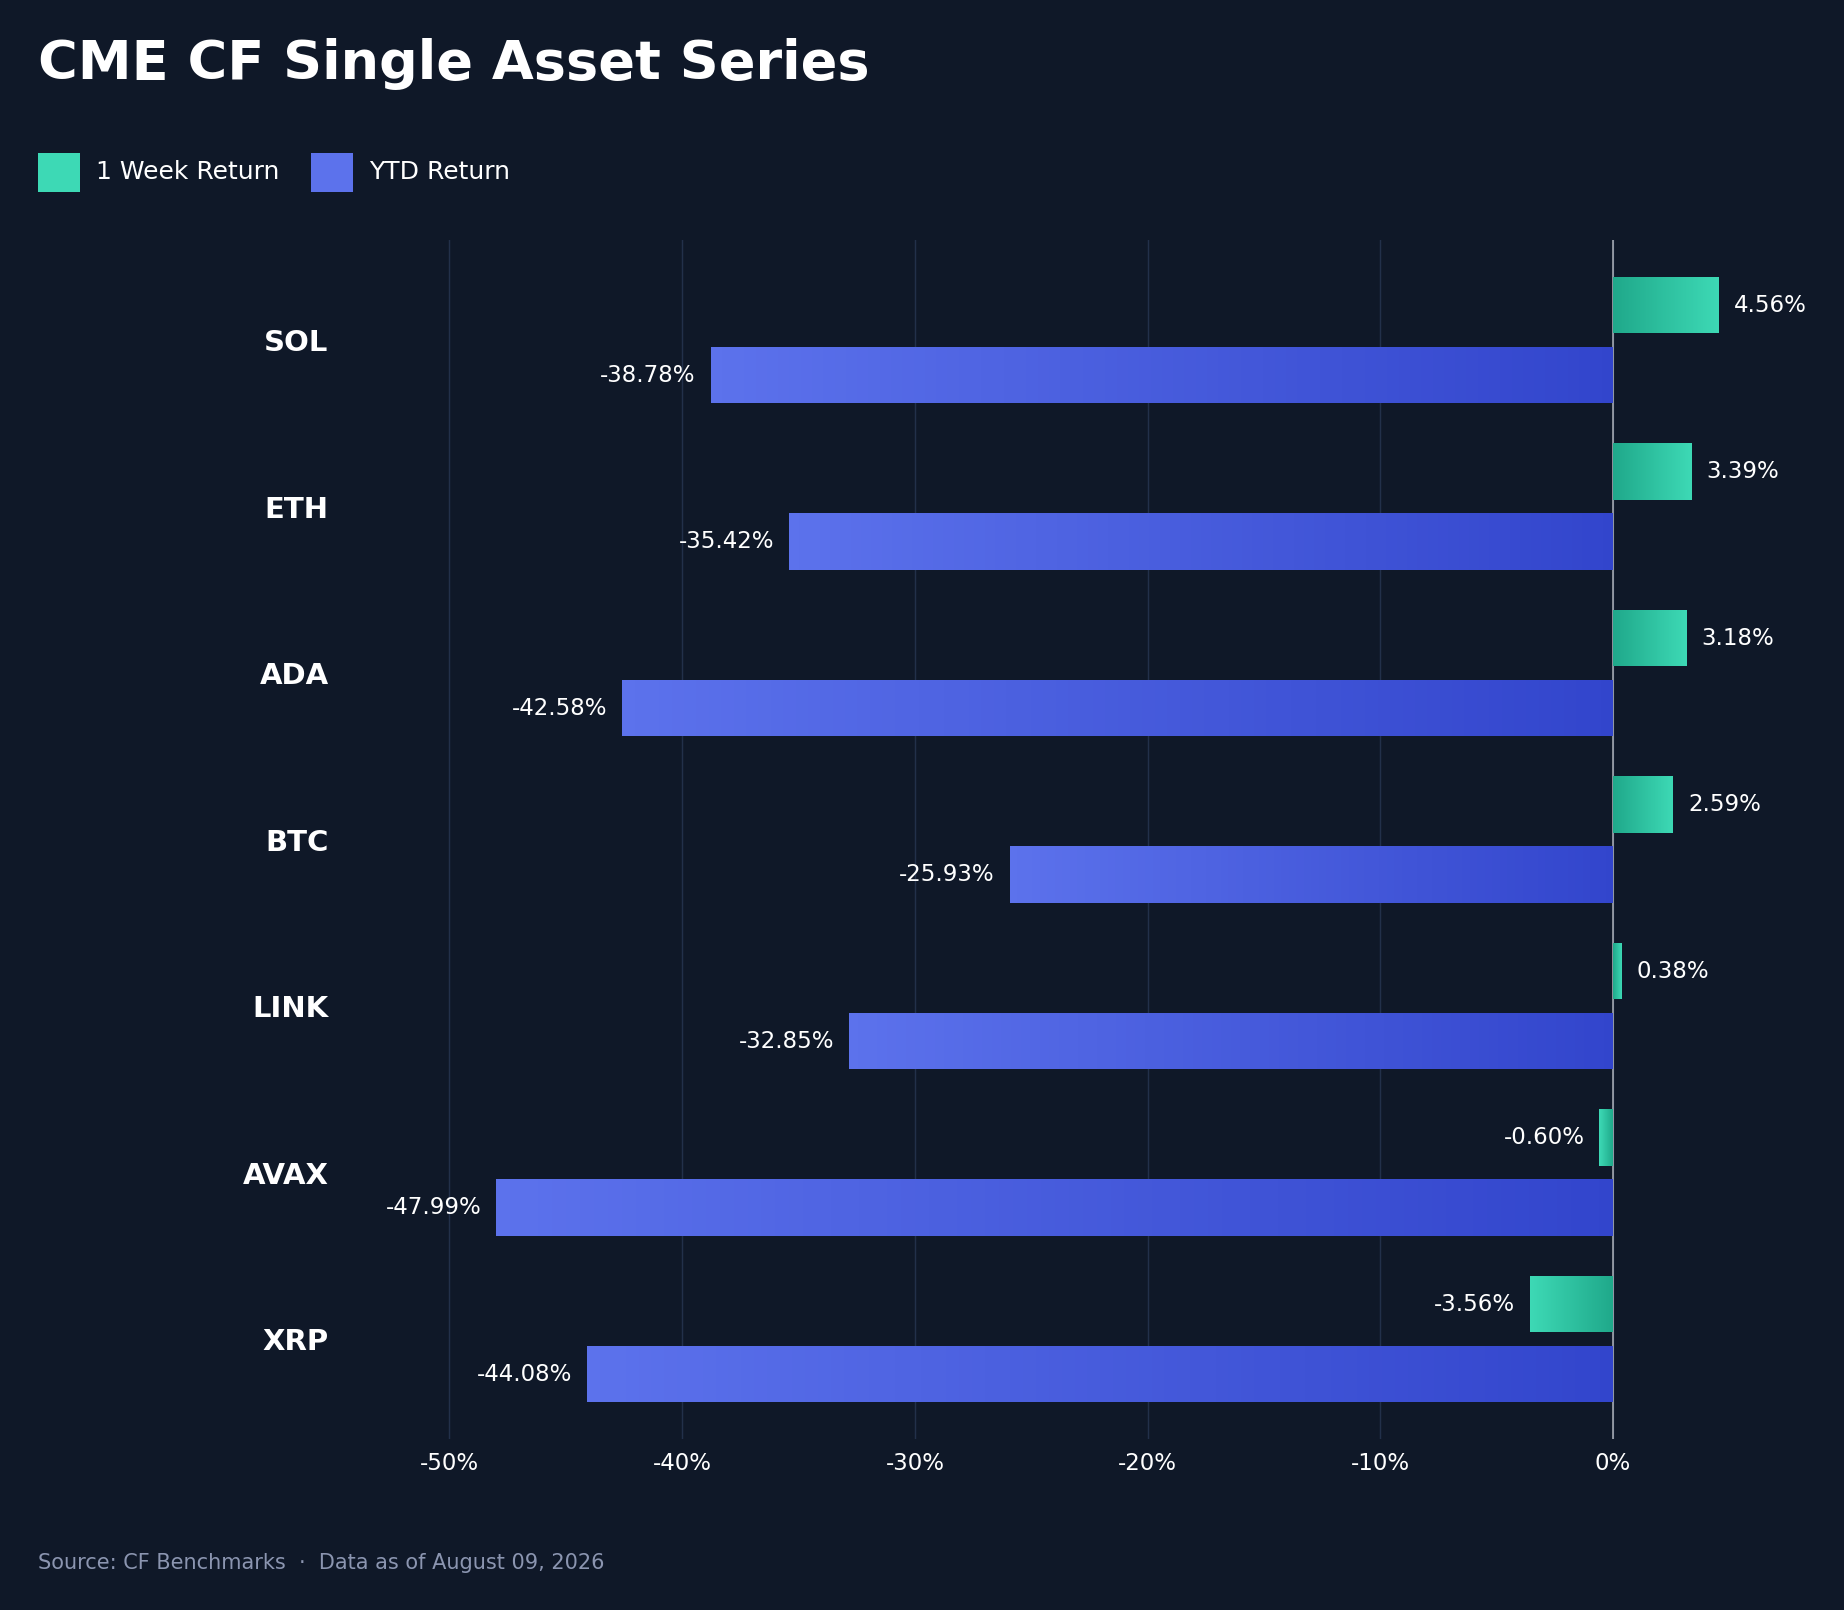
The CF Single Asset Series turned broadly positive, with five of seven names higher against one of seven a week earlier. Solana (SOL) led at 4.56%, followed by Ether (ETH) at 3.39%, Cardano (ADA) at 3.18% and Bitcoin (BTC) at 2.59%; Chainlink (LINK) added 0.38%, while Avalanche (AVAX) slipped 0.60% and XRP fell 3.56%. That 8.12 pp spread between SOL and XRP is a little over a third of the 21.71 pp range of the prior week, so the tape both rose and tightened. July nonfarm payrolls fell 23k on Friday August 7th against a consensus near 80k, the first monthly decline since February, and average hourly earnings rose 0.1% month over month against 0.3% expected; September rate-hike odds fell from 55% to 40% into the close, and the 2-year Treasury yield ended the week 8.7 bps lower. Bitcoin gained 0.74% at Friday's fix, but the payrolls print did not create the week's move and Friday was not even its largest session: Wednesday August 5th added 0.82%, and BTC gained at all six daily fixes inside the week. That path tracks the five consecutive spot Bitcoin exchange-traded fund creation sessions (853.5m dollars on the week) more closely than it tracks any single print. XRP is the name that refused the tape, falling at five of those six fixes, and no in-week catalyst in our ledger accounts for it; year-to-date (YTD) it sits at -44.08%, against -25.93% for BTC.
Volatility Analysis
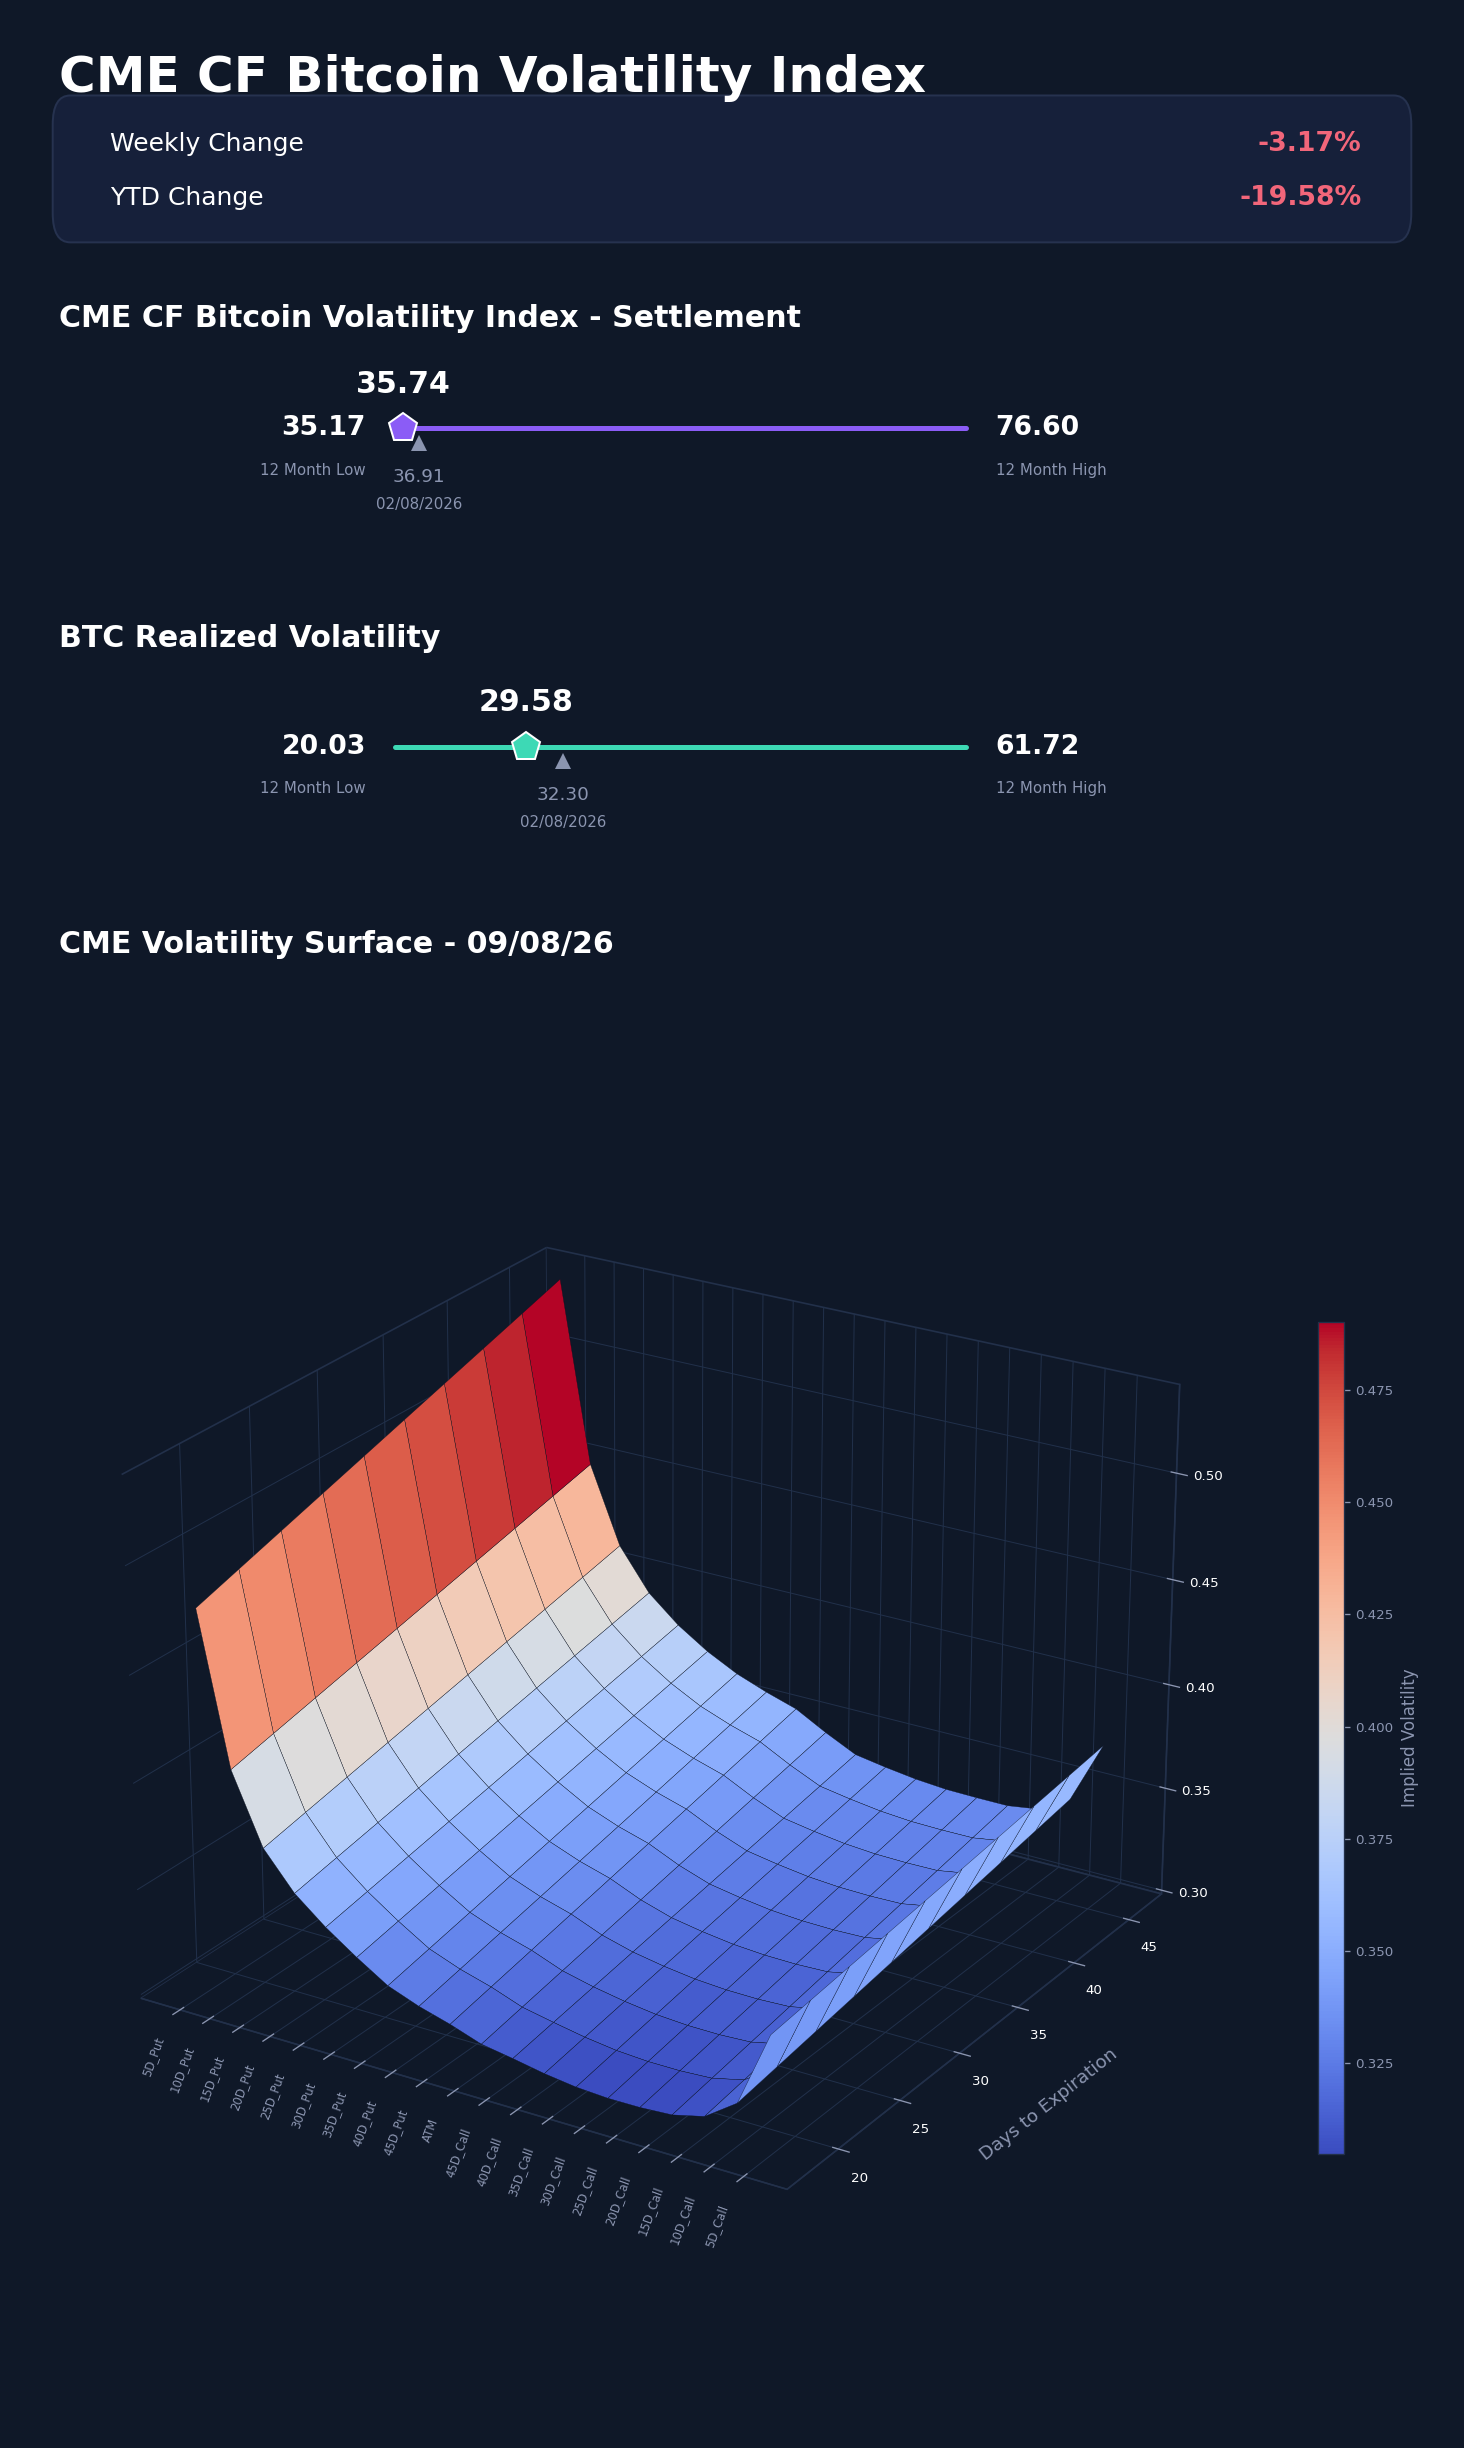
Implied volatility went to the floor of its year. BVXS settled at 35.74, down 1.17 vol. points and 3.17% w/w, and now sits 0.57 of a vol. point above its 12-month low of 35.17 against a 12-month high of 76.60. Realized volatility fell further and faster, dropping 2.72 vol. points to 29.58 and leaving the implied-realized spread at 6.16 vol. points, wider than the 4.61 of a week earlier. Implied has stopped falling as quickly as the market has stopped moving, which is what a floor looks like when it is reached by drift rather than by capitulation. The surface says the same thing in more detail. Against the prior week at matched tenors, the put wing collapsed while the call wing firmed: at the 24 to 31 day region the 5-delta put fell 3.87 to 4.22 vol. points and the 25-delta put 2.50 to 3.35, against a mean shift of 1.54 vol. points across the nineteen quoted deltas at the same tenors, while the 5-delta call rose 0.81 to 1.74. The 25-delta put skew, the premium of the 25-delta put over at-the-money, flattened from 4.09, 4.70 and 5.30 vol. points at 25, 28 and 31 days to a nearly flat 3.43, 3.44 and 3.45 across the same tenors. Downside protection was sold down through the week, and the term structure of skew went flat with it.
Market Cap Index Performance
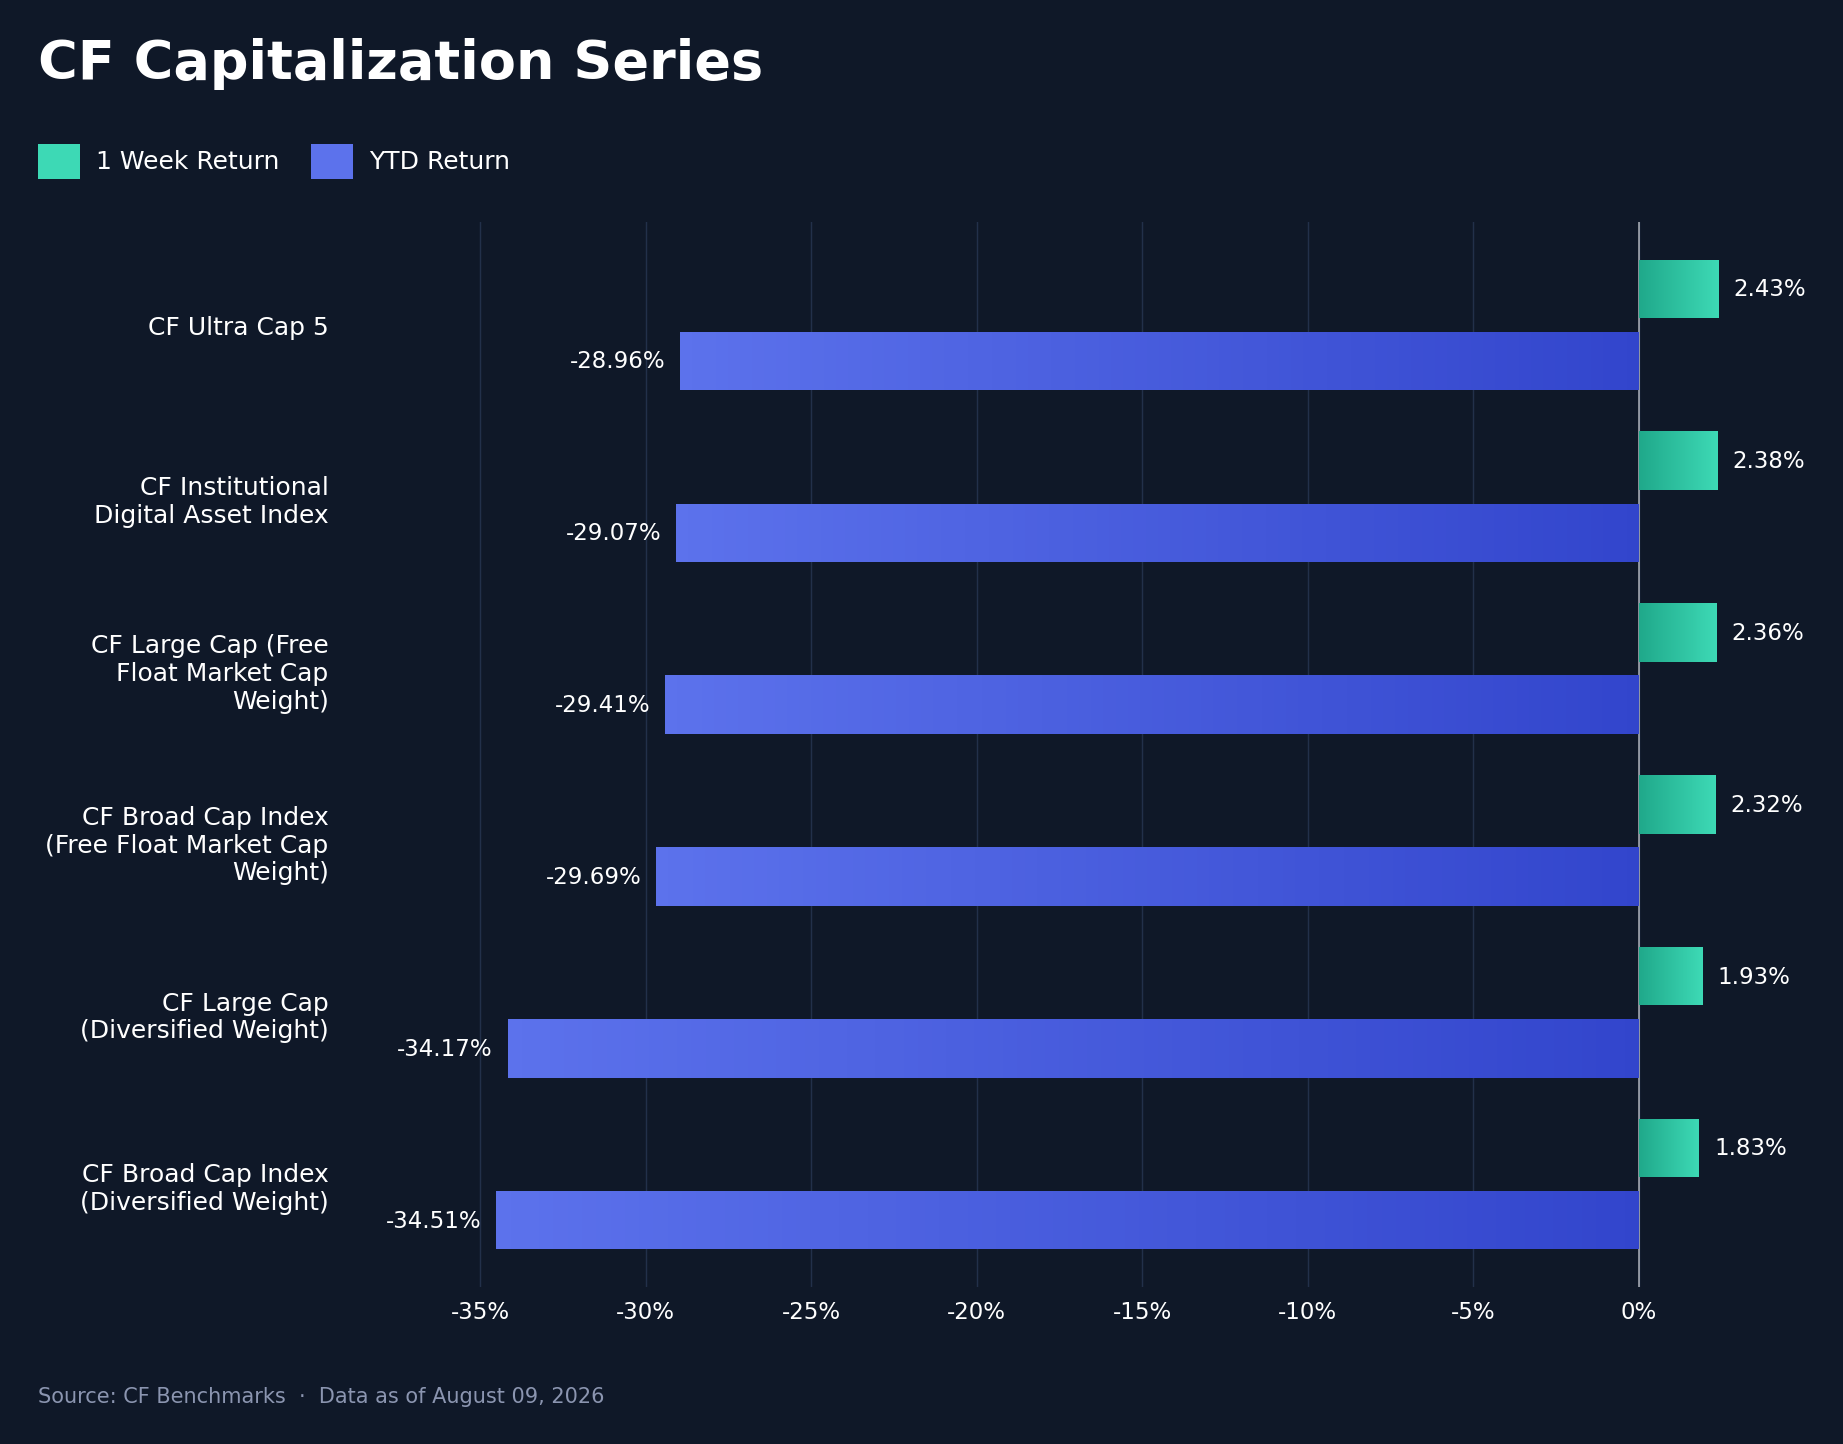
Every CF Capitalization Series index rose, reversing a week in which every one of them fell. The CF Ultra Cap 5 led at 2.426%, with the CF Institutional Digital Asset Index at 2.381%, CF Large Cap (Free Float Market Cap Weight) at 2.363% and CF Broad Cap Index (Free Float Market Cap Weight) at 2.317%; the diversified-weight pair trailed, at 1.928% for Large Cap and 1.829% for Broad Cap. The whole set fits inside a 0.597 pp band. Diversified weighting lagged free float in both families, by 0.488 pp in Broad Cap (from 0.317 pp a week earlier) and 0.435 pp in Large Cap (from 0.380 pp), so the spreading of weight away from the largest names cost rather than paid. The single-asset table points to why: the two names that fell, XRP and AVAX, are among those the diversified schemes tilt toward relative to free float. Flow arrived through a narrow channel to the same effect, with BlackRock's IBIT absorbing roughly 81% of the 853.5m dollars of spot Bitcoin creations on the second-lowest full week of category volume since October 2024. A uniform rates impulse met a concentrated bid, and breadth lagged the headline move.
Factors Analysis
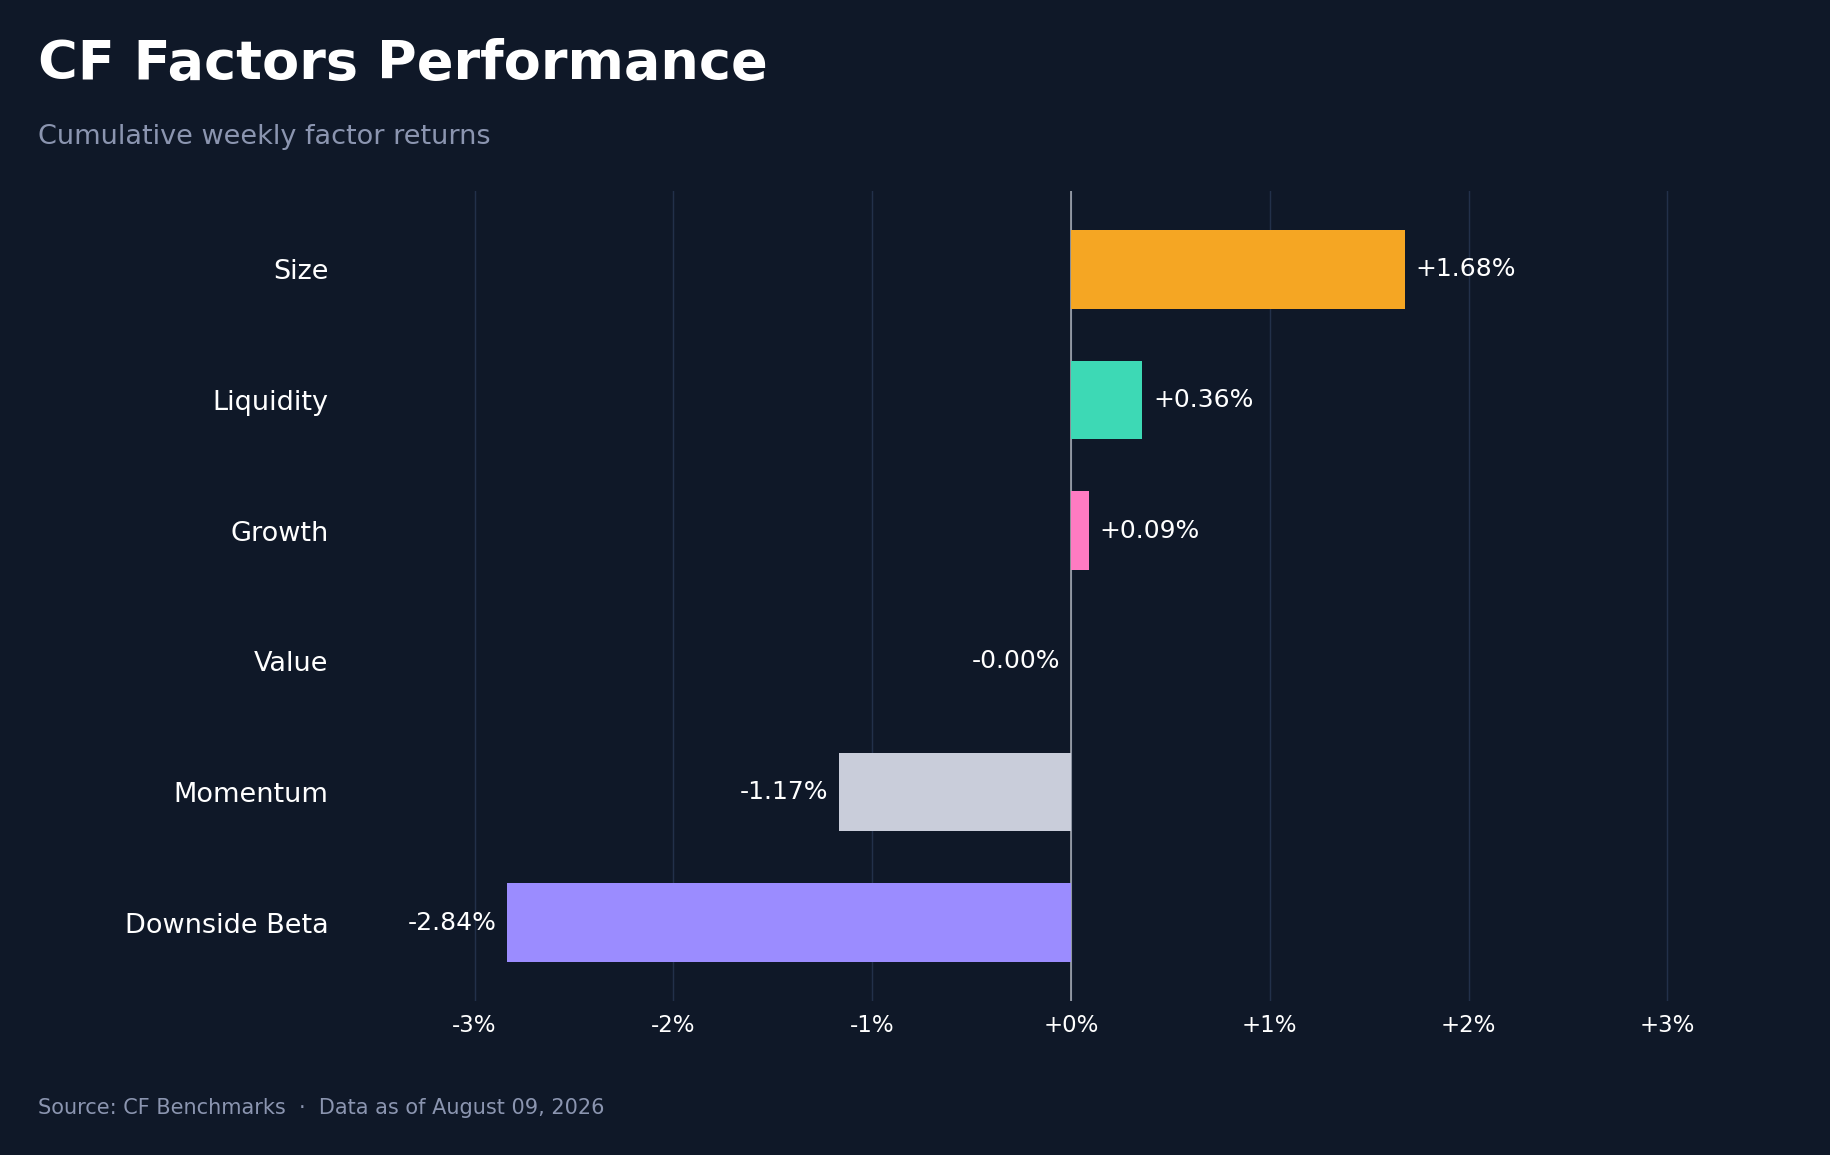
Factor leadership rotated hard even as the index tape calmed. Size led at 1.68%, ahead of Liquidity at 0.36% and Growth at 0.09%; Value was flat at -0.00%, Momentum fell 1.17% and Downside Beta lost 2.84%. The 4.51 pp range is nearly double the prior week's 2.43 pp, so dispersion moved out of the indices and into the factors. Two reversals did the work. Momentum swung 2.39 pp from 1.22% to -1.17%, the largest in the set, as the prior week's winners were not the names that led this one. Size swung 2.12 pp the other way, from -0.44% to 1.68%, and the CF DACS constituent table shows where that came from: the week's outsized gains sat in smaller names rather than in the majors. Downside Beta at the bottom of the set in a week when spot rose is the observation that ties the report together, because it means the advance did not pay for high-beta exposure.
Read our latest weekly crypto factors report: Factor Friday - August 7, 2026
Classification Series Analysis
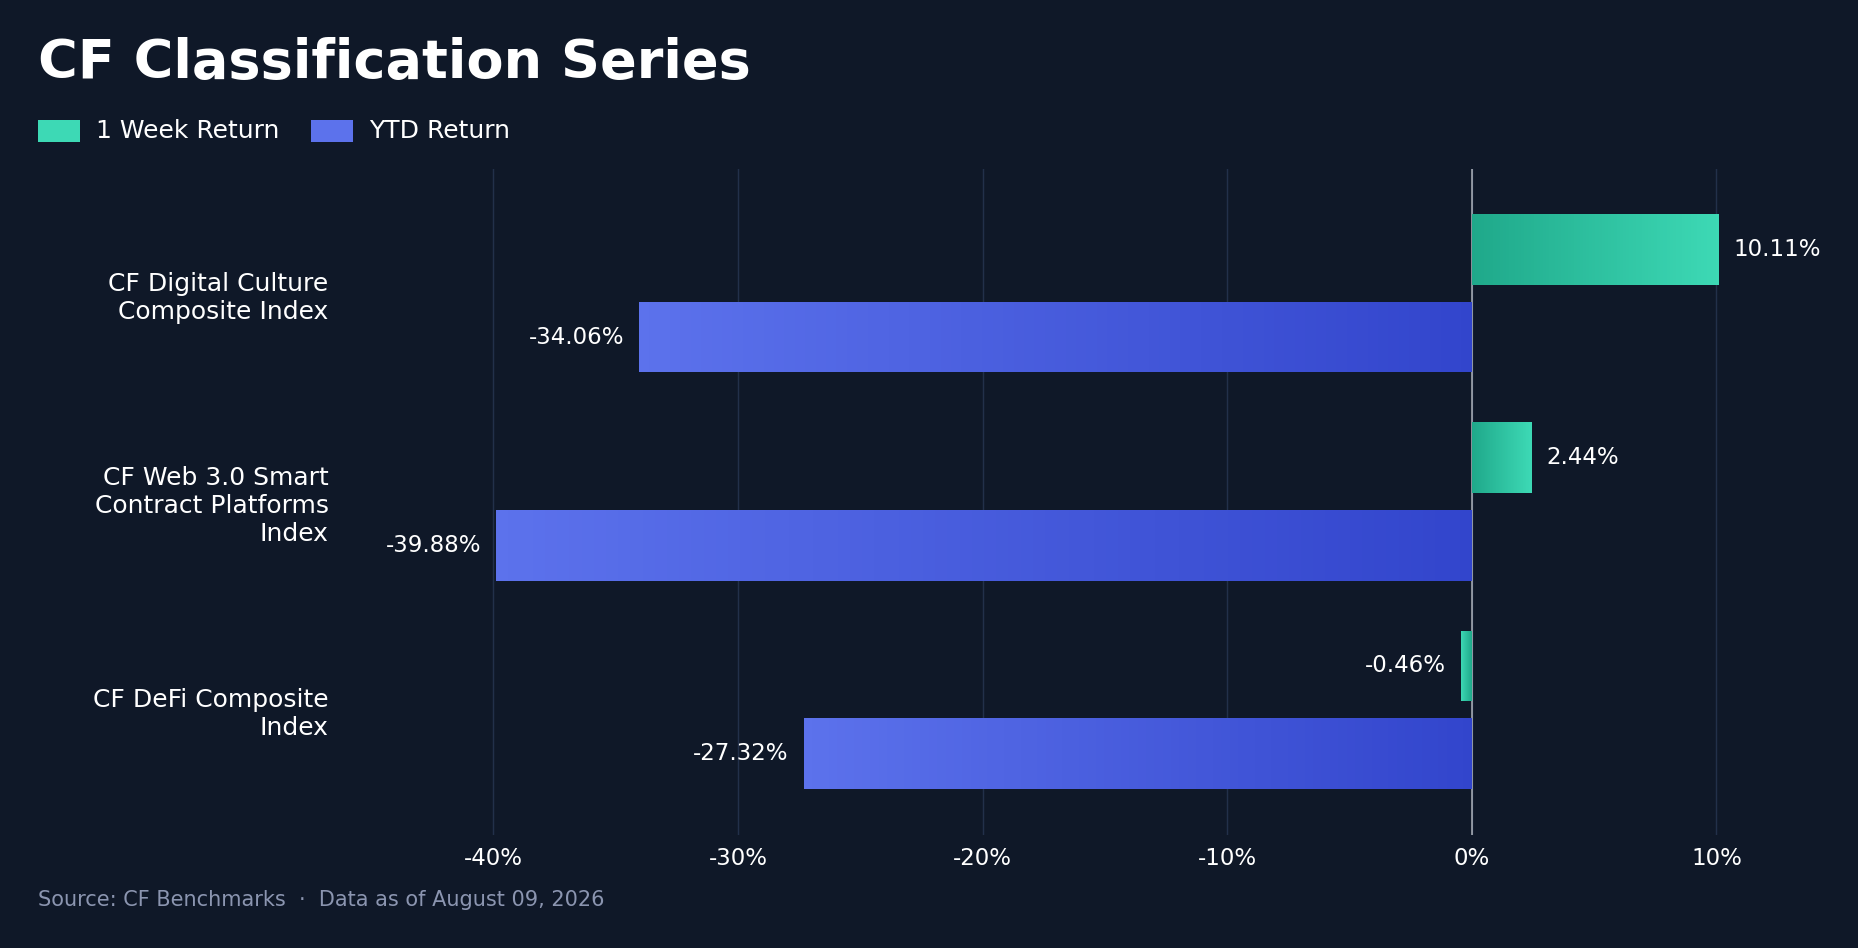
The CF Classification Series produced the widest leadership gap of the report. The CF Digital Culture Composite Index rose 10.11%, the CF Web 3.0 Smart Contract Platforms Index 2.44%, and the CF DeFi Composite Index fell 0.46%, a 10.57 pp spread between best and worst. Digital Culture went from the weakest of the three a week ago, at -3.44%, to the strongest, a 13.55 pp reversal, and it did so without a corresponding move in the CF DACS Culture sub-category, which averaged 0.26%. The two are different universes rather than two readings of one, and the gap between them is the cleanest available measure of how concentrated the week's gains were: a cap-weighted composite captured them, an equally-read sector average did not. On a YTD basis the ordering is unchanged, with DeFi at -27.32% ahead of Digital Culture at -34.06% and Web 3.0 at -39.88%, so a single week of leadership has not altered the year's ranking.
Sector Analysis
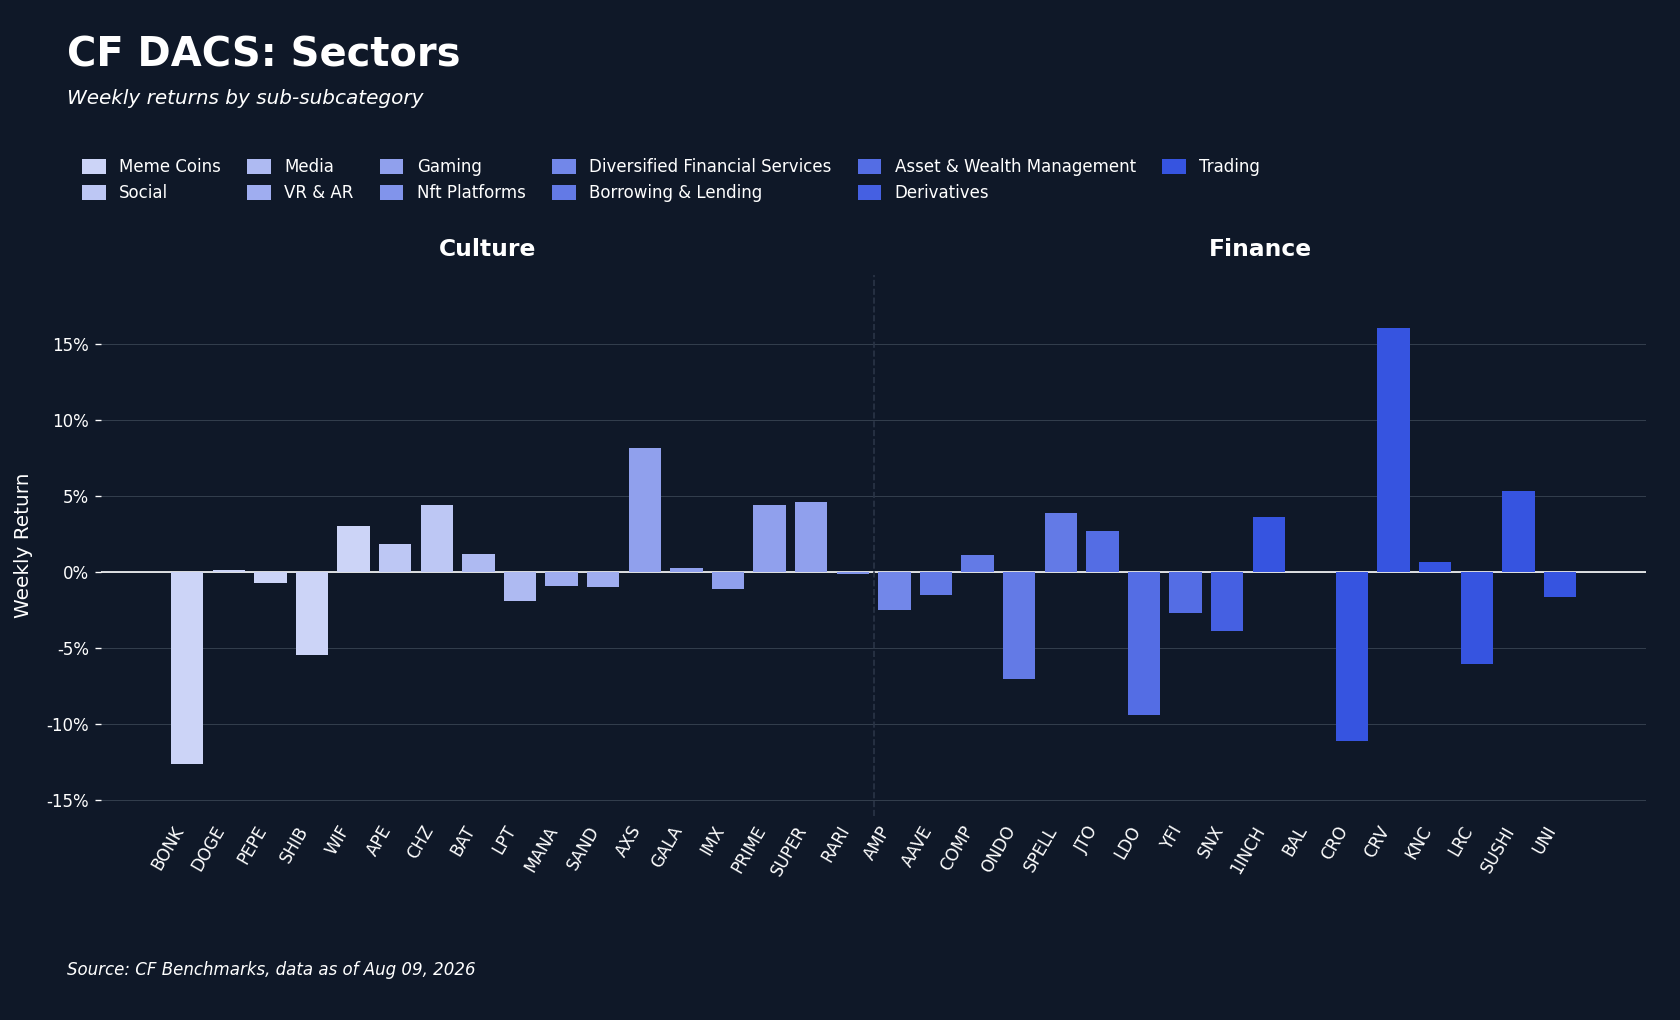
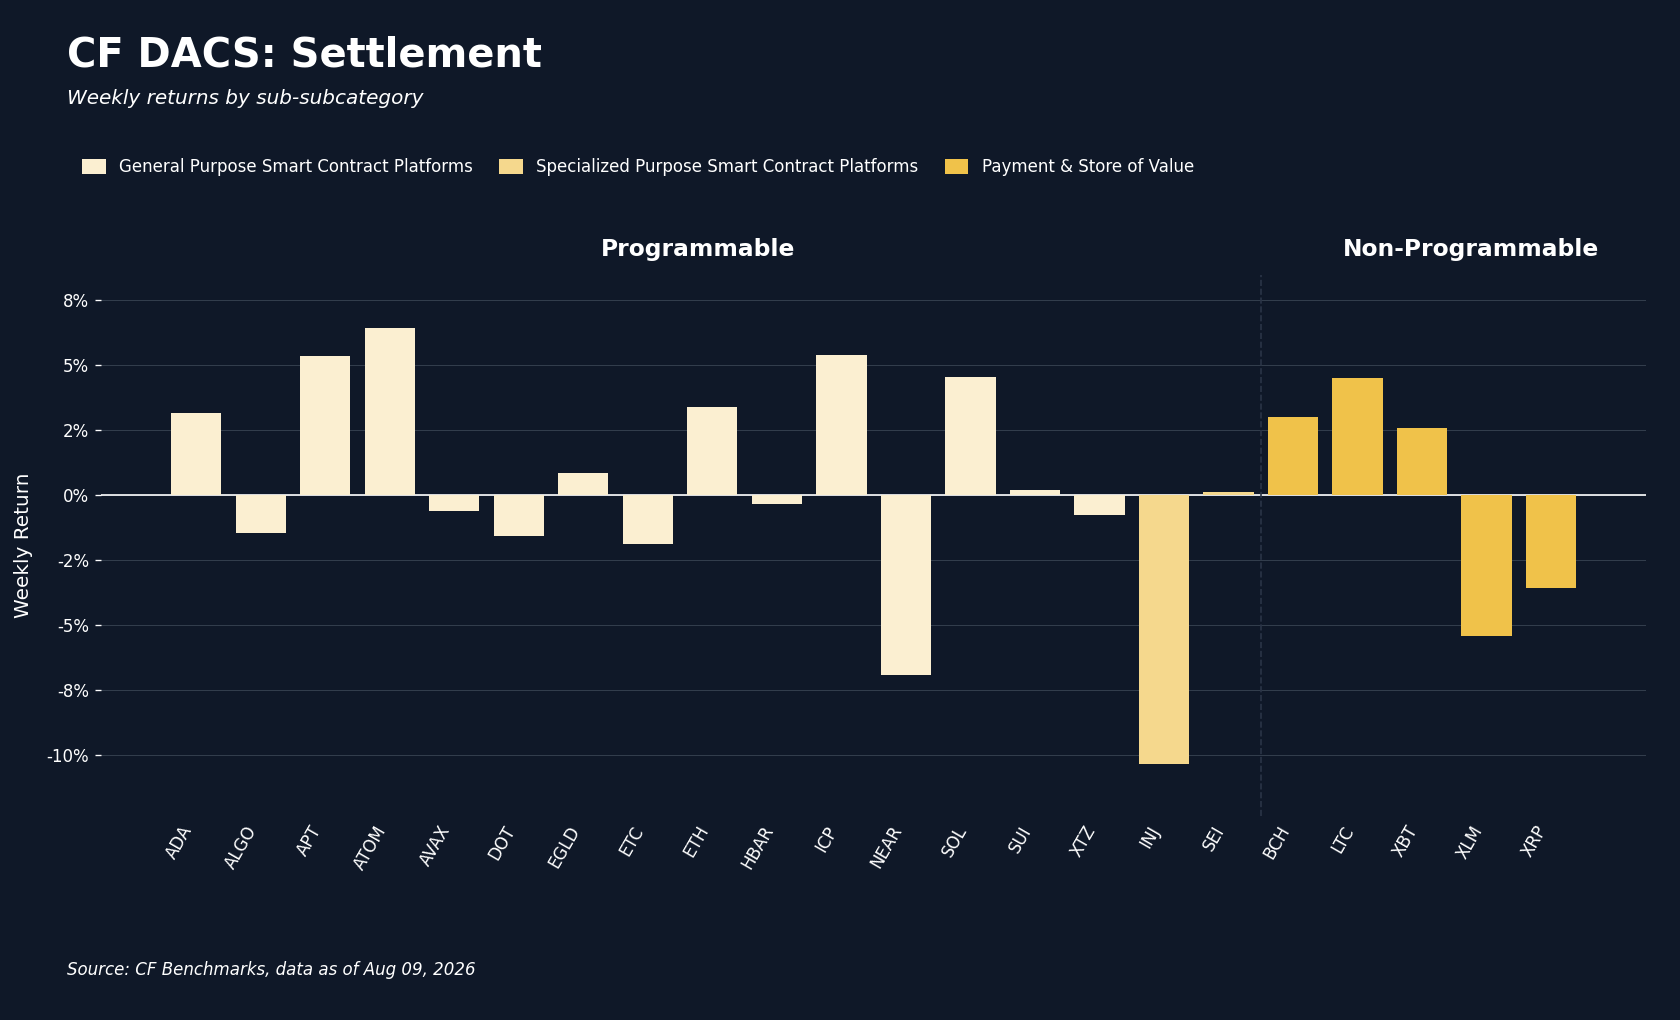
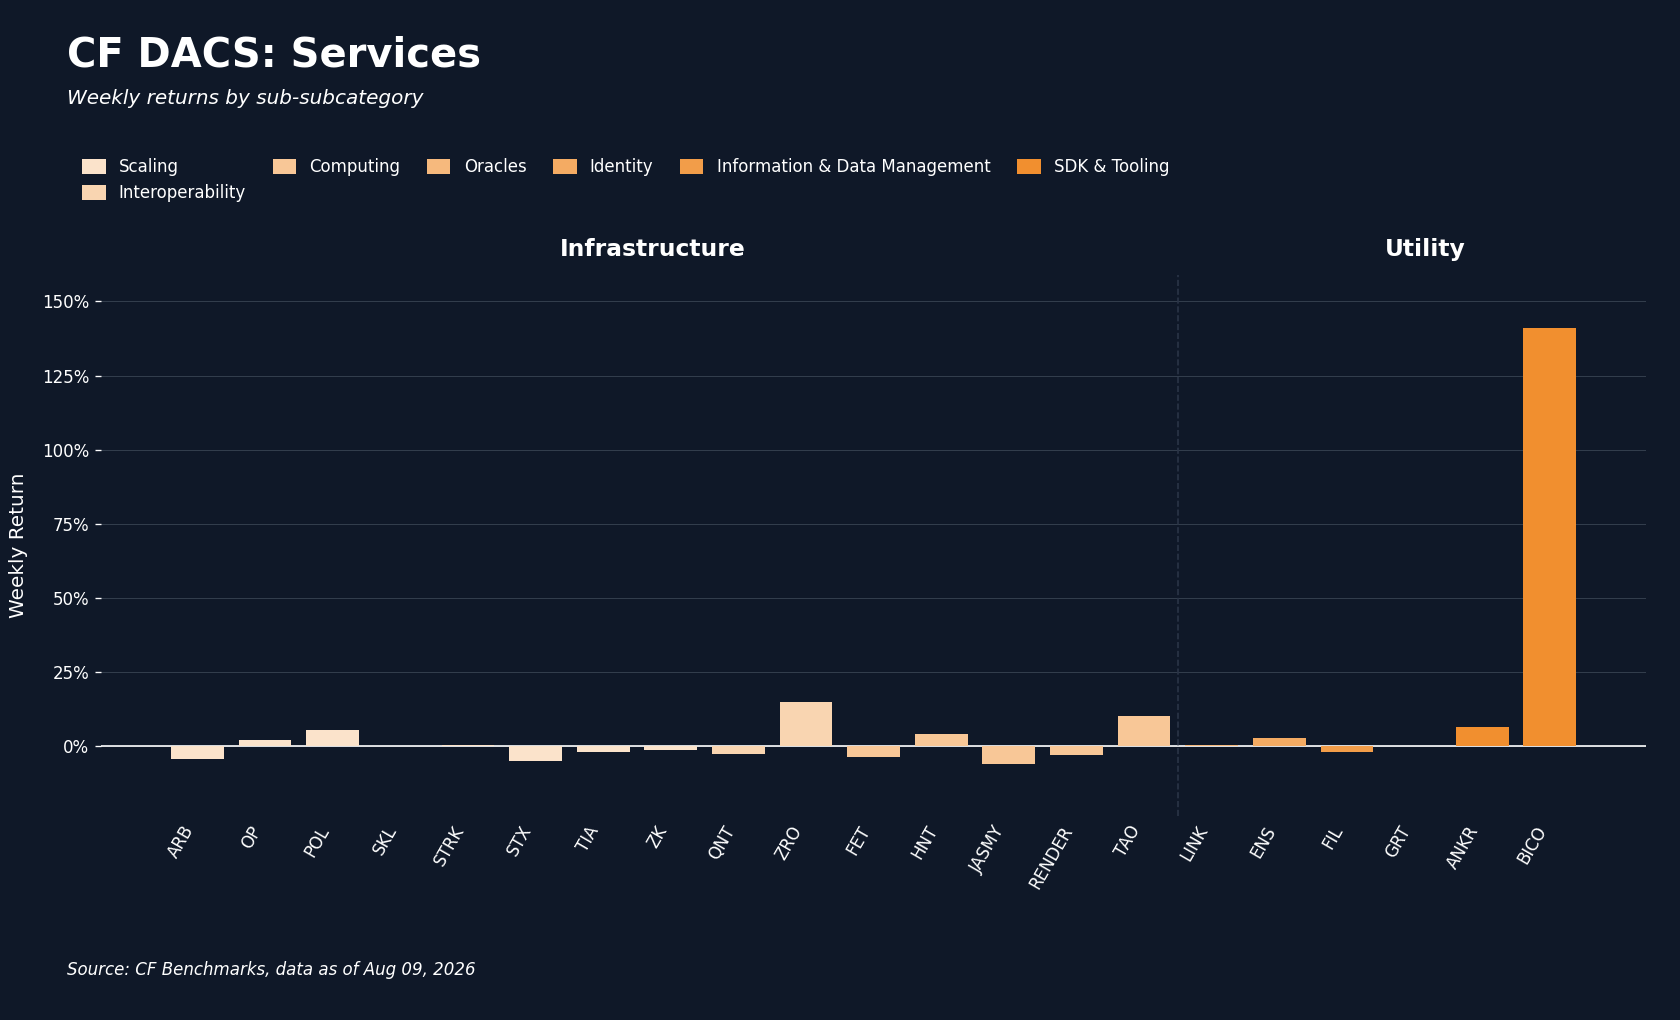
CF DACS Sub-Category averages were tightly bunched with one exception. Utility averaged 24.81%, Infrastructure 0.62%, Programmable 0.34%, Culture 0.26% and Non-Programmable 0.23%, while Finance was the only sub-category lower, at -0.72%. The Utility figure belongs to one name: Biconomy (BICO) rose 141.12% after perpetual listings on Aster DEX on August 4th and AlphaX DEX on August 5th preceded a short squeeze, with no accompanying protocol announcement, and excluding it the Utility average is 1.54%. That single position sets the widest token-level spread of the week at 153.71 pp against Bonk (BONK) at -12.59%; on the next-widest pair, Curve (CRV) at 16.10% against BONK, the spread is 28.69 pp. Finance carried the week's one catalyst-linked laggard: Lido (LDO) fell 9.38% on the week after EIP-8361, the Tapered Issuance Burn proposal submitted August 4th, which would phase consensus staking yield from roughly 2.6% to 1.2% over eighteen months and cut the revenue base of liquid-staking intermediaries; LDO fell 16.3% in the twenty-four hours after the filing. We would not read it as a DeFi de-rating, since Cronos (CRO) at -11.09% was the weaker name with no catalyst in the ledger and CRV led the same sub-category. Only 38 of 77 constituents were positive, so participation stayed narrower than the index returns imply.
CF Staking Series
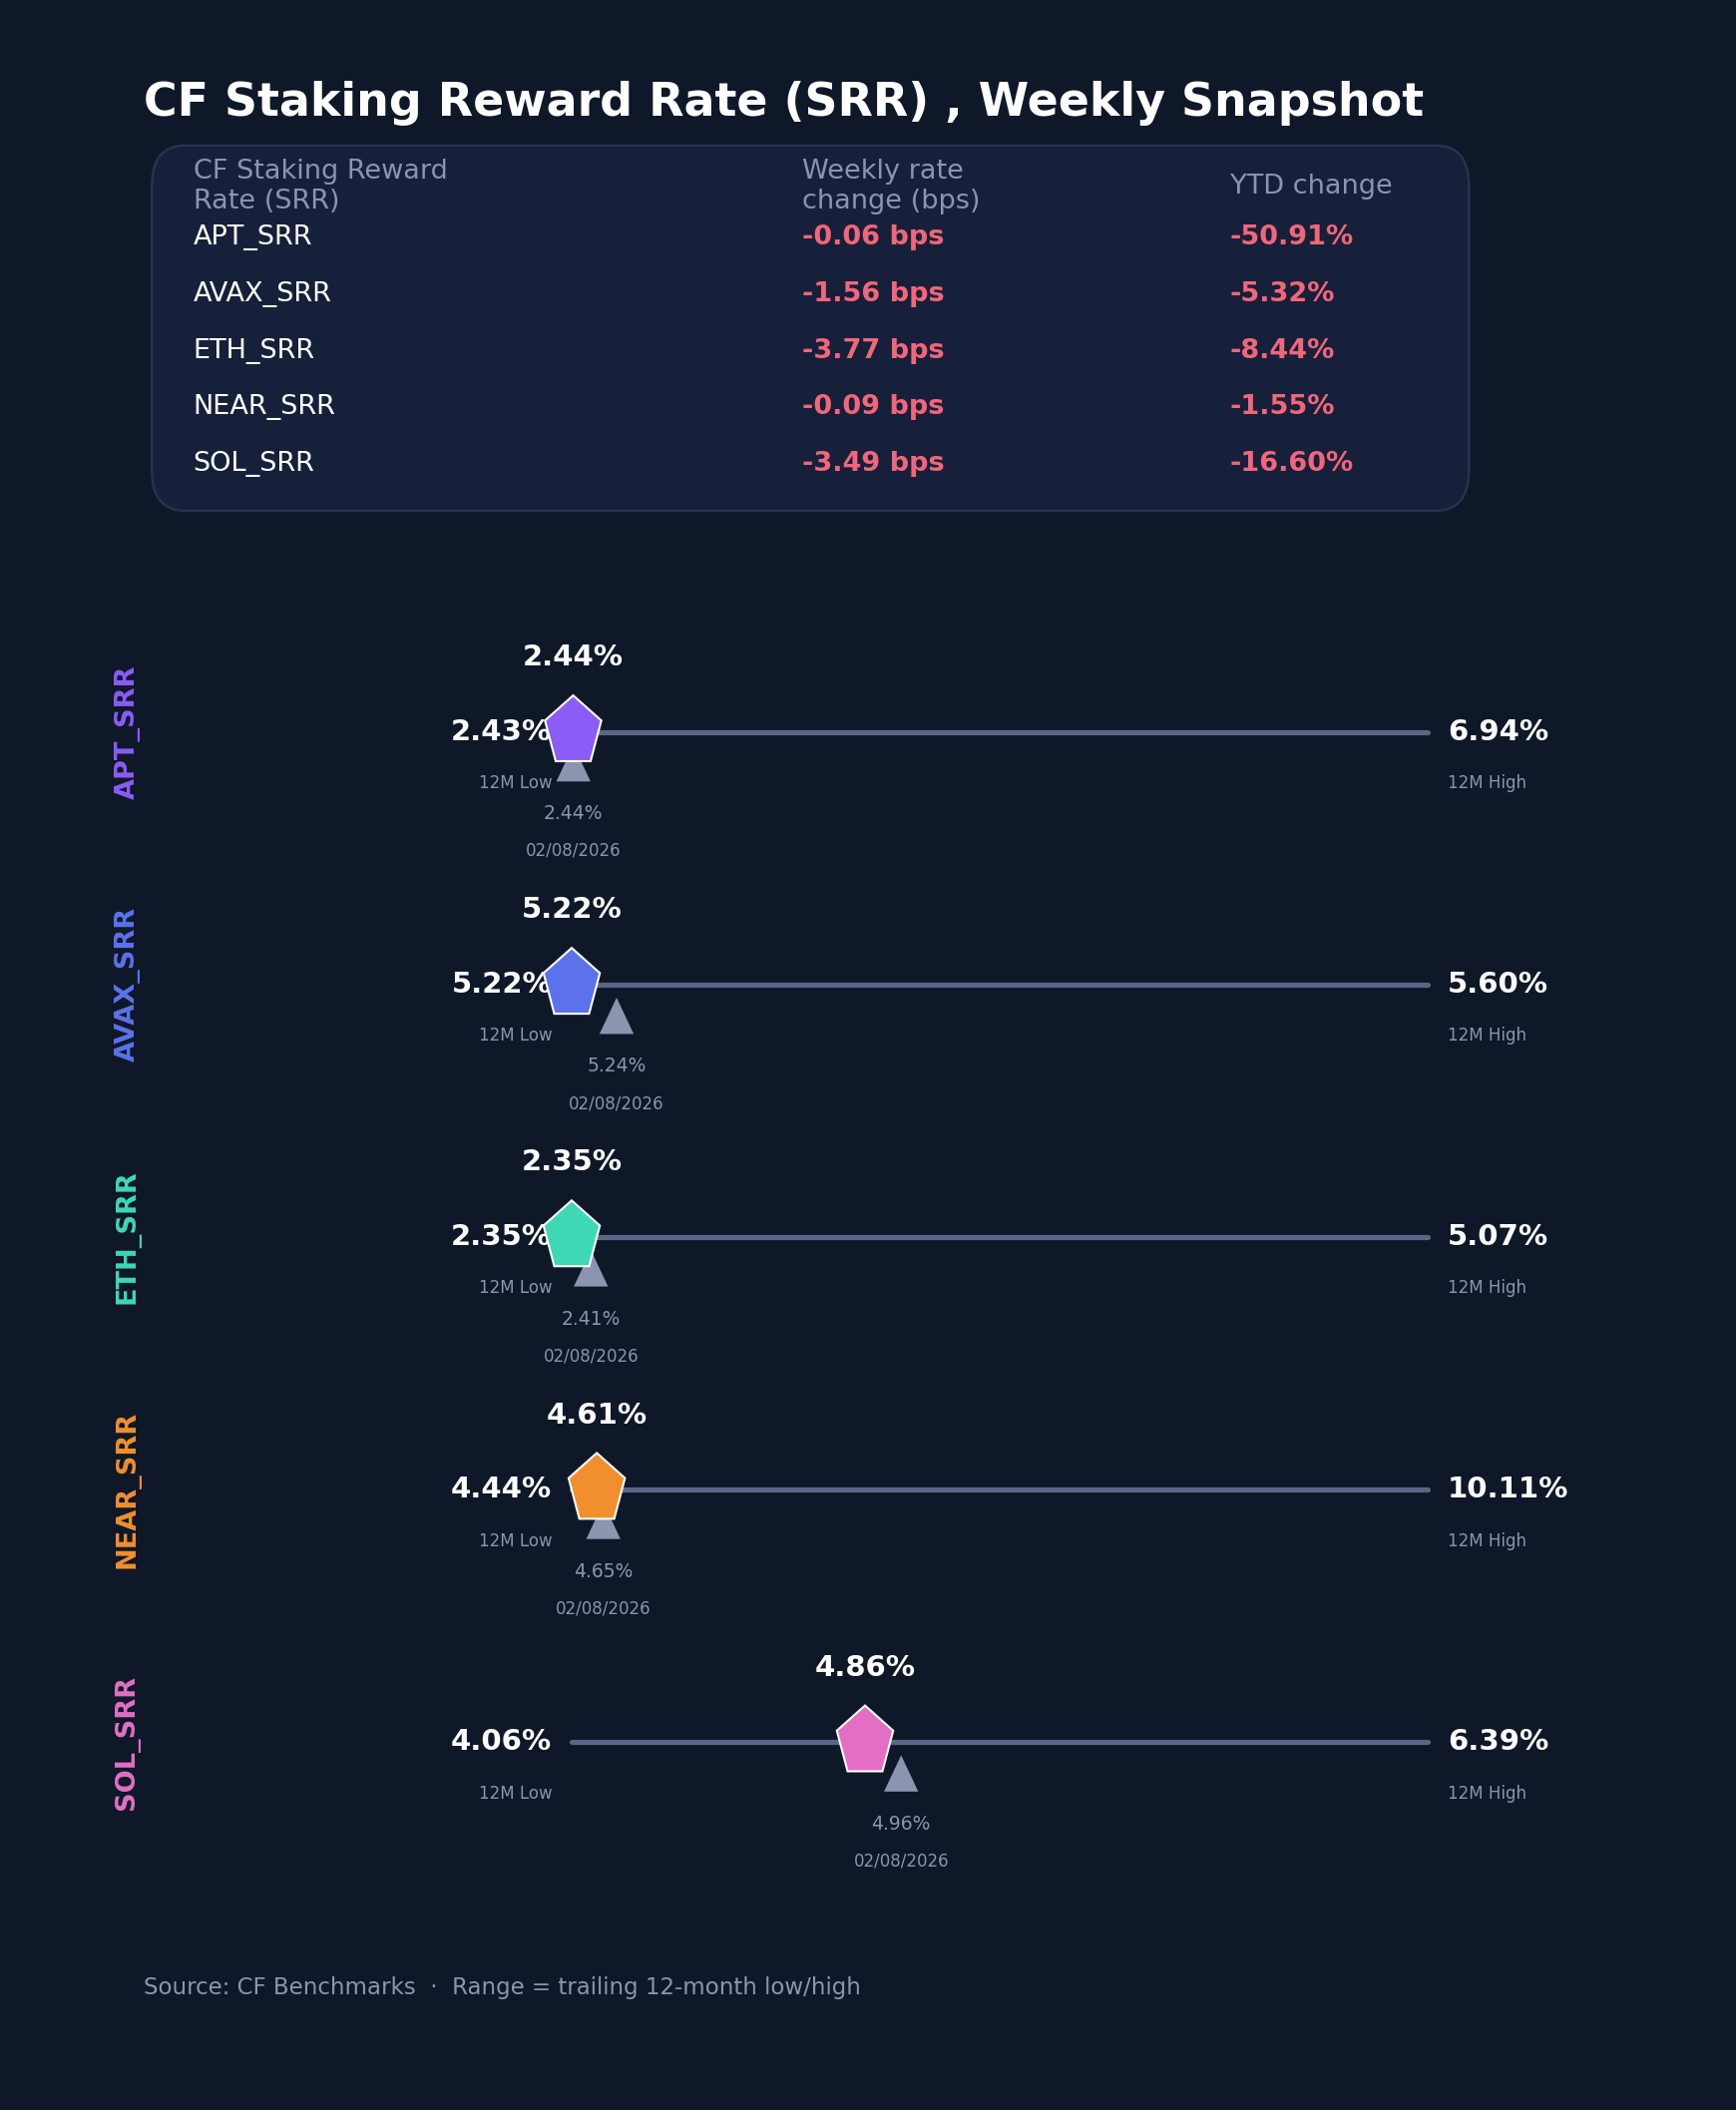
Reward rates fell across all five CF Staking Series indices, and two reached 12-month lows. Ether (ETH) posted the largest decline, down 3.77 bps to 2.3518%, its lowest in a year and a 1.58% relative index return; Solana (SOL) fell 3.49 bps to 4.8575% and Avalanche (AVAX) 1.56 bps to 5.2195%, also a 12-month low. Aptos (APT) and NEAR were close to unchanged, at -0.06 bps to 2.4361% and -0.09 bps to 4.6091%. Index returns spanned -1.58% for ETH to -0.02% for both APT and NEAR. Current rates range 286.8 bps, from ETH's 2.3518% to AVAX's 5.2195%. Two of five staking rates printing 12-month lows in the same week that BVXS approached its own gives a consistent reading of the compensation available for taking risk in this market, whether that risk is validation or gamma.
Interest Rate Analysis
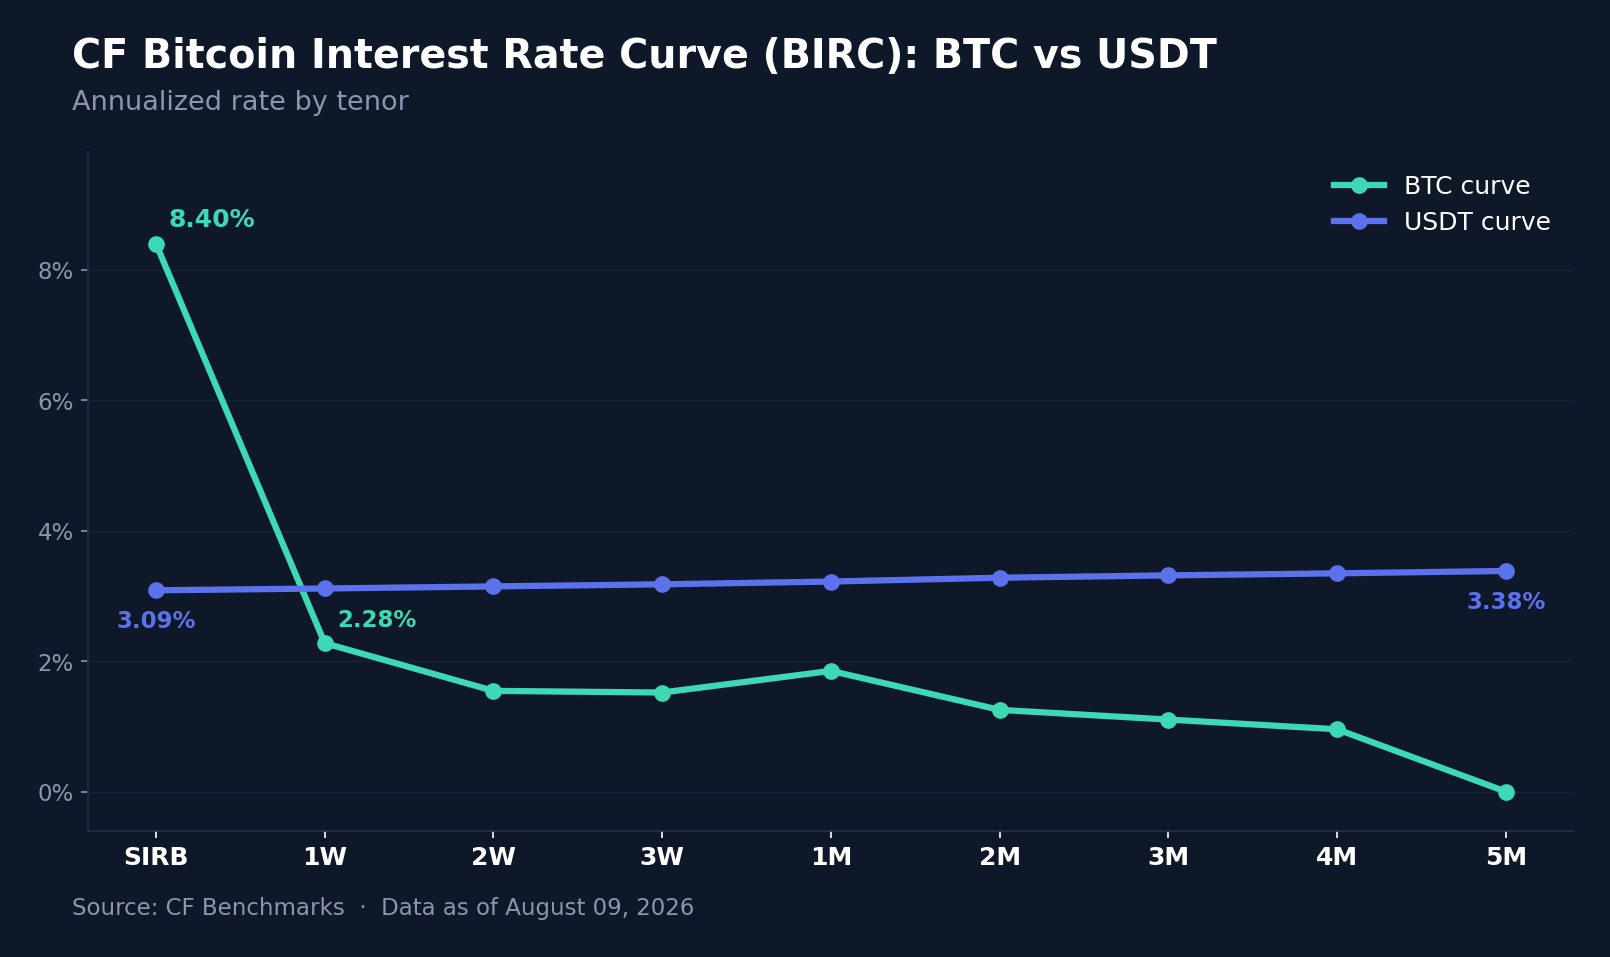
The CF Bitcoin Interest Rate Curve (BIRC) carried the week's sharpest dislocation, and it was confined to the BTC curve. The Bitcoin Session Rate (SIRB) jumped 161.5 bps to 8.4022%, leaving the BTC curve inverted by 744.5 bps against its 4-month tenor at 0.9569%. Behind the session rate, the BTC curve rose across the term: 3-week up 41.3 bps to 1.5204%, 1-month up 97.1 bps to 1.8522%, 2-month up 72.9 bps to 1.2542% and 3-month up 54.2 bps to 1.1056%, while the 1-week eased 2.2 bps to 2.2776% and the 2-week 15.8 bps to 1.5458%. The 5-month printed 0.0000% for a second week, which is a real level rather than a gap in the data and marks the absence of a bid for term BTC lending at that tenor. The USDT curve did the opposite of all of this, falling uniformly by 5.4 to 11.9 bps and holding its upward slope from 3.0881% at SIRB to 3.3845% at five months. Across both curves tenor changes ranged from -15.8 bps to 161.5 bps, and every bit of the upper end belongs to Bitcoin. A session rate that spikes while dollar funding drifts lower is a collateral and positioning event inside Bitcoin, not a change in the cost of money.
Closing Synthesis
The week is best read through the rates channel. After a hawkish early-week setup, Friday's payrolls miss, downward revisions and softer wage growth shifted September hike odds from 55% to 40%, pushed the 2-year Treasury yield 8.7 bps lower and eased the dollar index 0.37%. Bitcoin gained 2.59% and every CF Capitalization Series index rose inside a 0.60 pp band, a uniform response to a softer expected path for rates. The payrolls print confirmed a bid already in place, with ETF creations extending it, while BVXS at 35.74 showed the market pricing down broad rates risk.
The information contained within is for educational and informational purposes ONLY. It is not intended nor should it be considered an invitation or inducement to buy or sell any of the underlying instruments cited including but not limited to cryptoassets, financial instruments or any instruments that reference any index provided by CF Benchmarks Ltd. This communication is not intended to persuade or incite you to buy or sell security or securities noted within. Any commentary provided is the opinion of the author and should not be considered a personalised recommendation. Please contact your financial adviser or professional before making an investment decision.
Note: Some of the underlying instruments cited within this material may be restricted to certain customer categories in certain jurisdictions.
Factor Friday - October 9, 2026
Size led CF Benchmarks' factor table for a second week at 2.58% as the Market fell 4.98%. Size held after QNT's reversal, though its cohort spread narrows sharply without three outlier tokens, and Downside Beta and Liquidity gave back part of last week's gains.

Mark Pilipczuk
Small Cap Tokens Outperform in September
The CF Free-Float Broad Cap Index rose 10.28% in September as Bitcoin supplied 59% of the gain while trailing the index. Returns across the Capitalization Series ran from +7.74% for Ultra Cap 5 to +14.01% for Emerging Crypto, which holds no Bitcoin, as altcoins outpaced Bitcoin.
Mark Pilipczuk
CF Digital Asset Index Family Multi Asset Series – Extraordinary Rebalance Announcement
CF Digital Asset Index Family Multi Asset Series - Extraordinary Rebalance Announcement
CF Benchmarks
By clicking Accept, you consent to CF Benchmarks's use of cookies.
Visit Cookie Settings to learn how CF Benchmarks uses cookies and to adjust your preferences.