
Jul 21, 2025
Weekly Index Highlights, July 21, 2025
Market Performance Update
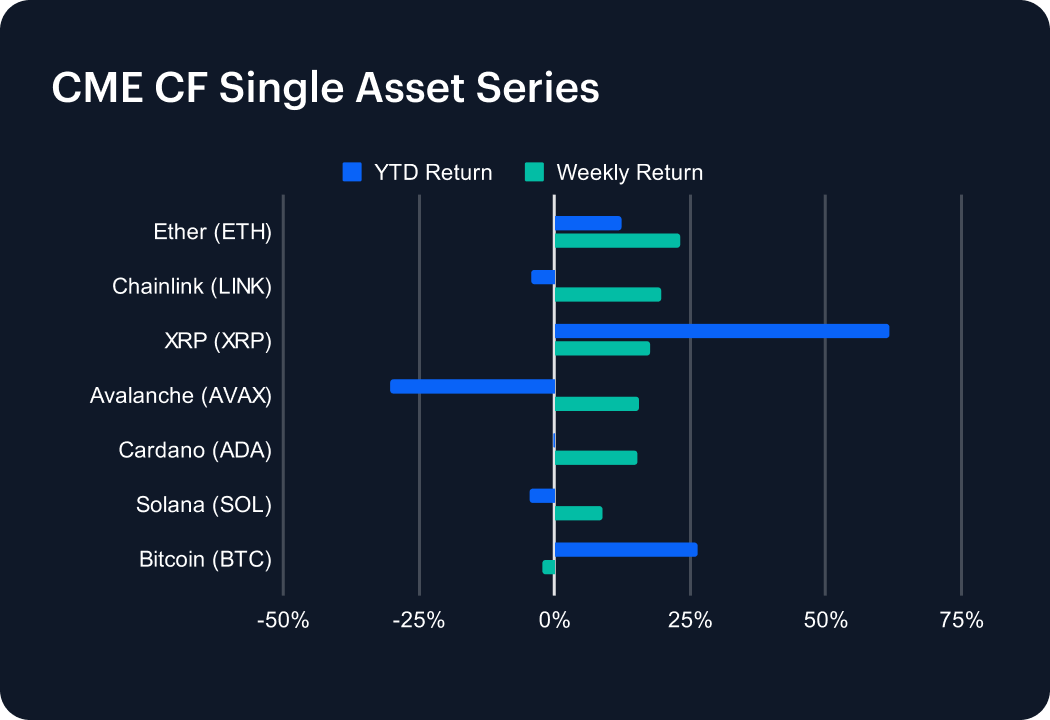
Altcoins led the digital asset market last week, as six of the seven major tokens posted gains. Leading the pack was Ether (ETH), which jumped 23.17%, lifting its year-to-date return into positive territory (+12.42%). Chainlink (LINK) climbed 19.67%, cutting its YTD slide to 4.24%, while Ripple’s XRP (XRP) added 17.62%, widening its annual advance to 61.66%. Avalanche (AVAX) notched a 15.42% weekly gain, easing its YTD loss to 30.29%, and Cardano (ADA) rose 15.21%, bringing its year-to-date decline to just 0.12%. Solana (SOL) ticked up 8.92%, narrowing its YTD drop to 4.47%. Bitcoin (BTC) bucked the trend with a 2.22% weekly retreat but still sits on a 26.23% gain for the year. Ongoing regulatory progress and corporate treasury allocations continued to bolster investor appetite.
Sector Analysis
The DACS segments again saw broad-based gains last week, with programmable settlement tokens leading the charge: XTZ surged 77.99%, ETC jumped 32.58%, and ETH added 23.17%. Among trading tokens, CRV topped the charts at 45.07%, SUSHI climbed 38.33%, while 1INCH and KNC lagged with gains of just 1.56% and 2.46%, respectively. In the Culture sub-category, meme token BONK spiked 29.42% and DOGE rose 23.88%, though PRIME fell 2.22%. Utility services saw ENS rally 23.48% and LINK 19.67%, outpacing GAL’s 1.42% lift. Infrastructure was boosted by HNT’s 24.54% leap, while QNT dipped 0.18%. Non-programmable settlement gains were led by LTC (21.52%) and XRP (17.62%), even though Bitcoin slid 2.22%. Overall, programmable settlement and high-beta tokens drove performance amid broader sector divergence.
CF Staking Series
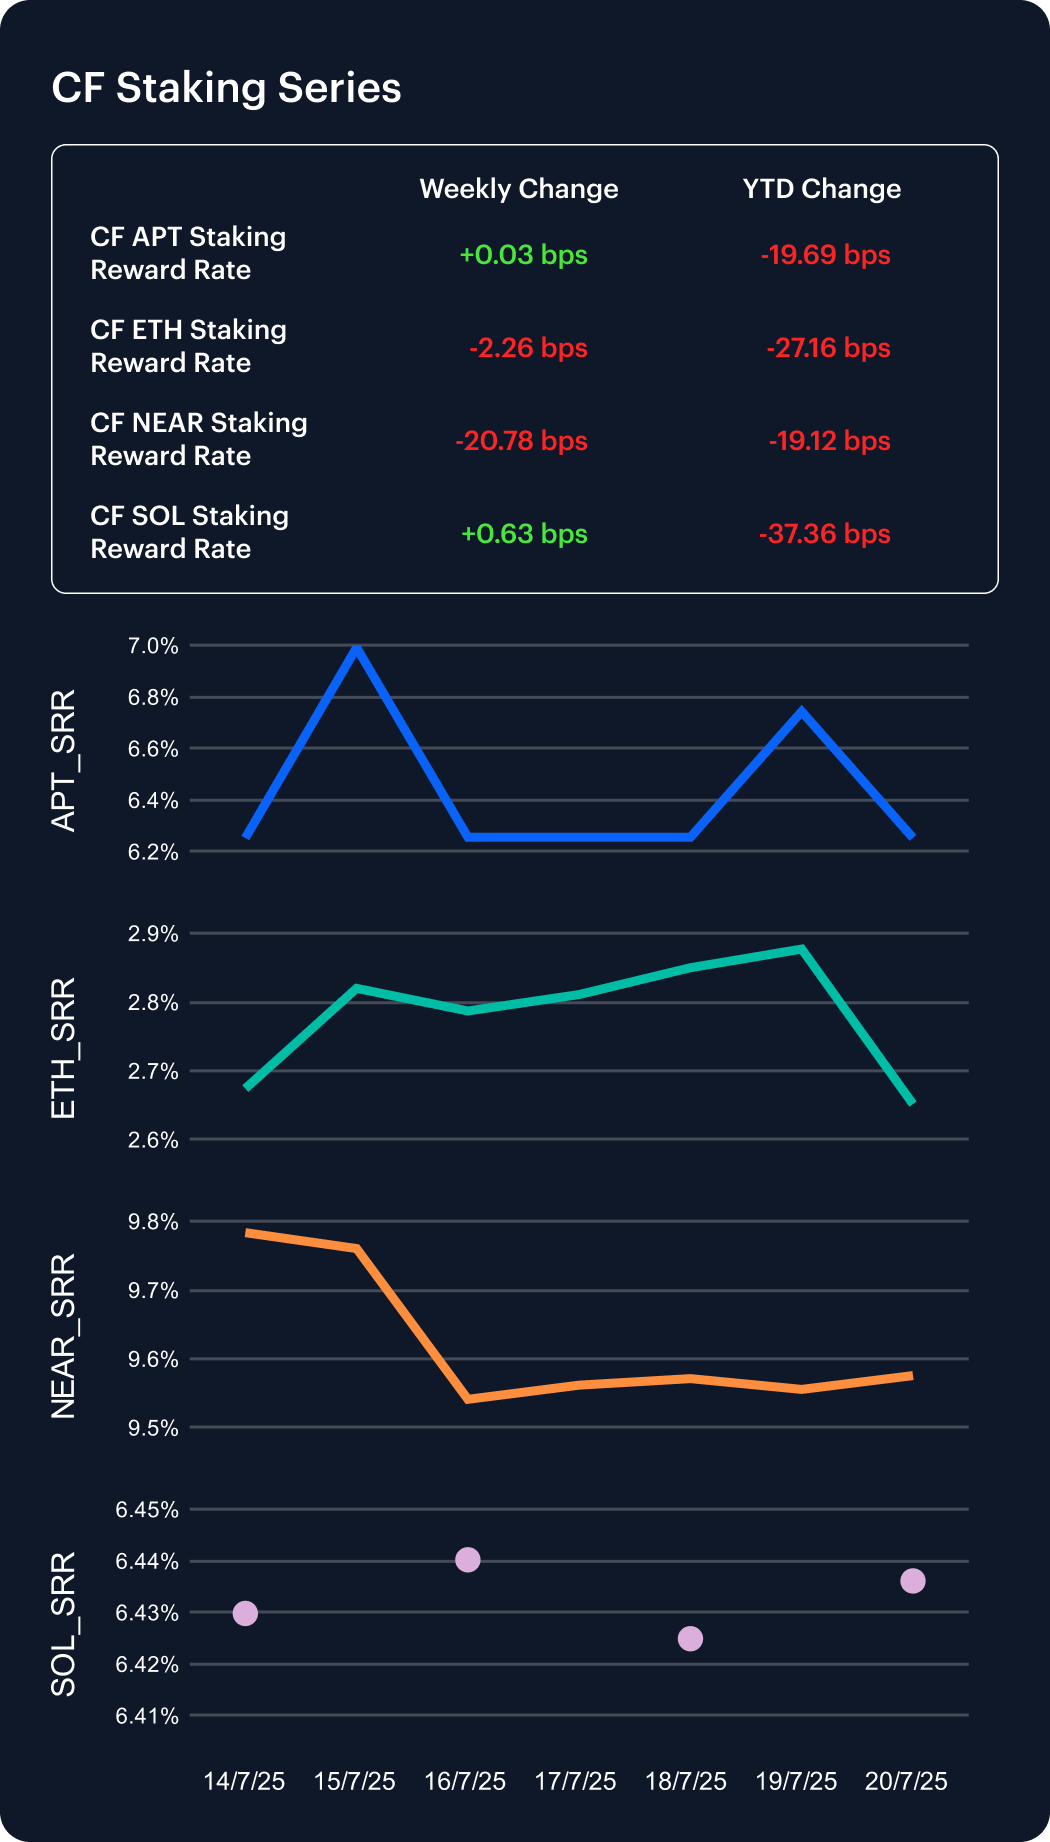
Staking yields diverged sharply last week, with Solana once again at the forefront. SOL_SRR rose by 0.63 basis points to 6.44%, trimming its year-to-date decline to 5.49%. Aptos was essentially flat, as APT_SRR edged up just 0.03 bps to 6.25%, narrowing its YTD drop to 3.05%. By contrast, Ether’s reward rate slipped 2.26 bps to 2.65%, widening its YTD decrease to 9.29%. NEAR proved the weakest, with NEAR_SRR plunging 20.78 bps to 9.58%, deepening its year-to-date decline to 1.96%. These shifts reflect varied staking demand and evolving inflation dynamics across proof-of-stake networks, which continue to drive a broad dispersion in on-chain reward profiles.
Market Cap Index Performance
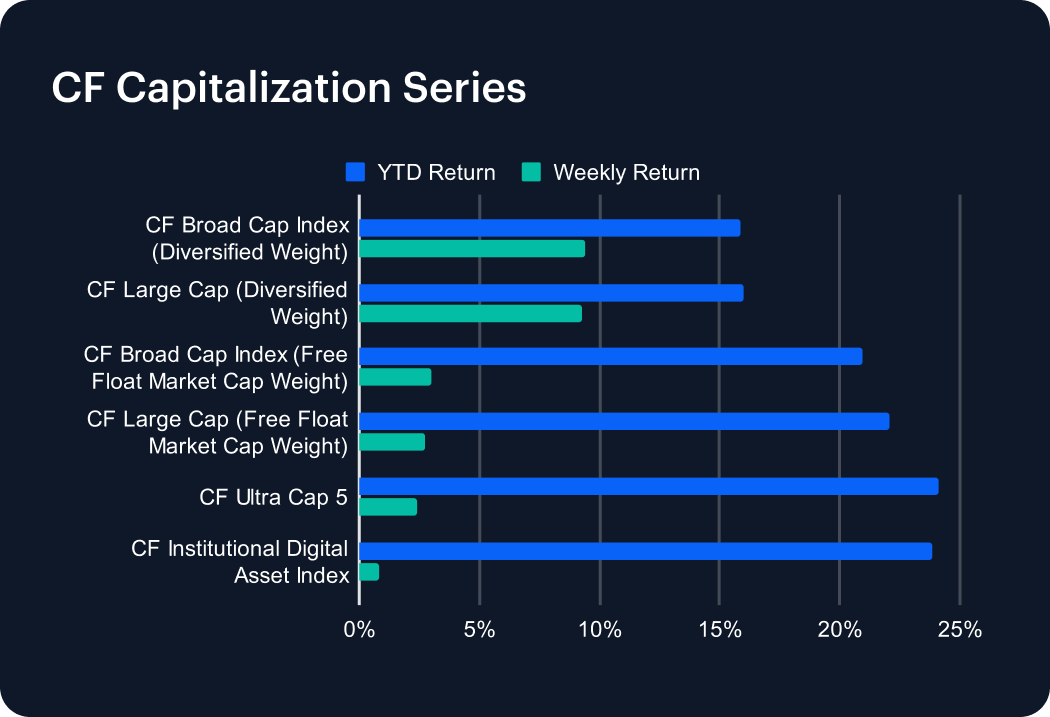
The CF Capitalization Series powered ahead last week, with every marquee index logging double-digit gains. Leading the charge was the CF Broad Cap Index (Diversified Weight), which advanced 9.42%, pushing its YTD return to 15.85%. Hot on its heels, the CF Large Cap (Diversified Weight) rallied 9.25%, lifting year-to-date performance to 16.02%. Free-float variants posted more modest moves: the CF Broad Cap (Free Float) climbed 2.97%, taking its YTD to 20.95%, while the CF Large Cap (Free Float) added 2.72%, boosting its annual return to 22.04%. Among smaller benchmarks, the CF Ultra Cap 5 surged 2.40% (24.13% YTD), and the CF Institutional Digital Asset Index, the laggard at 0.86%, still commands a 23.87% gain this year. The leading performance by diversified-weight indices signals an increased risk appetite as altcoins catch a bid.
Classification Series Analysis
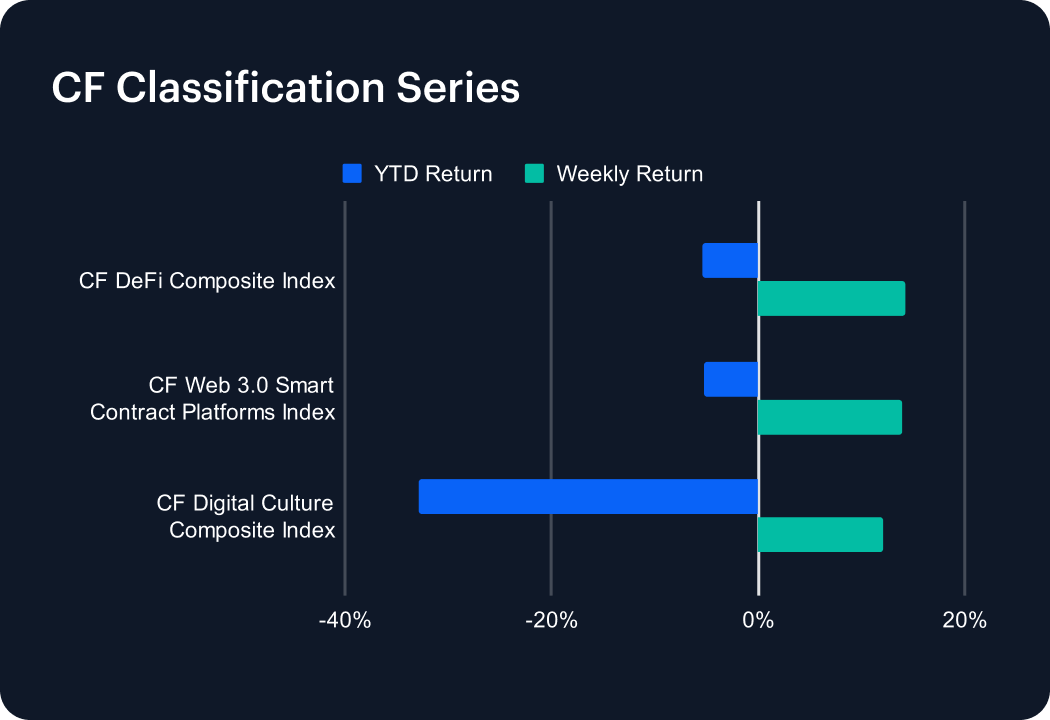
The CF Classification Series extended its robust rebound last week, with every thematic index posting outsized gains. Leading the pack, the CF Web 3.0 Smart Contract Platforms Index rallied 13.97%, narrowing its year-to-date deficit to 5.23%. The CF Digital Culture Composite Index followed with a 12.12% surge, trimming its 2025 decline to 32.82%. Meanwhile, the CF DeFi Composite Index climbed 14.18%, pulling its YTD shortfall down to 5.44%. This marks the second consecutive week of high-beta leadership, reflecting renewed risk appetite across thematic segments. Nonetheless, earlier double-digit drawdowns mean these benchmarks still have further to climb to recapture early-January peaks.
Volatility
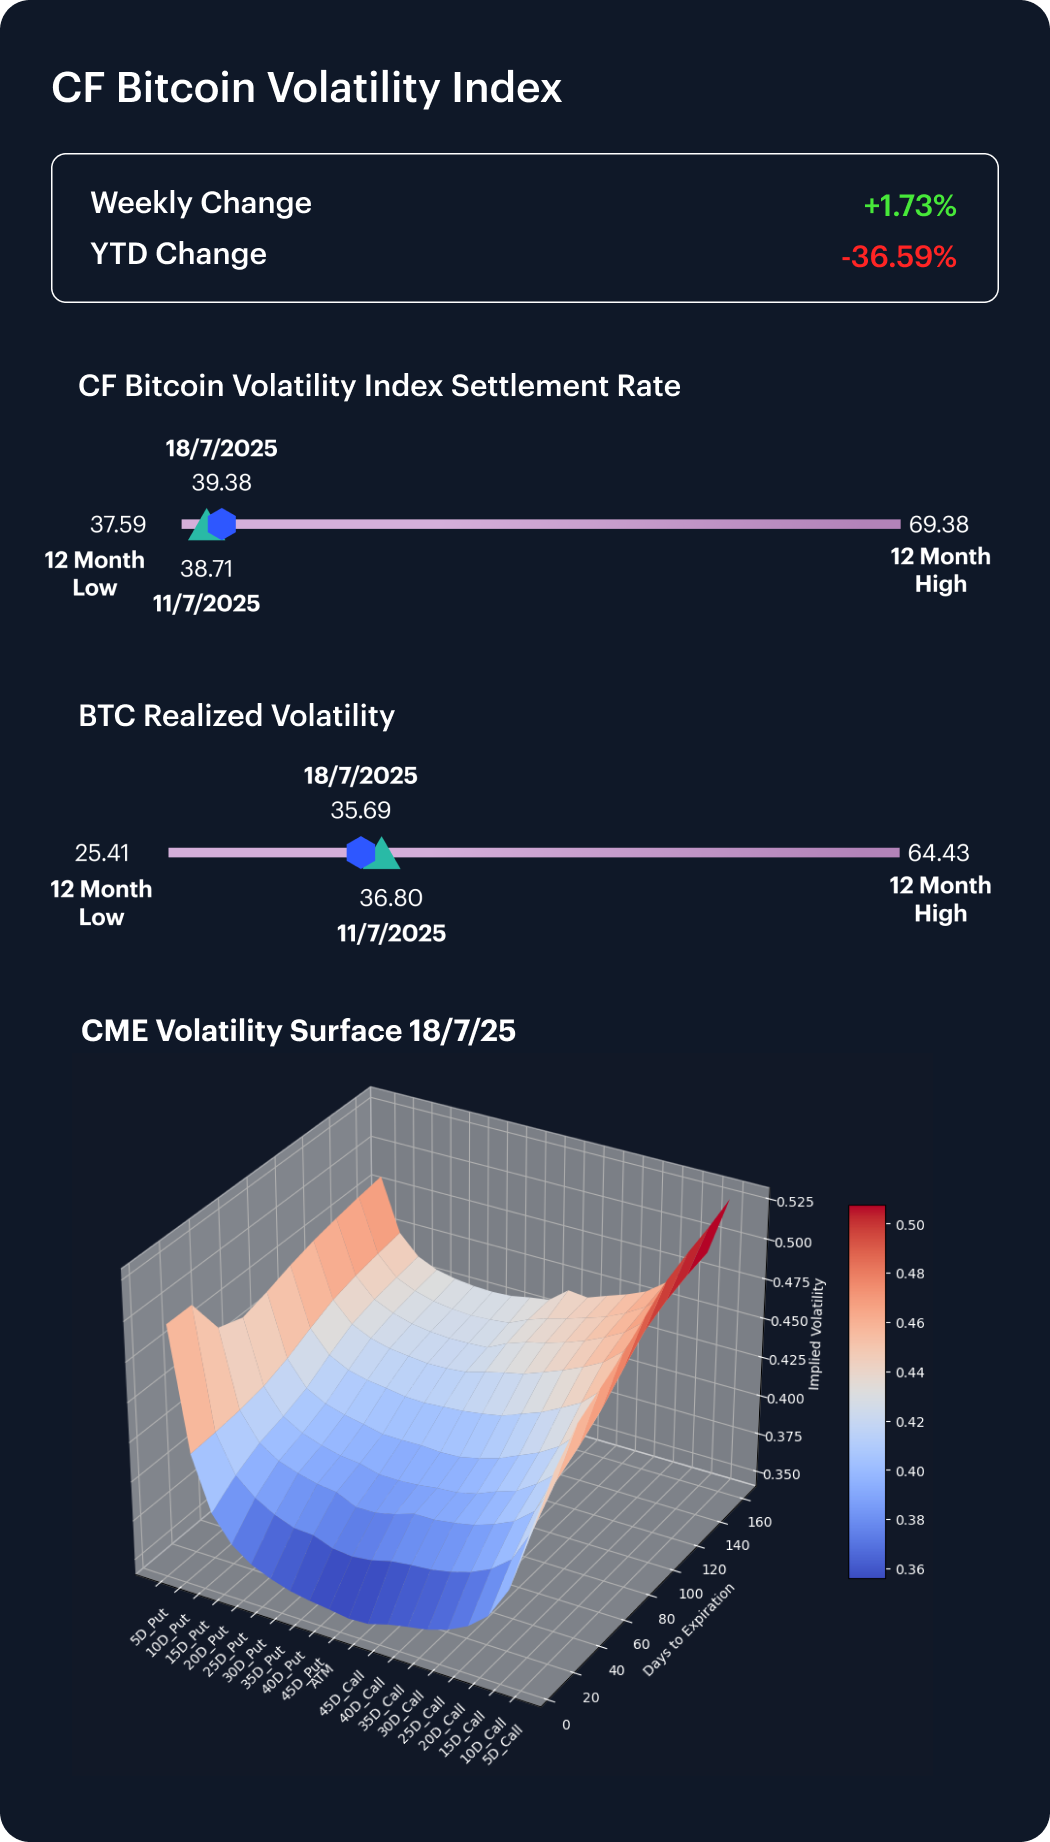
The CF Bitcoin Volatility Index Settlement Rate (BVXS) rose 1.73% last week, climbing from 38.71 to 39.38, and remains 36.59% below its January 1 level. Realized volatility eased to 35.69, down from 36.80 a week earlier, reflecting slightly calmer spot swings even as option premia stay muted. Skew remains broadly positive across all delta buckets and convexity has increased, steepening the volatility curve. Short-dated tenors under 60 days still trade as the softest segment of the surface, whereas longer maturities command a material premium. Together, firmer BVXS prints, elevated convexity and pervasive skew positivity indicate that market participants are continuing to add directional exposure.
Interest Rate Analysis
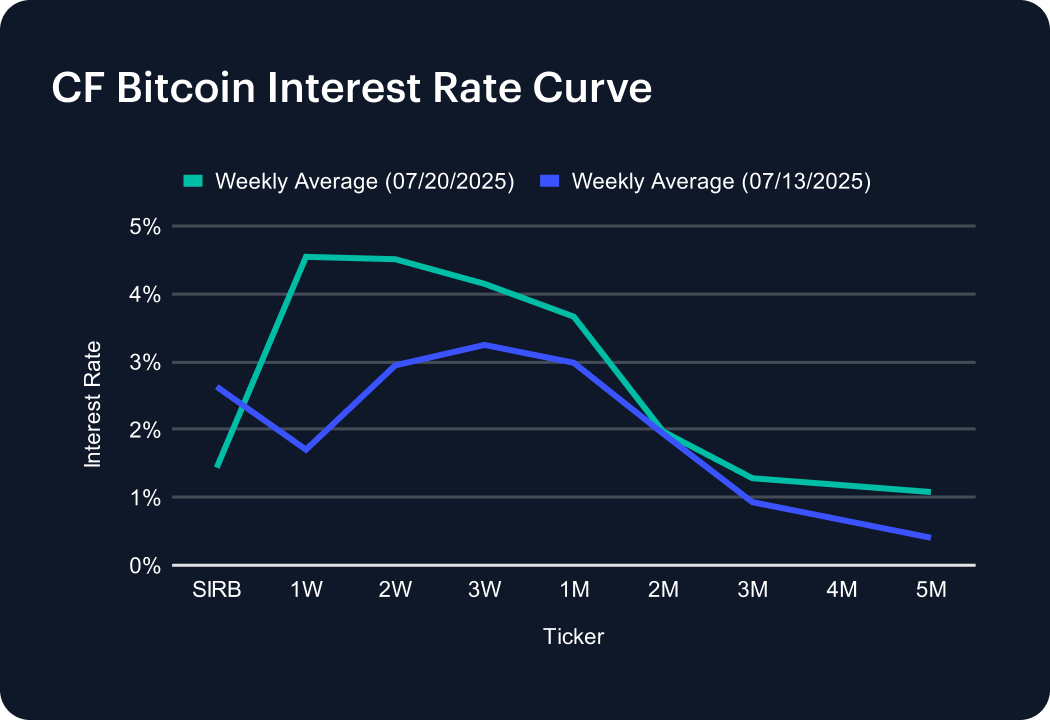
The CF Bitcoin Interest Rate Curve shifted sharply lower at its anchor even as short- and longer-dated tenors jumped. The Short-Term Interest Rate Benchmark plunged from 2.63% to 1.44%, unwinding 119 basis points. By contrast, 1-week funding soared 285 bps to 4.55%, with 2- and 3-week tenors up 156 bps and 90 bps to 4.51% and 4.15%. One-month rates climbed 68 bps to 3.66%, while 2-month maturities ticked up to 1.97%. The back end also steepened: 3-month rose to 1.28%, 4-month to 1.18%, and 5-month to 1.08%. This dynamic—markedly lower policy anchor flanked by a pronounced mid-curve hump and firmer long-end premiums—reflects divergent funding demand across maturities.
The information contained within is for educational and informational purposes ONLY. It is not intended nor should it be considered an invitation or inducement to buy or sell any of the underlying instruments cited including but not limited to cryptoassets, financial instruments or any instruments that reference any index provided by CF Benchmarks Ltd. This communication is not intended to persuade or incite you to buy or sell security or securities noted within. Any commentary provided is the opinion of the author and should not be considered a personalised recommendation. Please contact your financial adviser or professional before making an investment decision.
Note: Some of the underlying instruments cited within this material may be restricted to certain customer categories in certain jurisdictions.
Changes to the Token Market Price Benchmarks Series - Market Prices – 21 July 2026
The Administrator has confirmed changes to the Token Market Price Family for the period 14 July 2026 to 21 July 2026.

CF Benchmarks
Softer CPI Reprices July Hike Risk & Lifts Digital Assets
Digital assets extended their recovery over the past week as cooler US inflation prints repriced Fed expectations; the bid was broad across the large cap indices, growth factor leadership returned, stablecoin funding repriced lower, and stress stayed isolated in names hit by token-specific news.
Mark Pilipczuk
Notice of the Demising of CF Dai-Dollar Settlement Price and Spot Rate
The Administrator announces that it will demise the CF Dai-Dollar Settlement Price (DAIUSD_RR) and CF Dai-Dollar Spot Rate (DAIUSD_RTI) which are members of the CF Digital Asset Index Family.
CF Benchmarks
By clicking Accept, you consent to CF Benchmarks's use of cookies.
Visit Cookie Settings to learn how CF Benchmarks uses cookies and to adjust your preferences.