
Jan 12, 2026
Weekly Index Highlights, January 12, 2026
Market Performance Update
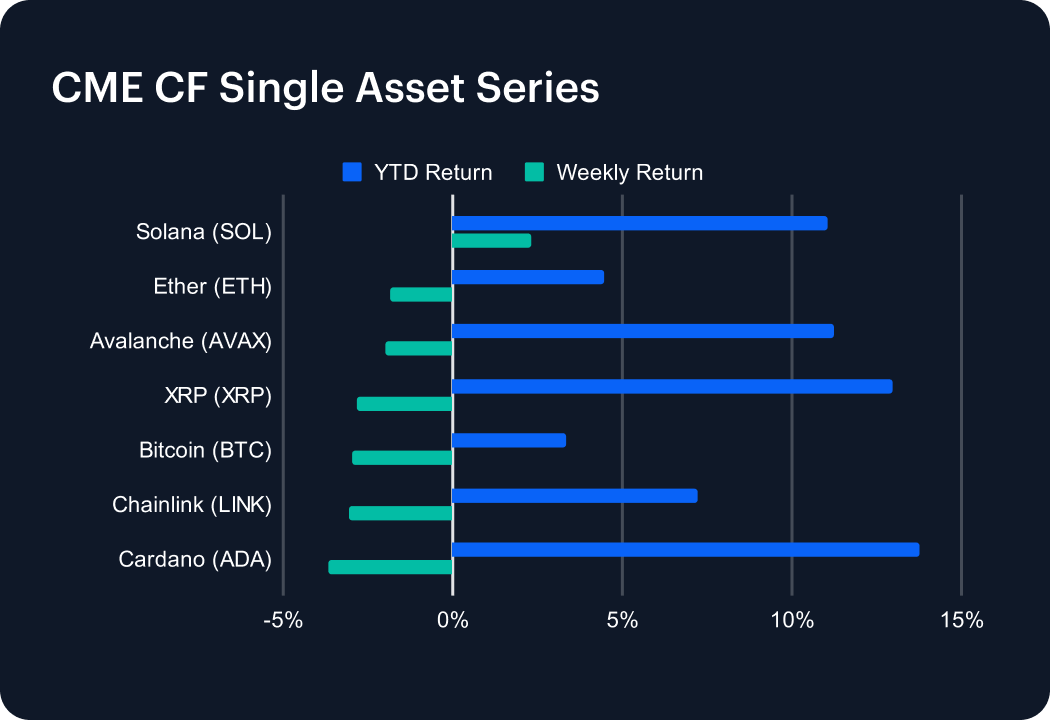
Crypto markets consolidated over the week covered by this first Weekly Index Highlights edition for 2026, after a strong opening rally of the year. Bitcoin fell -2.97% week-on-week, leaving a 3.32% tally for the year-to-date (YTD) so far. Ether also declined, -1.86%, to stand at +4.46%, YTD. Performance across the CME CF Single Asset basket ranged from Solana’s 2.29% gain to Cardano’s -3.69% decline, a 5.98 percentage point (pp) dispersion. Key assets remaining on positive ground since the opening trades of 2026 underlines the confident first-week advance in this asset class. E.g., note BTC’s December 29th, 2025, to January 4th, 2026, return of 6.49%. As such, the recent week’s pullback looks proportionate in scale rather than regime-defining. Net-net, the tape reads as early-year positioning being refined: selective risk is still being expressed, but the marginal bid softened across large-cap beta into the week’s close.
Sector Analysis
Sector leadership was unusually bifurcated in the CF DACS Category data. Infrastructure was the clear outperformer at 4.18% w/w, while Programmable was close to flat (-0.62%) and Non‑Programmable declined -2.35%. On the downside, Culture fell -3.93%, Utility dropped -3.41%, and Finance eased -3.12%. Within Infrastructure, Polygon (POL) surged 33.96%, materially offsetting weakness such as HNT’s -9.85% decline. Programmable performance was more balanced: ATOM rose 11.30% while APT fell -7.12%, helping explain the near‑flat sector average. Utility similarly contained both winners and losers, with GRT up 4.69% but BICO down -8.49%. Culture’s softness was broad-based despite pockets of strength — CHZ gained 7.70% — as laggards like BAT fell -12.46%. Finance also skewed lower, with AMP up 3.30% but ONDO down -8.74%. Taken together, the cross-sector spread from Infrastructure’s 4.18% to Culture’s -3.93% amounted to 8.11 pp. Notionally, that’s consistent with investors rewarding scaling and platform infrastructure while de-emphasizing more speculative or rate-sensitive segments.
CF Staking Series
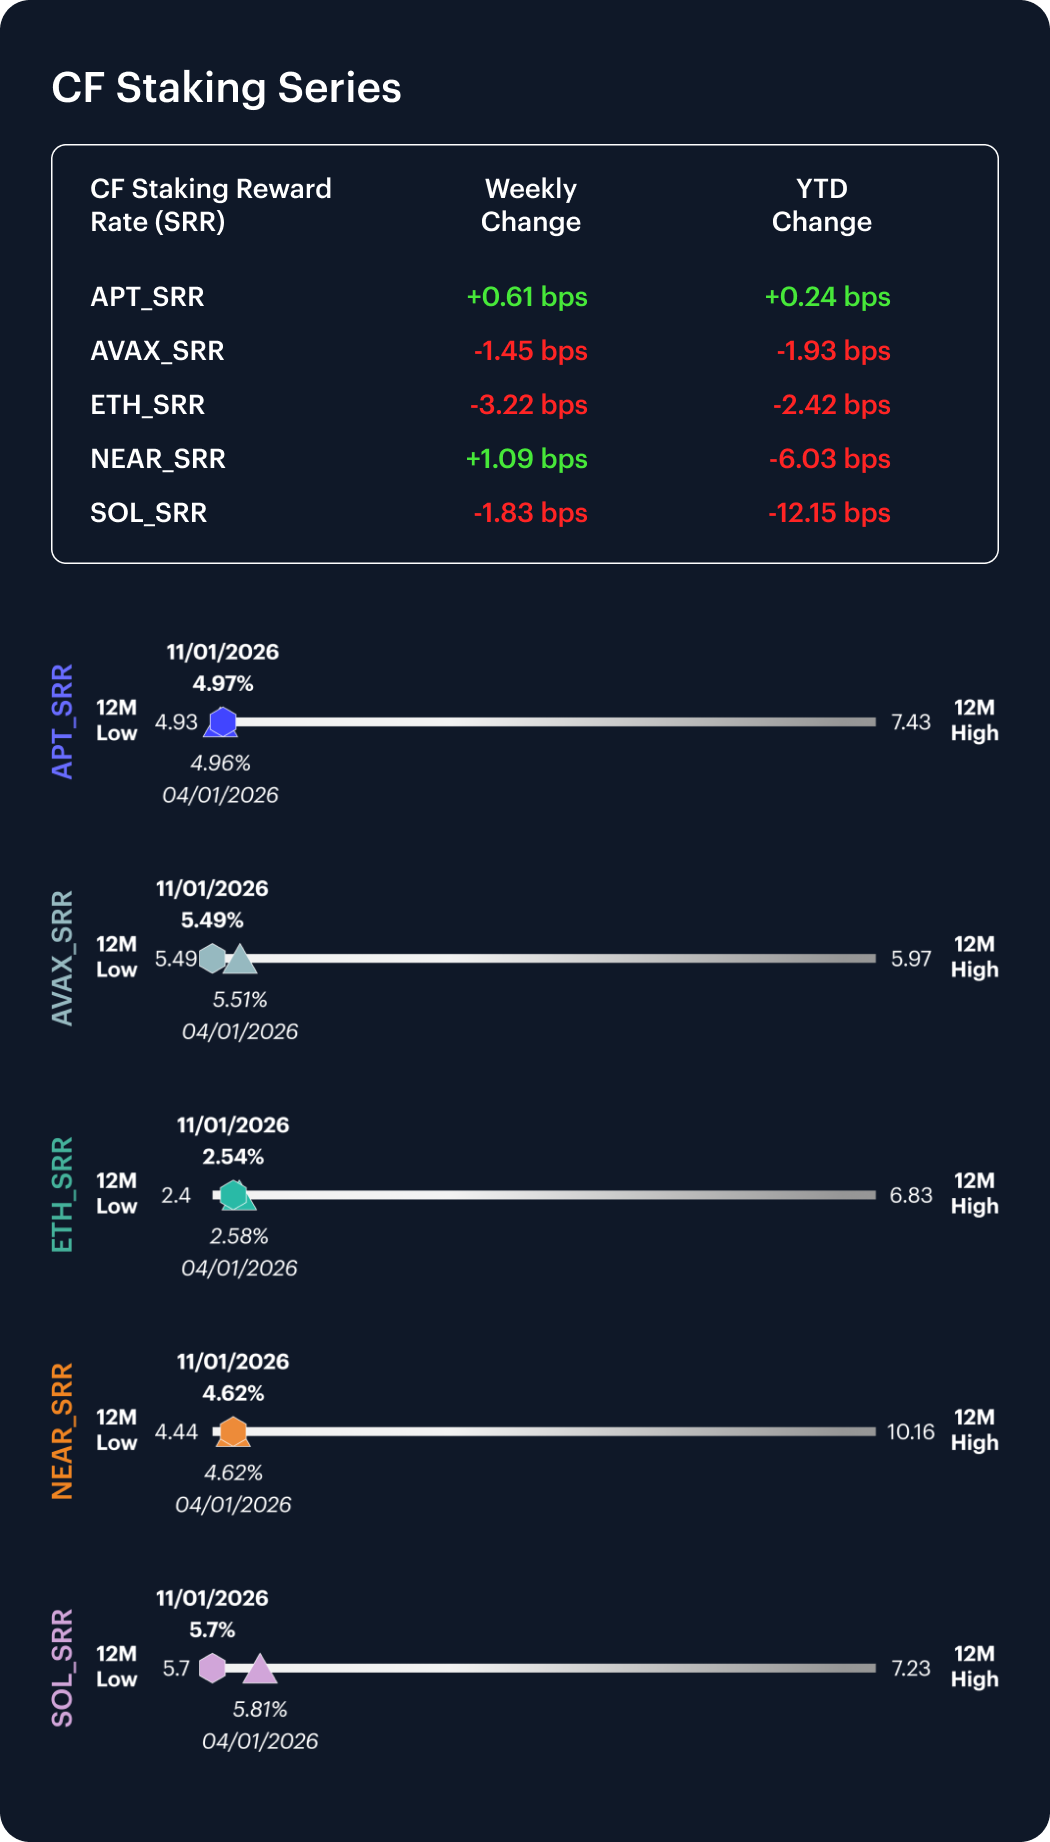
Staking indices were mixed, with small price moves accompanied by modest shifts in reward rates. APT and NEAR staking delivered positive weekly returns of 0.12% and 0.24%, while AVAX, SOL and ETH staking declined -0.26%, -0.32% and -1.25%. Naturally, their respective intra-week reward-rate changes were correspondingly contained: APT and NEAR rose 0.61 bps and 1.09 bps, while AVAX, SOL and ETH fell -1.45 bps, -1.83 bps and -3.22 bps. On a YTD basis, reward rates have moved most in SOL (−12.15 bps) and NEAR (−6.03 bps), but the most recent week did not show stress‑type repricing. Overall, staking conditions remained orderly, with basis‑point changes far smaller than the underlying spot-return swings observed across majors into week-end levels.
Market Cap Index Performance
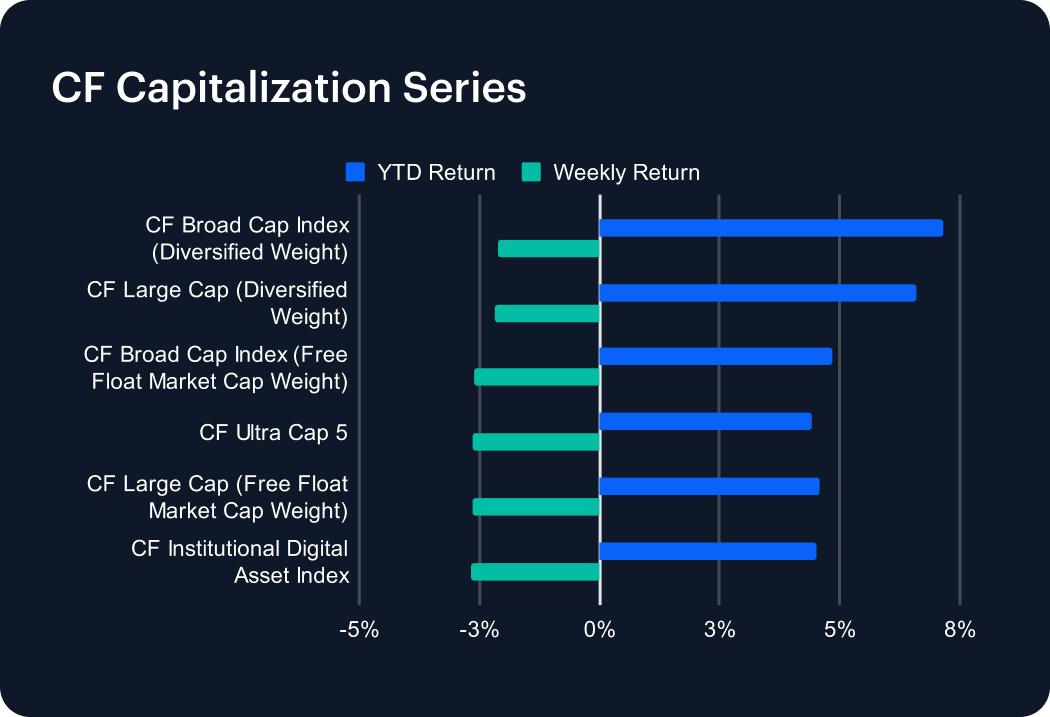
The performance of our market-cap tier indices was tightly clustered, reinforcing the view that this week’s move was primarily a broad beta reset. The CF Broad Cap Index (Diversified Weight) declined -2.13% w/w (YTD 7.15%), while the CF Large Cap (Diversified Weight) fell -2.18% (YTD 6.61%). Free‑float, market‑cap‑weighted variants were incrementally weaker: the CF Broad Cap Index (Free Float Market Cap Weight) and CF Large Cap (Free Float Market Cap Weight) dropped -2.61% and -2.64%, respectively. The CF Ultra Cap 5 and CF Institutional Digital Asset Index posted similar declines of -2.64% and -2.67%. The spread between the best and worst of these cap benchmarks was only 0.54 pp, underscoring limited dispersion by size tier. With YTD returns still positive across the set (4.40%–7.15%), for now, these data align with consolidation of the opening-2026 gains, rather than a continuation of the recent downtrend. Put differently, the capitalization complex simply traded within a 0.54 pp range in the most recent week.
Classification Series Analysis
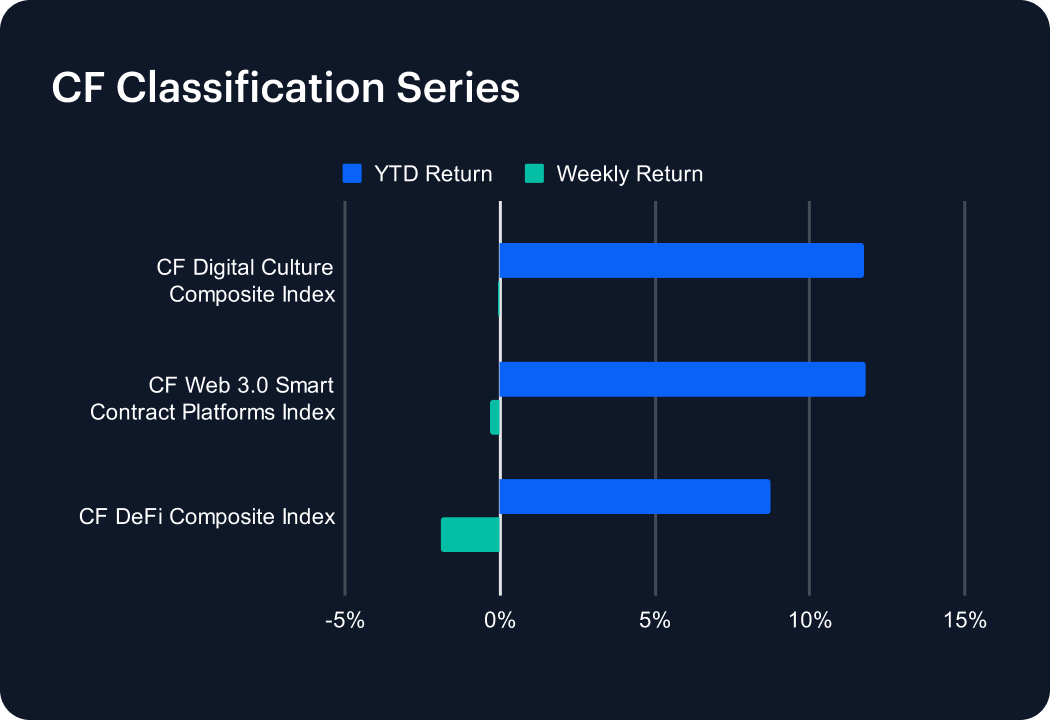
Across the CF Classification Series, relative performance was defensive. The CF Digital Culture Composite Index was essentially unchanged at -0.06% w/w (YTD 11.74%), while the CF Web 3.0 Smart Contract Platforms Index slipped -0.33% (YTD 11.80%). DeFi lagged more visibly, with the CF DeFi Composite Index down -1.89% (YTD 8.75%). That left DeFi underperforming Culture by 1.82 pp over the week, and Web3 by 1.56 pp. On a YTD basis, DeFi’s 8.75% return also trailed Web3’s 11.80% by 3.05 pp, indicating that the relative gap opened early rather than only in this pullback. With all three indices still positive YTD (8.75%–11.80%), the week’s pattern reads as a rotation within a constructive early‑year backdrop rather than a reversal of the January trend. In practice, the data suggest that investors trimmed exposure to DeFi beta first, while keeping thematic Culture and core platform exposure comparatively steadier.
Volatility Analysis
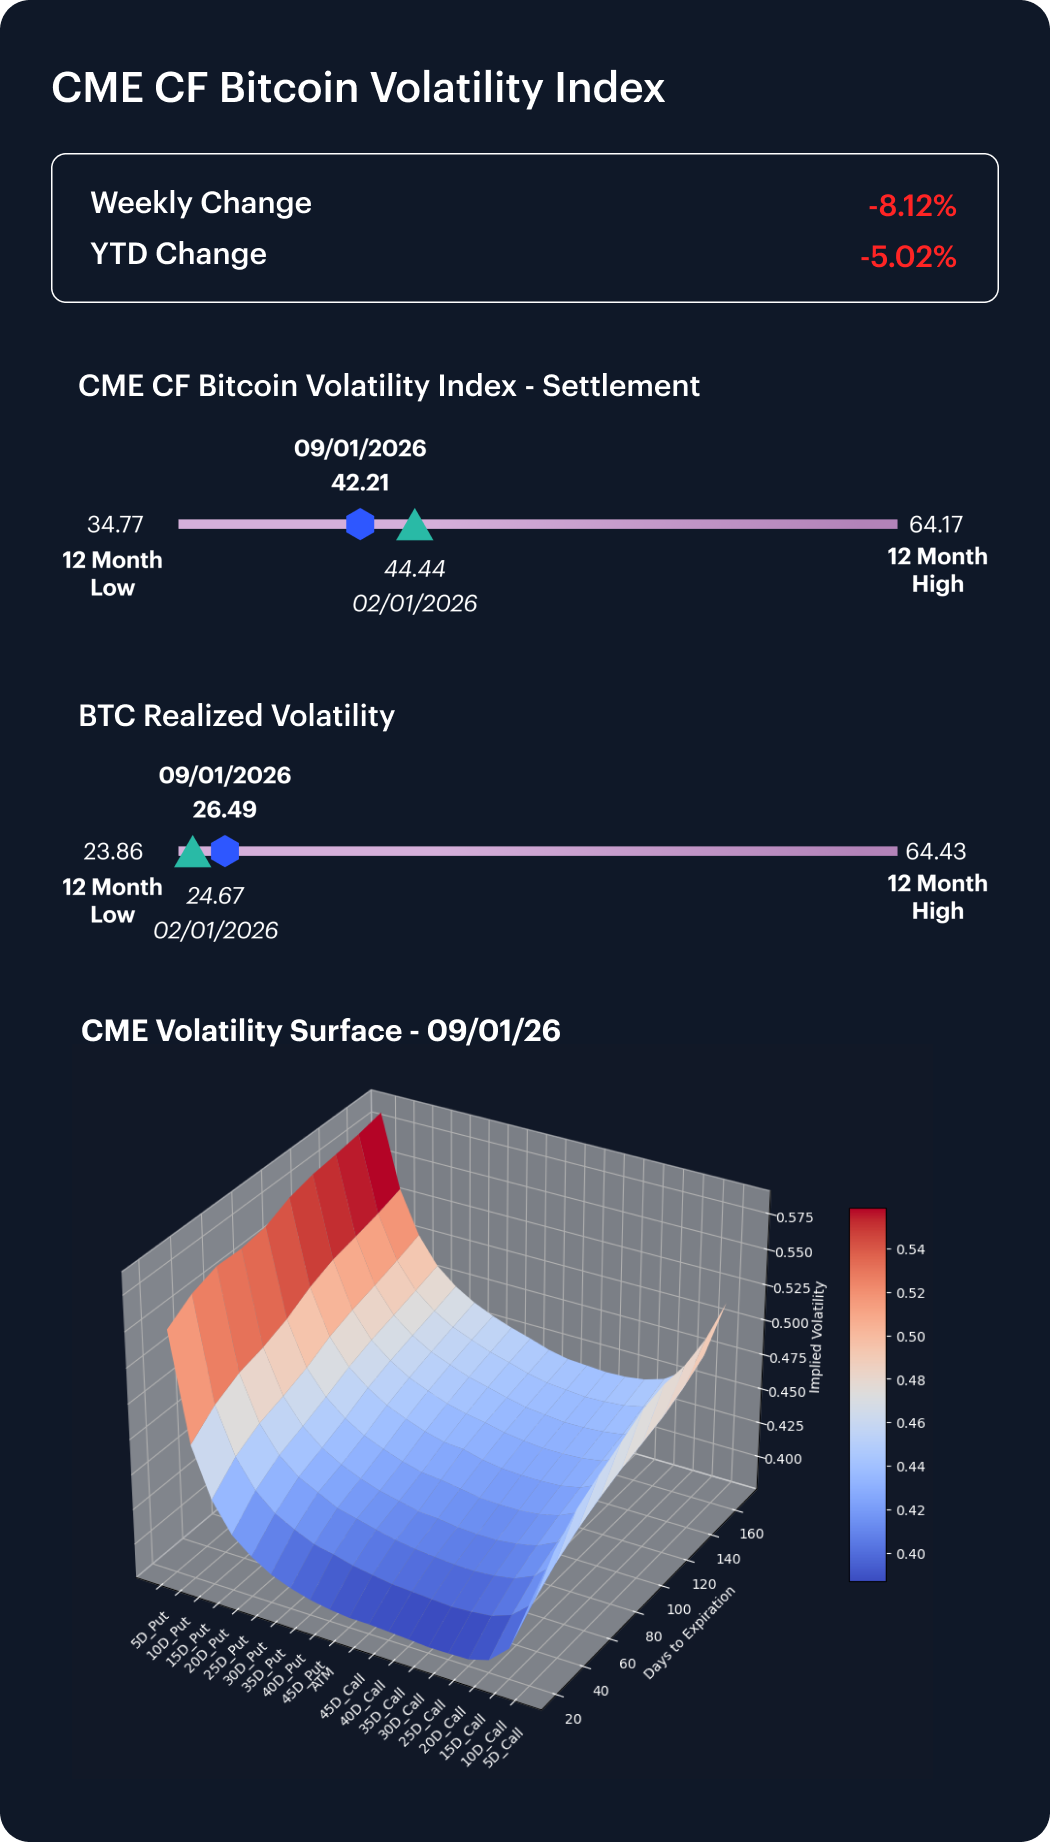
Bitcoin volatility eased even as realized prints ticked higher. The CME CF Bitcoin Volatility Index – Settlement (BVXS) fell from 45.94 to 42.21 over the week, a -3.73 point move (−8.12%). On a one‑week lookback basis, BVX also declined from 44.44 (January 2nd) to 42.21 (January 9th), a −5.02% move. By contrast, BTC realized volatility rose from 25.61 to 26.49, an increase of 0.88 vol points (and 1.82 points above the January 2nd reading of 24.67). BVX remains well inside its trailing 12‑month range (low 34.77, high 64.17) and now sits 7.44 points above the low. The gap between implied and realized volatility is still meaningful — BVX ended at 42.21 versus realized at 26.49, a 15.72 vol‑point spread — but the week’s direction indicates implied risk premia compressing rather than expanding. Overall, option pricing softened as spot consolidated, consistent with a market that absorbed this week’s -2.97% BTC decline without a commensurate repricing of forward uncertainty.
Interest Rate Analysis
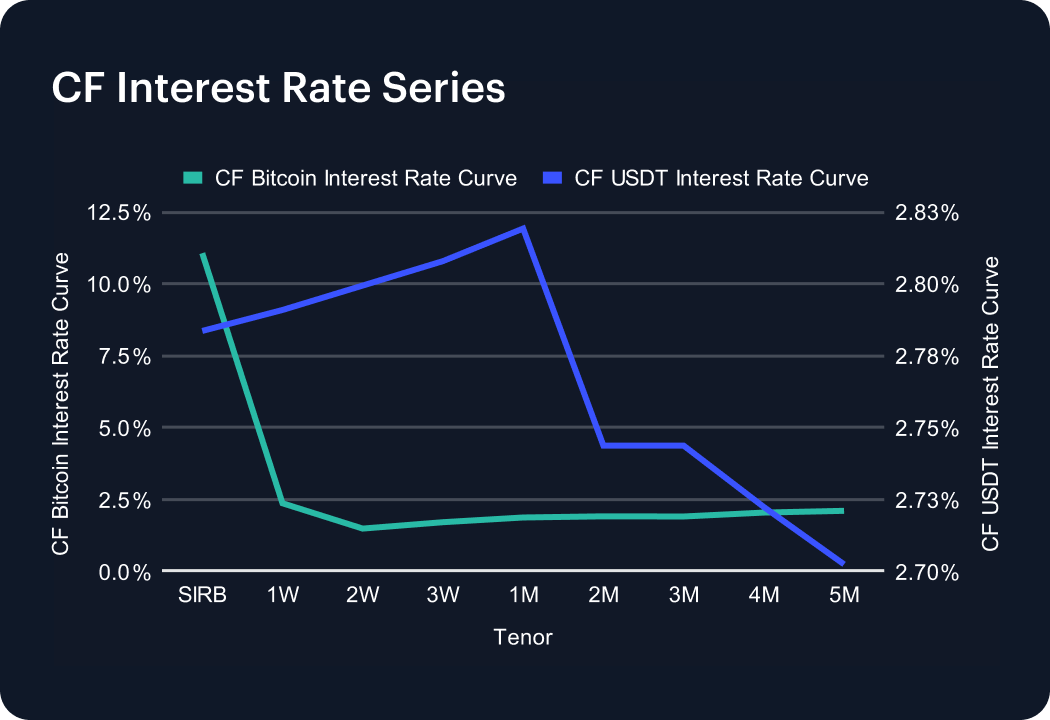
Funding conditions across the CF BIRC curves have shifted materially since the last published edition (December 21st), with stablecoin funding easing sharply and BTC rates moving higher. The CF USDT Interest Rate Curve has repriced from 10.43% at SIRB (and 10.44% at 1W) to 2.78% and 2.79%, respectively — a ~765 bps compression across the front end. The curve is now comparatively flat at roughly 2.70%–2.82% from 1W through 5M. By contrast, the CF Bitcoin Interest Rate Curve rose, led by the overnight segment: SIRB has increased to 11.07% (+735 bps). Term rates also lifted, with 1W up 75 bps to 2.35% and 5M up 194 bps to 2.09%. All in, the cross‑curve divergence since late December (USDT down ~765 bps vs BTC up ~735 bps at SIRB) indicates materially looser stablecoin funding alongside tighter overnight BTC borrowing conditions. BTC remains modestly upward‑sloping beyond 2W, with 2W at 1.47% and 5M at 2.09% (+0.62 pp).
Factors Analysis
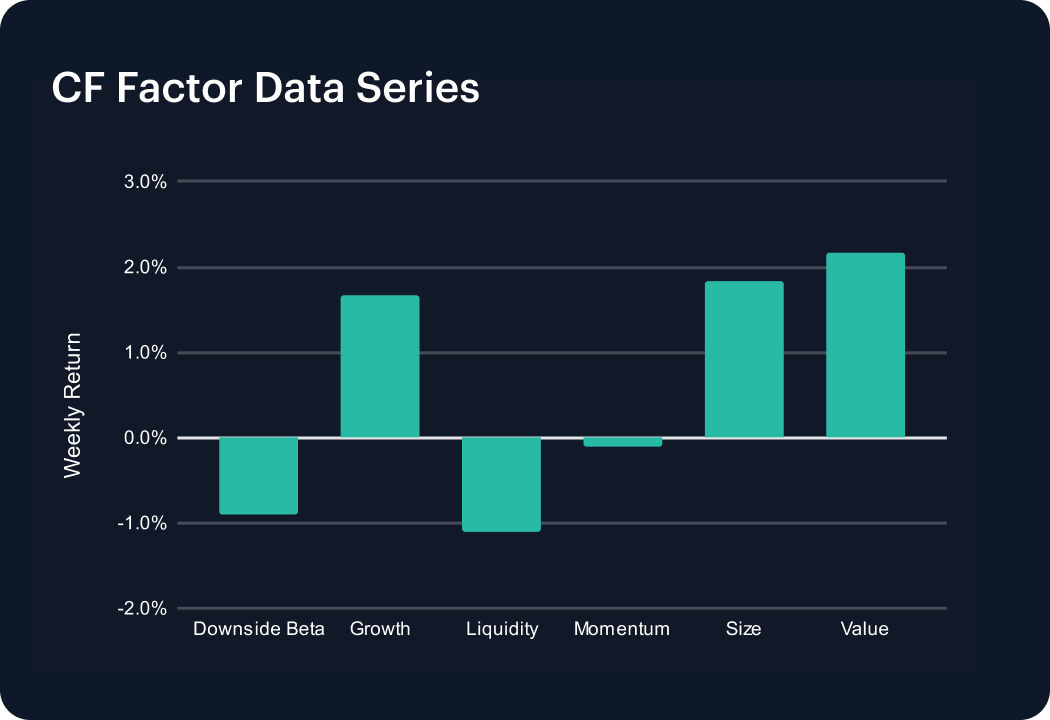
Factor returns rotated toward value and size exposures despite a softer headline tape. Over the week, the Value factor returned 2.17% and Size delivered 1.83%, the two strongest readings in the factor set. Growth was also positive at 1.66%, while Liquidity and Downside Beta were negative at -1.11% and -0.91%. Momentum was modestly lower at -0.11%. The spread between the best (Value, 2.17%) and worst (Liquidity, -1.11%) factors was 3.28 pp, indicating that cross‑sectional positioning mattered even as broad indices fell. In practical terms, the pattern suggests investors favored cheaper and smaller profiles while avoiding liquidity‑heavy exposures, a configuration that can occur when market participants look for idiosyncratic rebound potential after a rapid start‑of‑year advance. The combination of negative Downside Beta (-0.91%) and positive Value/Size implies that the week’s drawdown was not driven by a uniform high‑beta liquidation in aggregate.
The information contained within is for educational and informational purposes ONLY. It is not intended nor should it be considered an invitation or inducement to buy or sell any of the underlying instruments cited including but not limited to cryptoassets, financial instruments or any instruments that reference any index provided by CF Benchmarks Ltd. This communication is not intended to persuade or incite you to buy or sell security or securities noted within. Any commentary provided is the opinion of the author and should not be considered a personalised recommendation. Please contact your financial adviser or professional before making an investment decision.
Note: Some of the underlying instruments cited within this material may be restricted to certain customer categories in certain jurisdictions.
Factor Friday - July 17, 2026
The market rally slowed to +1.66% in its third week as leadership rotated toward quality: Value led at +0.93% and defensives rebounded, while last week's liquidity bid unwound in full to -1.82%. Growth remains July's weakest factor despite climbing off the weekly low.

Mark Pilipczuk
Changes to the Token Market Price Benchmarks Series - Market Prices – 14 July 2026
Changes to the Token Market Price Benchmarks Series - Market Prices – 14 July 2026
CF Benchmarks
Bitcoin ETF Outflow Streak Ends as BVX Falls to a 12-Month Low
Digital assets traded mixed over the week: ETF inflows returned and the mega caps carried our headline indices, while high-beta names and diversified breadth lagged. DeFi led the themes, meme coins absorbed a governance attack, implied volatility kept compressing.
Gabriel Selby
By clicking Accept, you consent to CF Benchmarks's use of cookies.
Visit Cookie Settings to learn how CF Benchmarks uses cookies and to adjust your preferences.