
Feb 09, 2026
Weekly Index Highlights, February 9, 2026
Market Performance Update
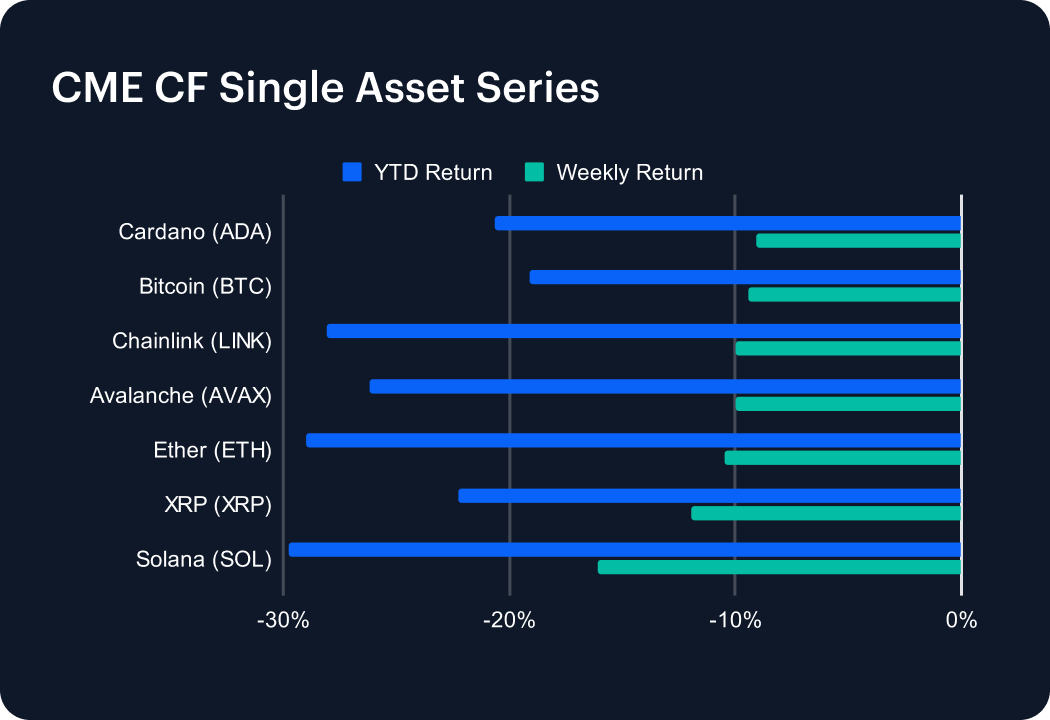
Digital assets extended their drawdown during the most recently completed week, with large caps sliding in tandem before staging a volatile rebound – though that bounce occurred well outside the weekly window covered by this edition. Bitcoin (BTC) fell -9.4% week-on-week (w/w) extending its year-to-date (YTD) loss to -19.1%, while Ether (ETH) declined -10.5% w/w (YTD -29.0%). Among higher-beta majors, Cardano (ADA) and Chainlink (LINK) dropped -9.1% and -10.0%, while Solana (SOL) relatively underperformed at -16.1%. With weekly moves spanning roughly -16.1% to -9.1% across this set, the tape points to an additional episode of broad risk reduction. YTD, the CME CF Single Asset complex remains meaningfully underwater, with bellwether BTC at -19.1%, ETH at -29.0%, and higher-beta majors negative to a similar degree, e.g., SOL -29.7%. Notably, the weekly gap between BTC (-9.4%) and SOL (-16.1%) was about 6.7 pp. This highlights that drawdowns remained convex with respect to beta. Given the lack of a clear decoupling between majors, the week reads like a further phase of macro-style deleveraging, with correlations elevated, leadership limited to small pockets, and little sign of a durable rotation.
Volatility Analysis
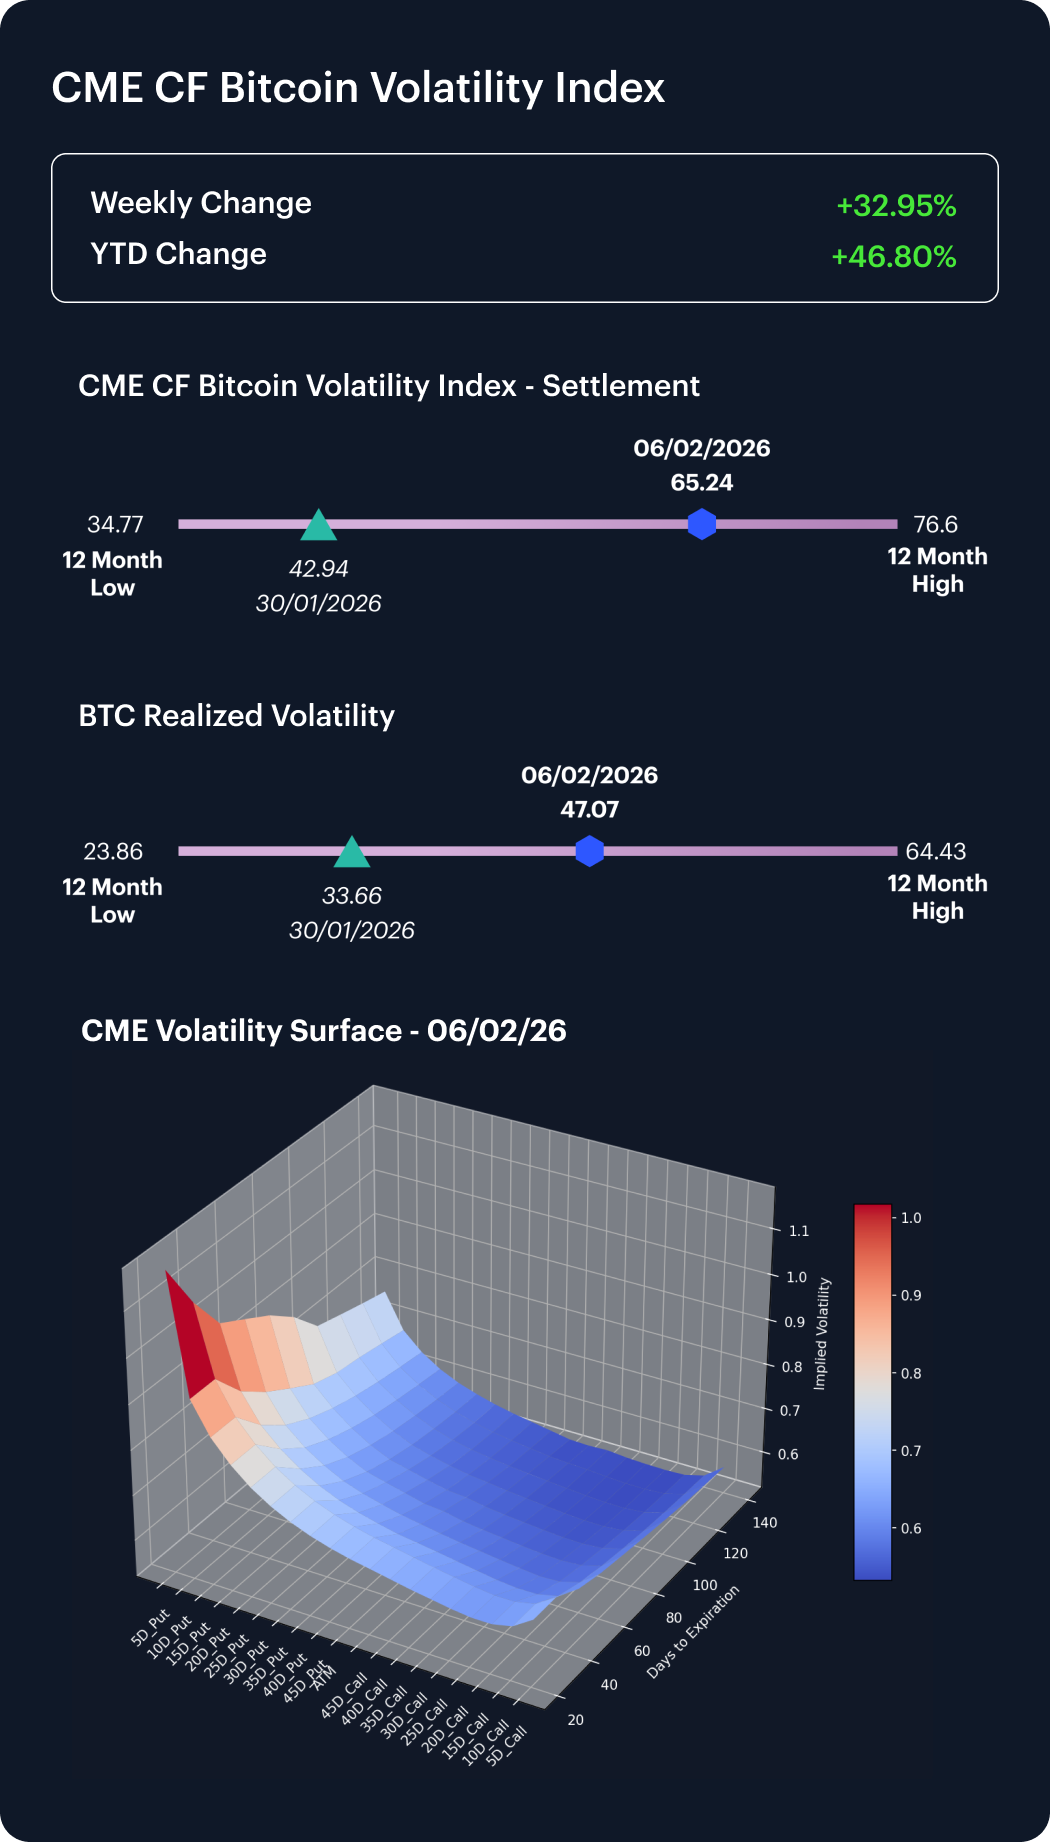
Our CME CF Bitcoin Volatility Index - Settlement (BVXS) ascended from 49.1 to 65.2 during the week, even as realized volatility shifted lower from 50.3 to 47.1. With implied at 65.2 versus realized at 47.1, implied vol. was still meaningfully above realized, and the implied–realized spread widened into positive territory (by roughly 18.1 vol. points). The configuration looks consistent with a market that was still willing to pay up for convexity and protection – in fact more so, at that point – despite realized vol. failing to follow through higher, suggesting that options demand stayed elevated relative to spot turbulence. Put differently, the options surface appears to have repriced more aggressively than the realized tape, leaving implied vol. “rich” versus realized, and signaling continued and even moderately rising caution, on top of that week’s already-large spot drawdown.
Market Cap Index Performance
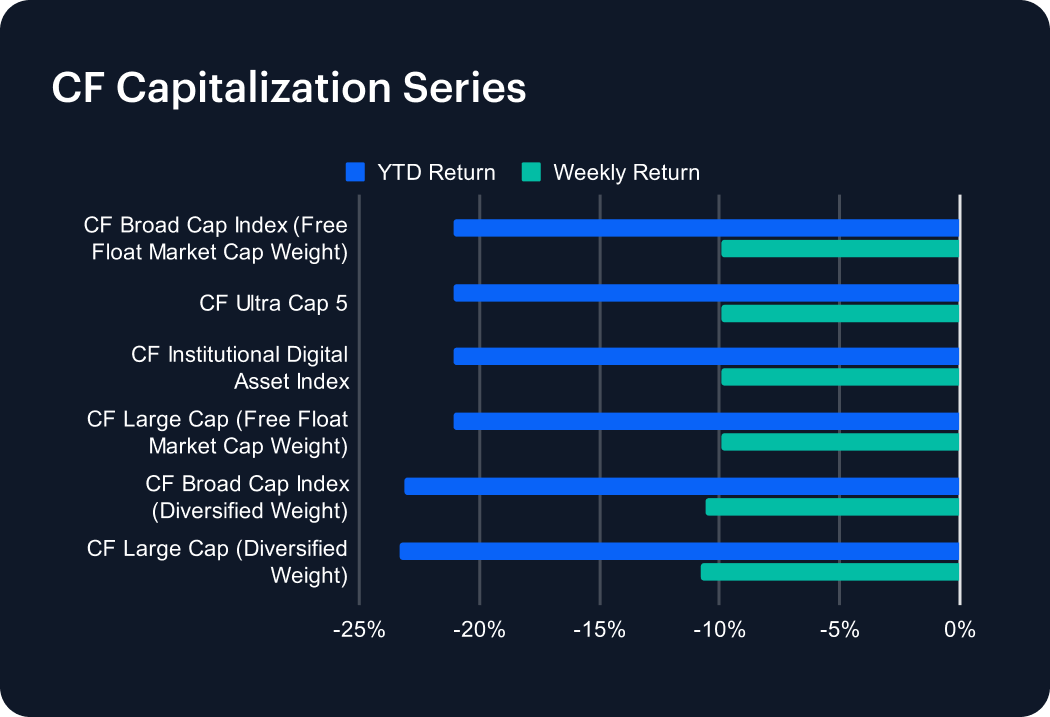
The CF Capitalization indices moved largely in lockstep over the week, underscoring a tier-agnostic de-risking phase. The CF Broad Cap Index (Free Float Market Cap Weight) returned -9.90% w/w (YTD -21.10%), matching the CF Ultra Cap 5 at -9.91% (YTD -21.06%) and the CF Large Cap (Free Float Market Cap Weight) at -9.92% (YTD -21.10%). The CF Institutional Digital Asset Index also fell approximately -9.92% w/w (YTD -21.07%), reinforcing the message that the selloff was broad and highly correlated across core benchmarks. Diversified-weight indices were marginally weaker: the CF Broad Cap Index (Diversified Weight) declined -10.62% w/w (YTD -23.10%) and the CF Large Cap (Diversified Weight) fell -10.75% (YTD -23.31%). The small but consistent underperformance of diversified-weight variants could be a tell-tale signal that the market’s “long tail” continued to bear a slightly heavier burden, even as headline beta was transmitted cleanly through the cap stack.
Factors Analysis
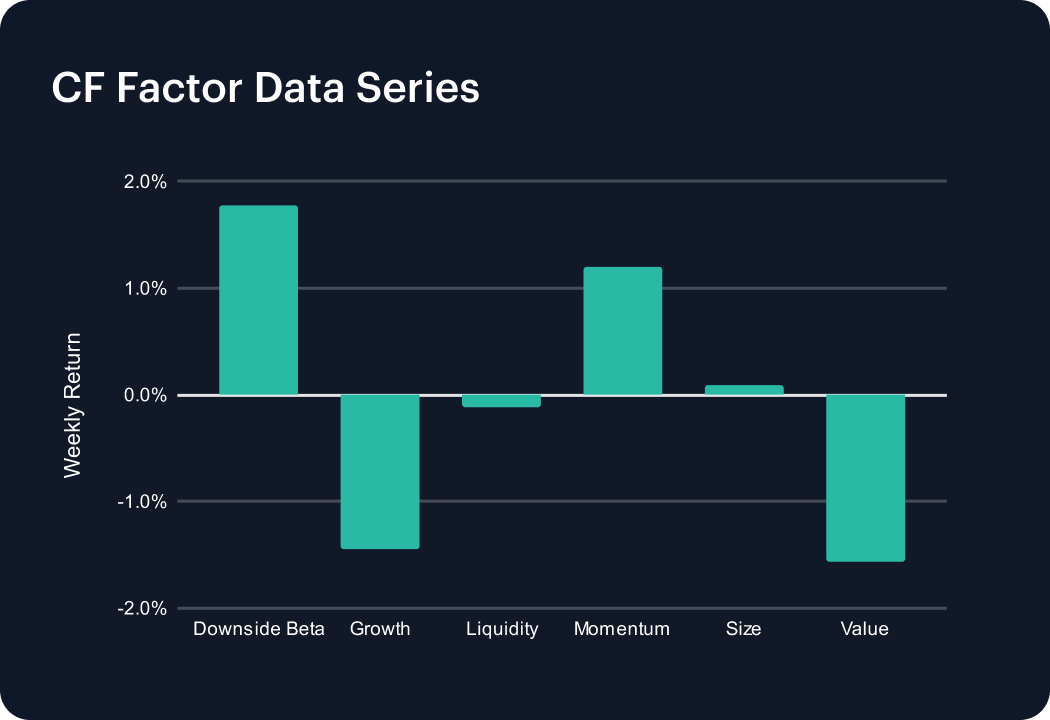
Factor returns rotated meaningfully over the week, with leadership shifting toward defensive beta and trend, while liquidity and smaller names cheapened. Downside Beta strengthened from +0.36% to +1.77% (a +1.41 pp swing), and Momentum improved from +0.10% to +1.21% (+1.11 pp), consistent with investors rewarding downside-aware exposures and recent price leadership. By contrast, Growth flipped from +0.14% to -1.45% (-1.59 pp), while Liquidity fell from +0.84% to -0.12% (-0.96 pp), signaling a more cautious market structure as conditions tightened at the margin. Size also rebounded, moving from -1.03% to +0.09% (+1.12 pp), though the pretty much level finish suggests only mild small-name support rather than a broad small-cap bid. Value remained negative, slipping from -1.00% to -1.56% (-0.56 pp). Overall, the factor tape displays a defensive, trend-following rotation, possibly financed by reduced liquidity preference, and a pronounced de-rating in growth exposures.
Classification Series Analysis
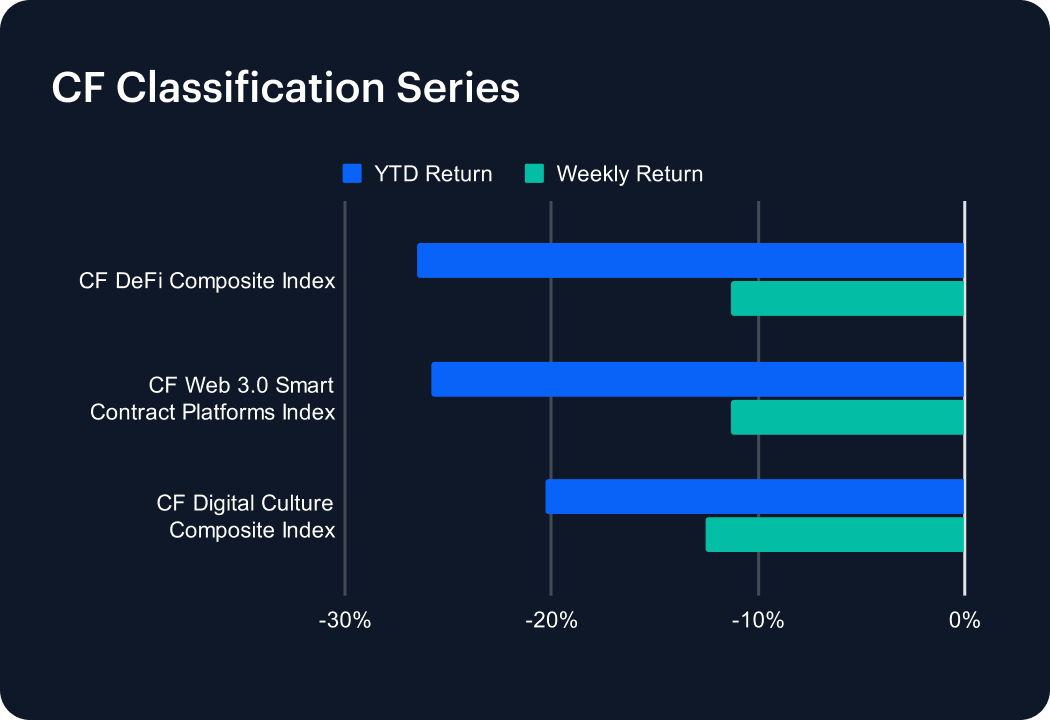
Performance was also weak across the CF Classification Series, with CF DeFi Composite Index and CF Web 3.0 Smart Contract Platforms Index both down -11.3% w/w, while the CF Digital Culture Composite Index underperformed at -12.6% w/w. On a YTD basis, however, the ordering differs: Culture sits at -20.3%, compared with DeFi at -26.5% and Web 3.0 at -25.8%, implying that despite being the weekly laggard, Culture has exhibited some relative resilience year-to-date versus the other thematic sleeves. Relative to the prior week’s sharp drawdowns (Culture -17.85%, DeFi -18.62%, Web 3.0 -19.20%), the latest week represents a clear moderation in downside intensity: weekly losses improved by roughly +5.25 pp (Culture), +7.32 pp (DeFi) and +7.90 pp (Web 3.0). Even so, with all themes still printing double-digit weekly declines, the configuration reads like a continued de-risking regime, even if the pace of that de-risking might be slowing.
Sector Analysis
Sector performance remained broadly risk-off over the week, but with meaningful dispersion across CF DACS groupings. At the sector level, Non-Programmable Settlement was comparatively resilient at -8.40% (BCH -0.8%, XBT -9.4%, LTC -9.1%), while Culture was the weakest sleeve at -11.95%, led lower by Gaming (PRIME -13.0%, IMX -13.6%, GALA -14.2%) and broad softness across Meme Coins (PEPE -11.2%, WIF -11.2%, BONK -13.0%). Elsewhere, Finance averaged -10.88%, with isolated offsets (YFI +6.1%, AMP +1.85%) unable to counter heavy weakness across Trading and related categories (BAL -26.1%, SUSHI -14.5%, UNI -11.0%). In Services, Utility and Infrastructure printed -11.55% and -11.16% respectively, with LINK -10.0% and GRT -9.12% contrasting with deeper drawdowns in ENS -14.23% and higher-beta infrastructure exposures such as OP -17.3% and HNT -17.2%. Versus the prior week’s materially steeper sector averages (Finance -17.31%, Culture -20.70%, Utility -20.40%), the profile is best read as a moderation in downside intensity with little sign of rotation into outright strength for now.
CF Staking Series
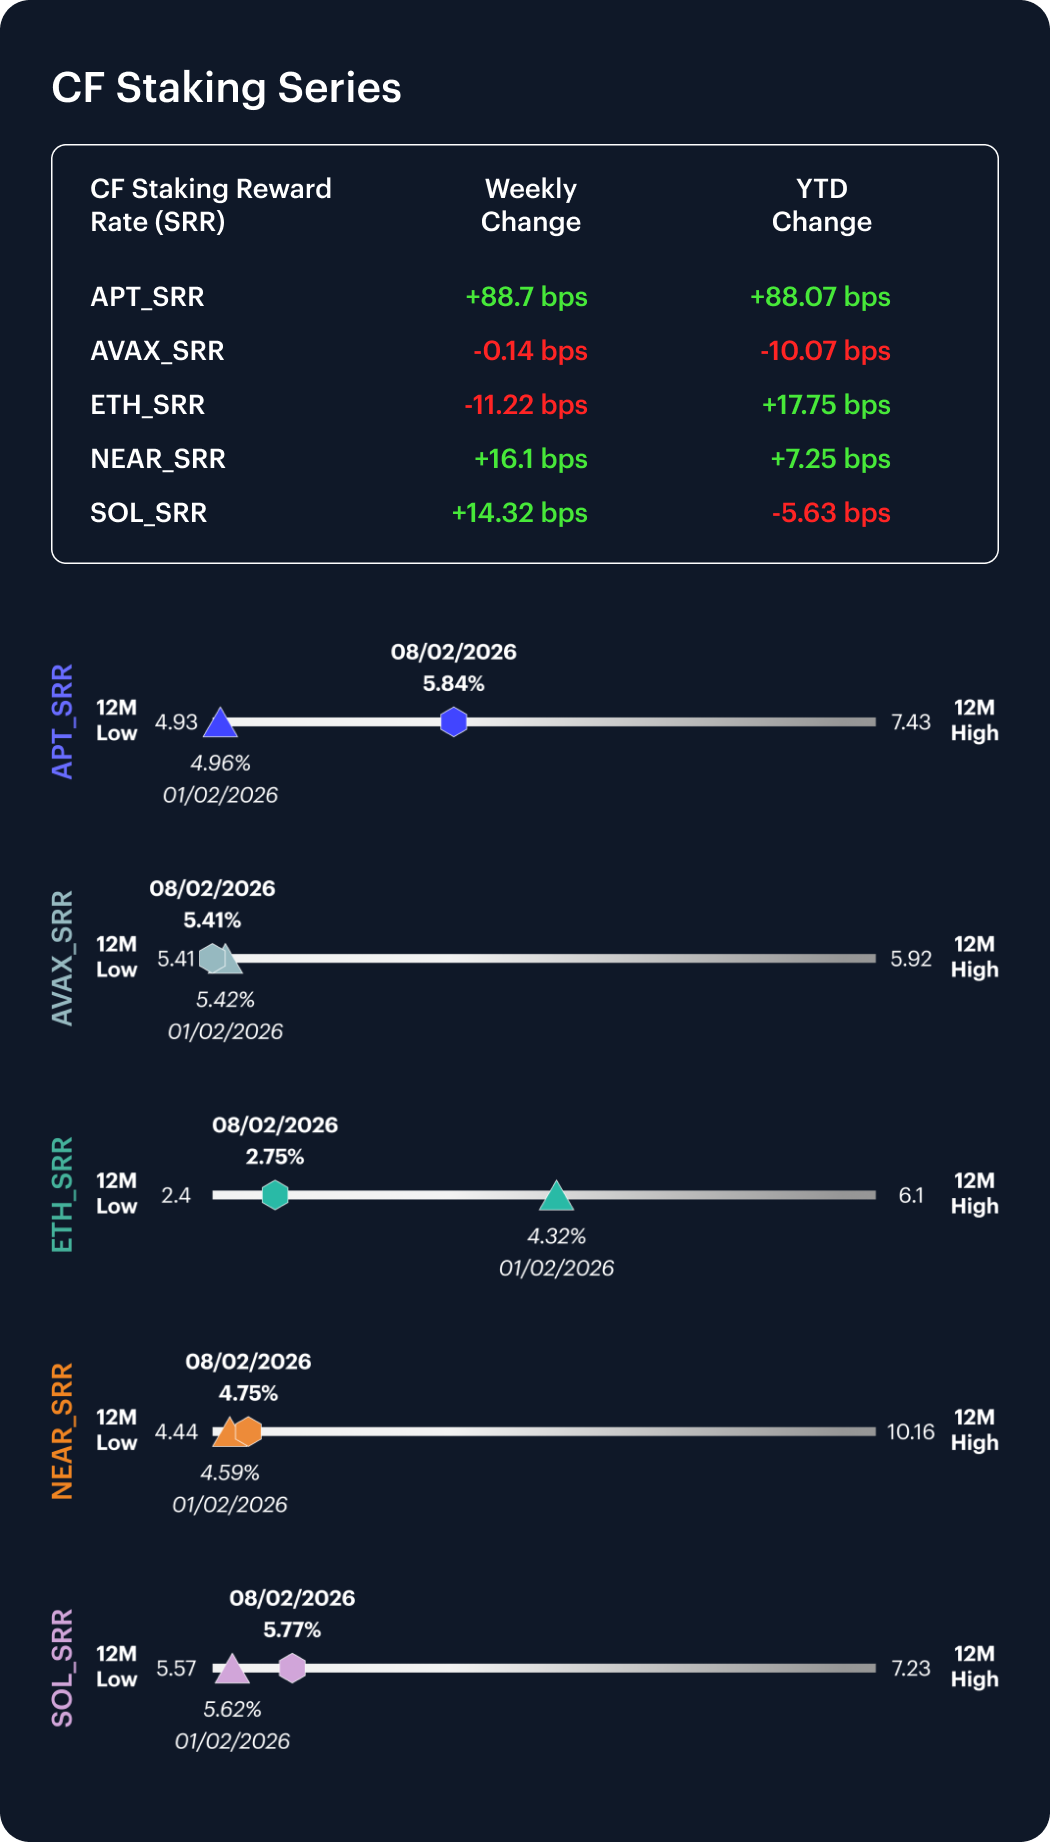
Within the CF Staking Series, APT returned +17.90% w/w as its reward rate moved +88.7 bps, while AVAX returned -0.03% w/w, as its reward rate nudging down -0.14 bps over the same window. ETH staking fell -3.93% w/w equating to a reward rate shift of -11.22 bps, with NEAR staking and SOL staking returning +3.51% and +2.55% w/w as their reward rates moved +16.1 bps and +14.32 bps respectively. Taken together, reward-rate moves spanned -11.22 bps to +88.7 bps, with the sharpest repricing concentrated in APT, while the rest of the complex saw more incremental adjustments. Relative to the prior week, the regime also looks notably calmer in ETH: last week’s +173.38 bps weekly reward-rate jump for a +67.09% return were followed by a reversal to -11.22 bps and -3.93%, suggesting the earlier move was idiosyncratic and mean-reverting rather than the start of a sustained broad-based steepening.
Interest Rate Analysis
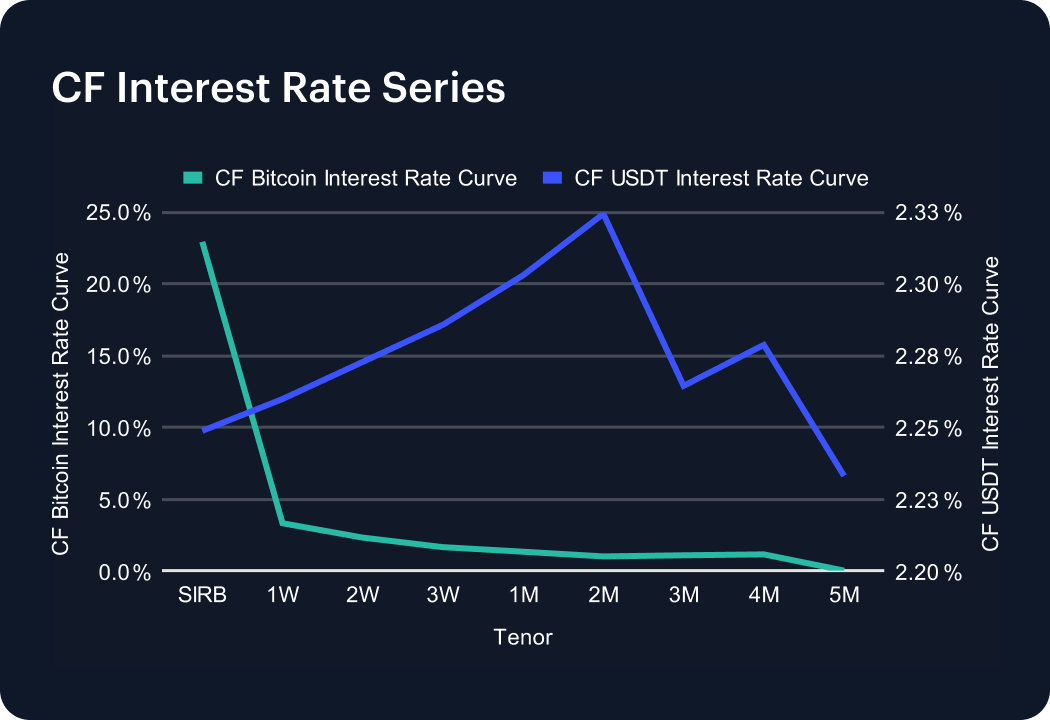
Funding conditions diverged sharply across the CF BIRC curves over the week. BTC SIRB surged from 6.09% to 22.94% (+16.85 pp), a pronounced front-end dislocation that dwarfed moves further out on the curve. Short tenors also firmed, with 1W rising from 2.05% to 3.31% (+126 bps) and 2W from 1.62% to 2.30% (+68 bps), while the belly softened modestly. 2M fell from 1.20% to 0.99% (-21 bps) and 3M from 1.32% to 1.07% (-25 bps). 5M remained at 0.00%. In contrast, USDT rates eased almost in parallel, with SIRB dropping from 2.88% to 2.25% (-63 bps) and the front-to-belly sector edging lower by roughly -61 to -68 bps (e.g., 1W moved from 2.90% to 2.26%, and 1M from 2.98% to 2.30%). The net configuration is a BTC-specific front-end spike alongside broadly easier USDT funding, consistent with a localized BTC funding premium while stablecoin funding remained largely orderly.
The information contained within is for educational and informational purposes ONLY. It is not intended nor should it be considered an invitation or inducement to buy or sell any of the underlying instruments cited including but not limited to cryptoassets, financial instruments or any instruments that reference any index provided by CF Benchmarks Ltd. This communication is not intended to persuade or incite you to buy or sell security or securities noted within. Any commentary provided is the opinion of the author and should not be considered a personalised recommendation. Please contact your financial adviser or professional before making an investment decision.
Note: Some of the underlying instruments cited within this material may be restricted to certain customer categories in certain jurisdictions.
Changes to the Token Market Price Benchmarks Series - Market Prices – 21 July 2026
The Administrator has confirmed changes to the Token Market Price Family for the period 14 July 2026 to 21 July 2026.

CF Benchmarks
Softer CPI Reprices July Hike Risk & Lifts Digital Assets
Digital assets extended their recovery over the past week as cooler US inflation prints repriced Fed expectations; the bid was broad across the large cap indices, growth factor leadership returned, stablecoin funding repriced lower, and stress stayed isolated in names hit by token-specific news.
Mark Pilipczuk
Notice of the Demising of CF Dai-Dollar Settlement Price and Spot Rate
The Administrator announces that it will demise the CF Dai-Dollar Settlement Price (DAIUSD_RR) and CF Dai-Dollar Spot Rate (DAIUSD_RTI) which are members of the CF Digital Asset Index Family.
CF Benchmarks
By clicking Accept, you consent to CF Benchmarks's use of cookies.
Visit Cookie Settings to learn how CF Benchmarks uses cookies and to adjust your preferences.