
Feb 02, 2026
Weekly Index Highlights, February 2, 2026
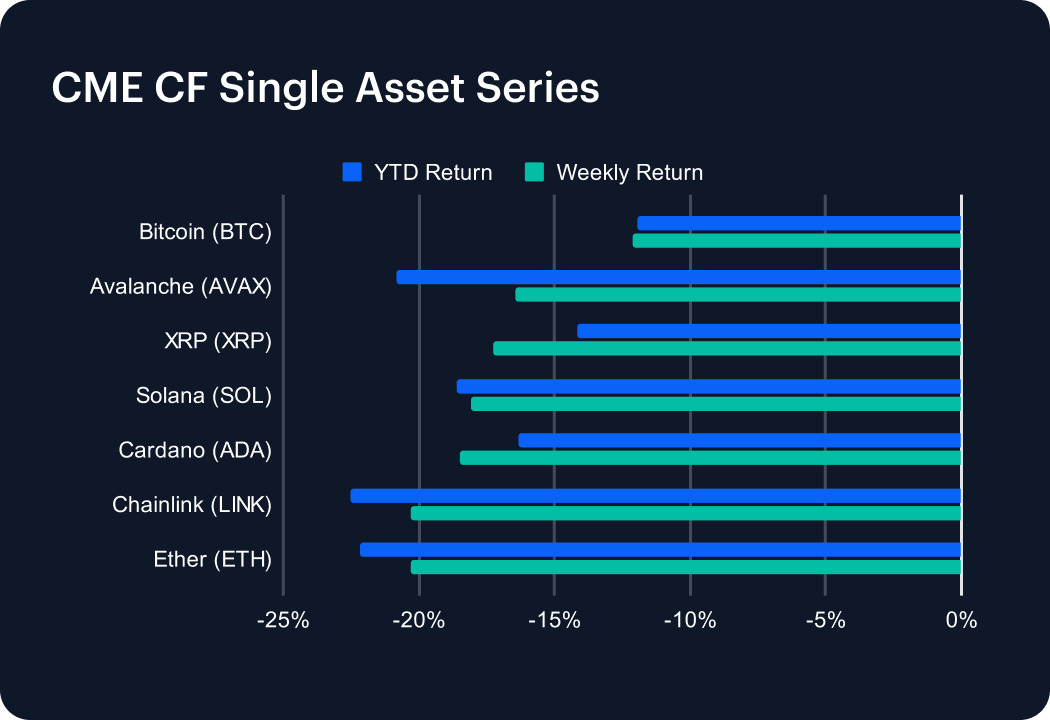
Market Performance Update
The retreat of digital assets deepened significantly over the most recently completed week, with large caps leading the renewed downturn by dropping decisively. Bitcoin fell -12.1% week-on-week (w/w), which – like for other major tokens – finally nixed its positive year-to-date (YTD) potential, marking the first time it’s been definitively lower for 2026 at -12.0%. Meanwhile, Ether tumbled -20.3% (YTD -22.2%). Declines extended across major layer-1s and large-cap alts: Solana and Cardano fell -18.1% and -18.5% (-18.06% and -16.3% YTD), while Avalanche and XRP were down -16.4% and -17.3% (-20.8% and -14.2% YTD). Chainlink (LINK) softened -20.3%, leaving it -22.5% YTD. With the single-asset set spanning -20.3% to -12.1% on the week, performance was directionally uniform, and the clustering of losses beyond -10% for every name in the basket suggests that positioning and liquidity conditions mattered as much as idiosyncratic protocol narratives. Put differently, the week’s drawdown looked like a re-pricing of broad crypto beta, with Ether’s -20.3% print acting as the clearest expression of de-risking in higher-duration exposure.
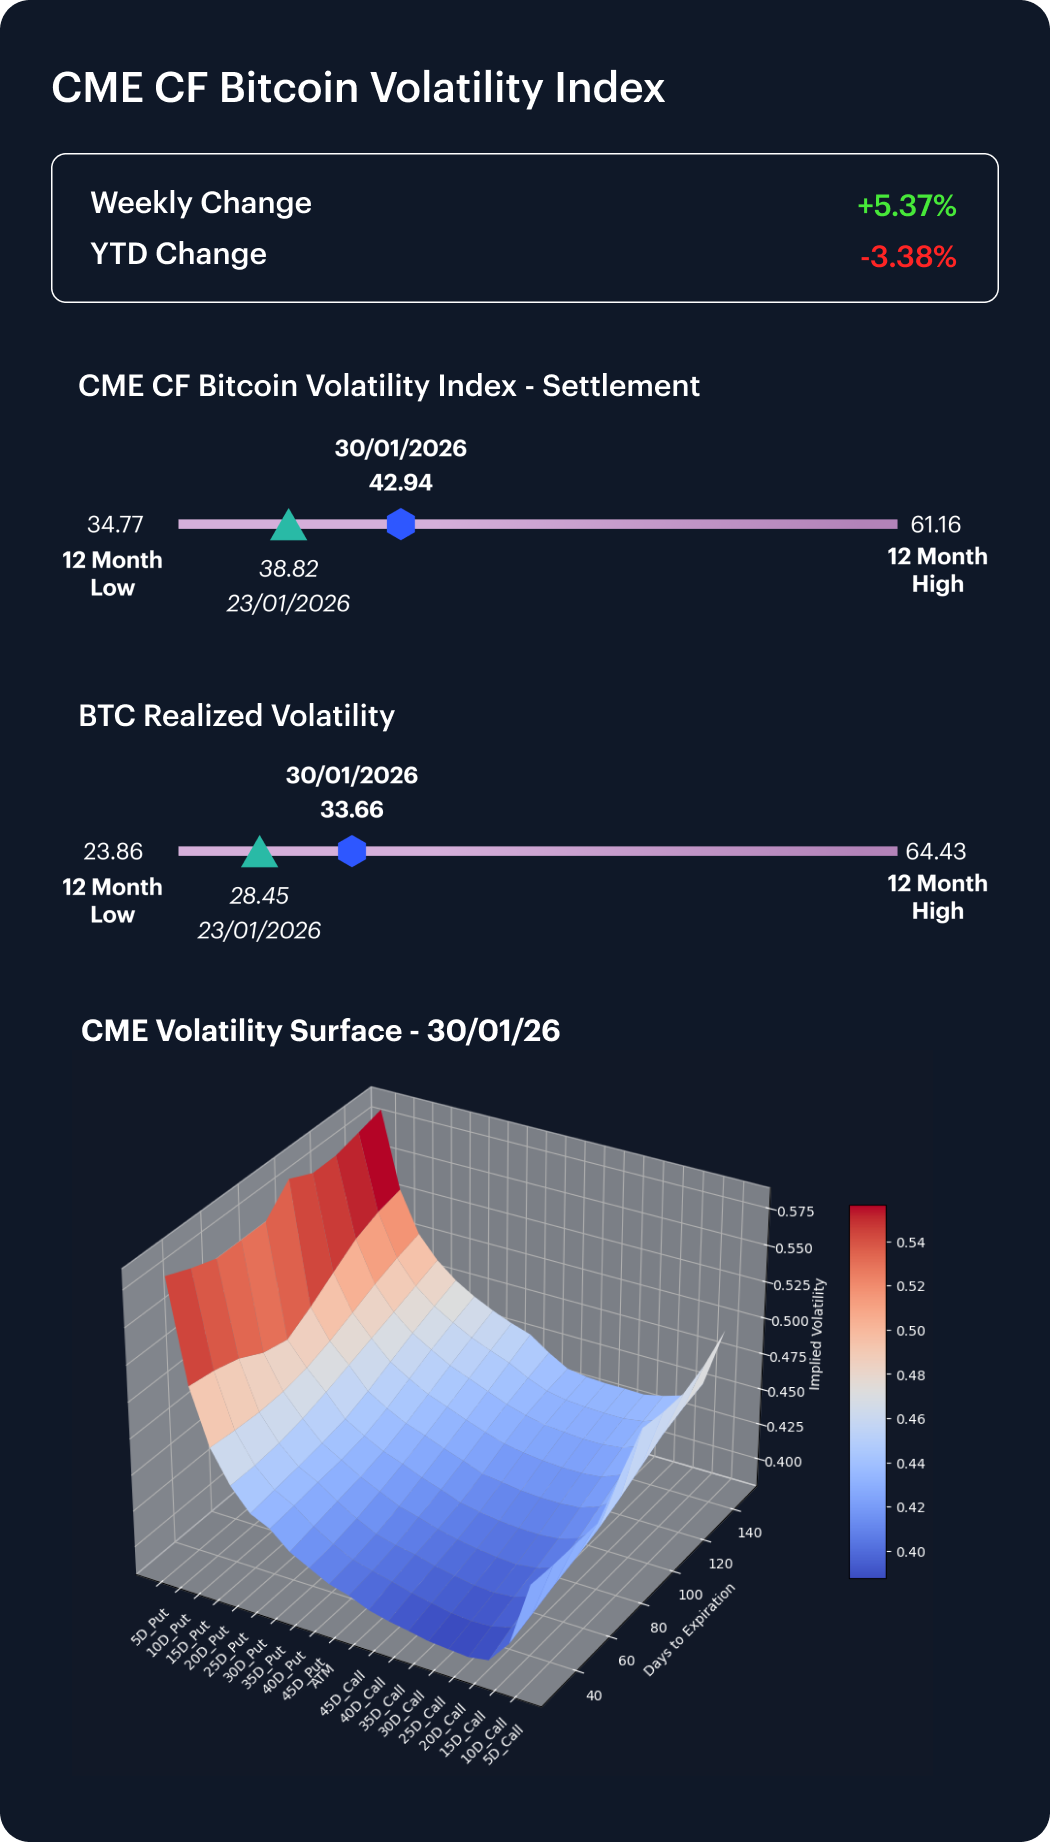
Volatility Analysis
Bitcoin volatility firmed in implied terms and rose in realized terms over the latest business-week snapshot. The CME CF Bitcoin Volatility Index – Settlement (BVXS) opened the week beginning Monday January 26th at 40.75, having closed the prior Friday at 38.8, advancing to 42.94 by Friday January 30th. Realized volatility increased from its 27.93 open for the week (a slight dip from its Friday 23rd close at 28.45) to 33.66 by Friday 30th. With implied at 42.94 versus realized at 33.66, the implied–realized spread sat at 9.28 vol. points, keeping it positive. That’s more consistent with options markets pricing a continued elevated regime than a one-off shock, particularly given that realized rose by 5.21 vol points versus a 4.12 vol-point move in BVXS. Equally, the maintenance of a positive implied premium suggests that hedging demand remained evident even as spot volatility lifted, pointing to a market that is still paying to insure downside tail risk.
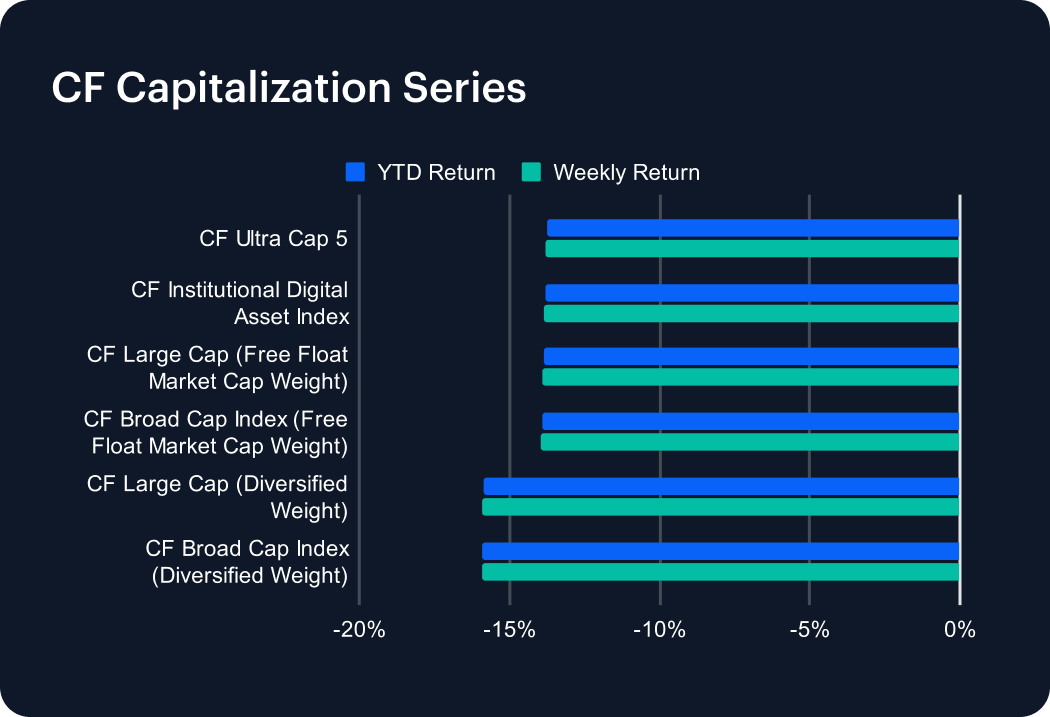
Market Cap Index Performance
Market-cap indices traded in a tightly defined weekly range (-15.9% to -13.8%), underscoring that the drawdown was tier-agnostic. The CF Ultra Cap 5 fell -13.8% w/w (YTD -13.8%) while the CF Institutional Digital Asset Index declined -13.87% w/w (YTD -13.82%). The CF Large Cap (Free Float Market Cap Weight) and CF Broad Cap Index (Free Float Market Cap Weight) returned -13.90% and -13.96% respectively (YTD -13.84% and -13.93%). Diversified-Weight indices were somewhat weaker: the Broad Cap Index (Diversified Weight) fell -15.91% (YTD -15.85%). The roughly -2.09 pp underperformance of diversified broad cap versus Ultra Cap 5 can be tentatively interpreted as a modest tilt away from breadth and into mega-cap defensiveness, even as absolute return profiles remained decisively negative across every tier.
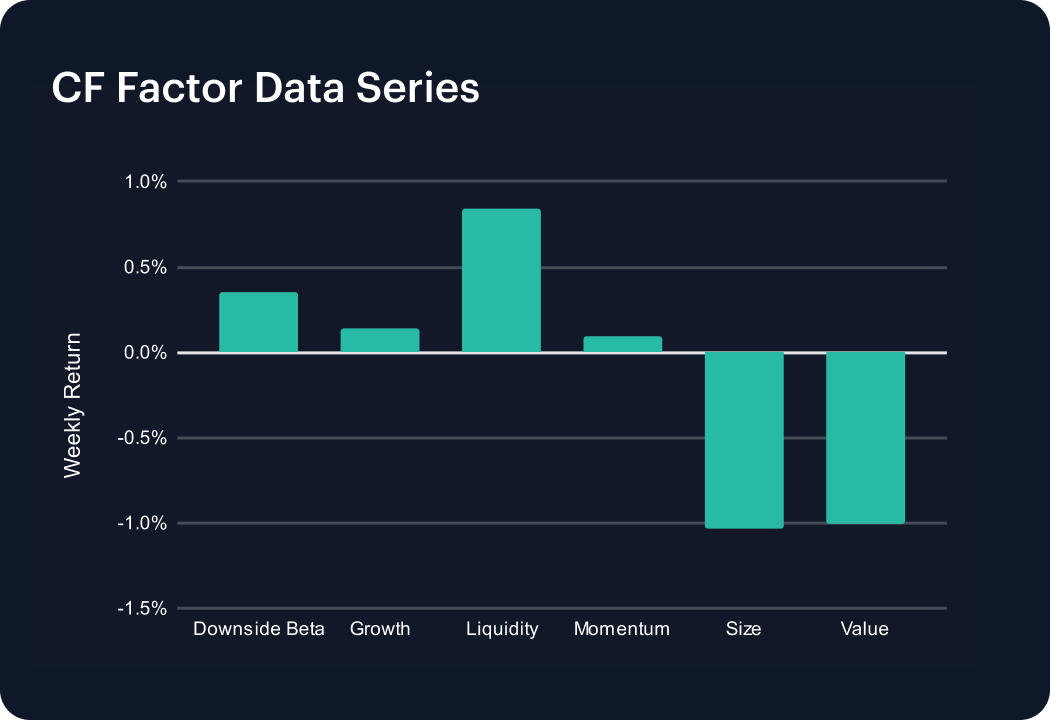
Factors Analysis
Factor returns shifted toward a more balanced profile, with downside protection unwinding and the cross-section splitting between Liquidity and Size. Downside Beta fell from 2.7% in the previous week to 0.4% in the most recent week (a -2.38 pp swing), while Growth moved from -0.7% to 0.1% (0.86 pp). Momentum also improved, rising from -0.3% to 0.1% (0.44 pp). At the same time, Liquidity printed 0.8% and Size -1.0%, indicating that more liquid exposures outperformed smaller names by 1.87 pp in the most recent week. Value remained negative at -1.0%, leaving the factor set spanning -1.0% to 0.8%. Overall, the tape looks consistent with selective re-risking: investors reduced explicit downside-hedge positioning (Downside Beta moved from +2.74% at the end of the week before to +0.36% by the close of the most recent week) while keeping pressure on smaller-cap exposure (Size at -1.0%).
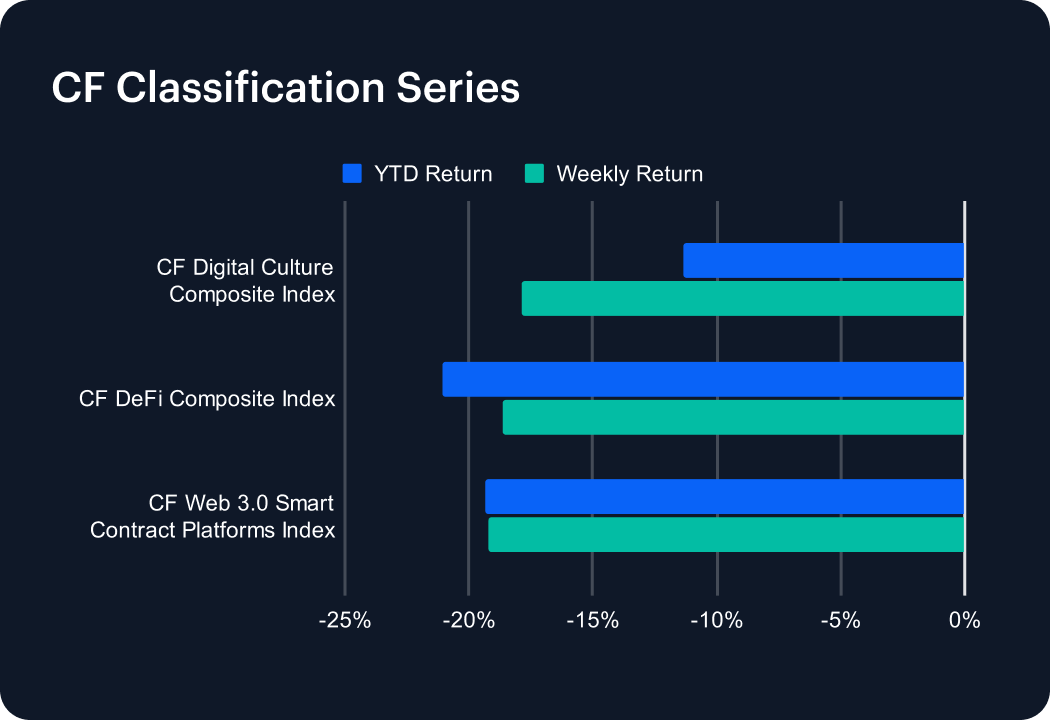
Classification Series Analysis
For the CF Classification Series picture, note that the CF Digital Culture Composite Index returned -17.85% w/w (YTD -11.36%), compared with the CF DeFi Composite Index at -18.62% (YTD -21.09%) and the CF Web 3.0 Smart Contract Platforms Index at -19.20% (YTD -19.35%). Culture therefore outperformed Web 3.0 platforms by about 1.35 pp on the week, despite all three themes remaining firmly negative in absolute terms. That combination—relative—and mild—leadership from Culture despite a -17.8% drawdown—can point to a defensive rotation within high-beta crypto assets. Investors appeared to be expressing risk appetite through smaller, more reflexive segments while keeping exposure to larger protocol beta constrained. At the same time, DeFi’s -21.1% YTD drawdown alongside a -18.6% weekly print indicates that the sector’s recovery profile remains fragile, with little evidence of sustained mean reversion yet.
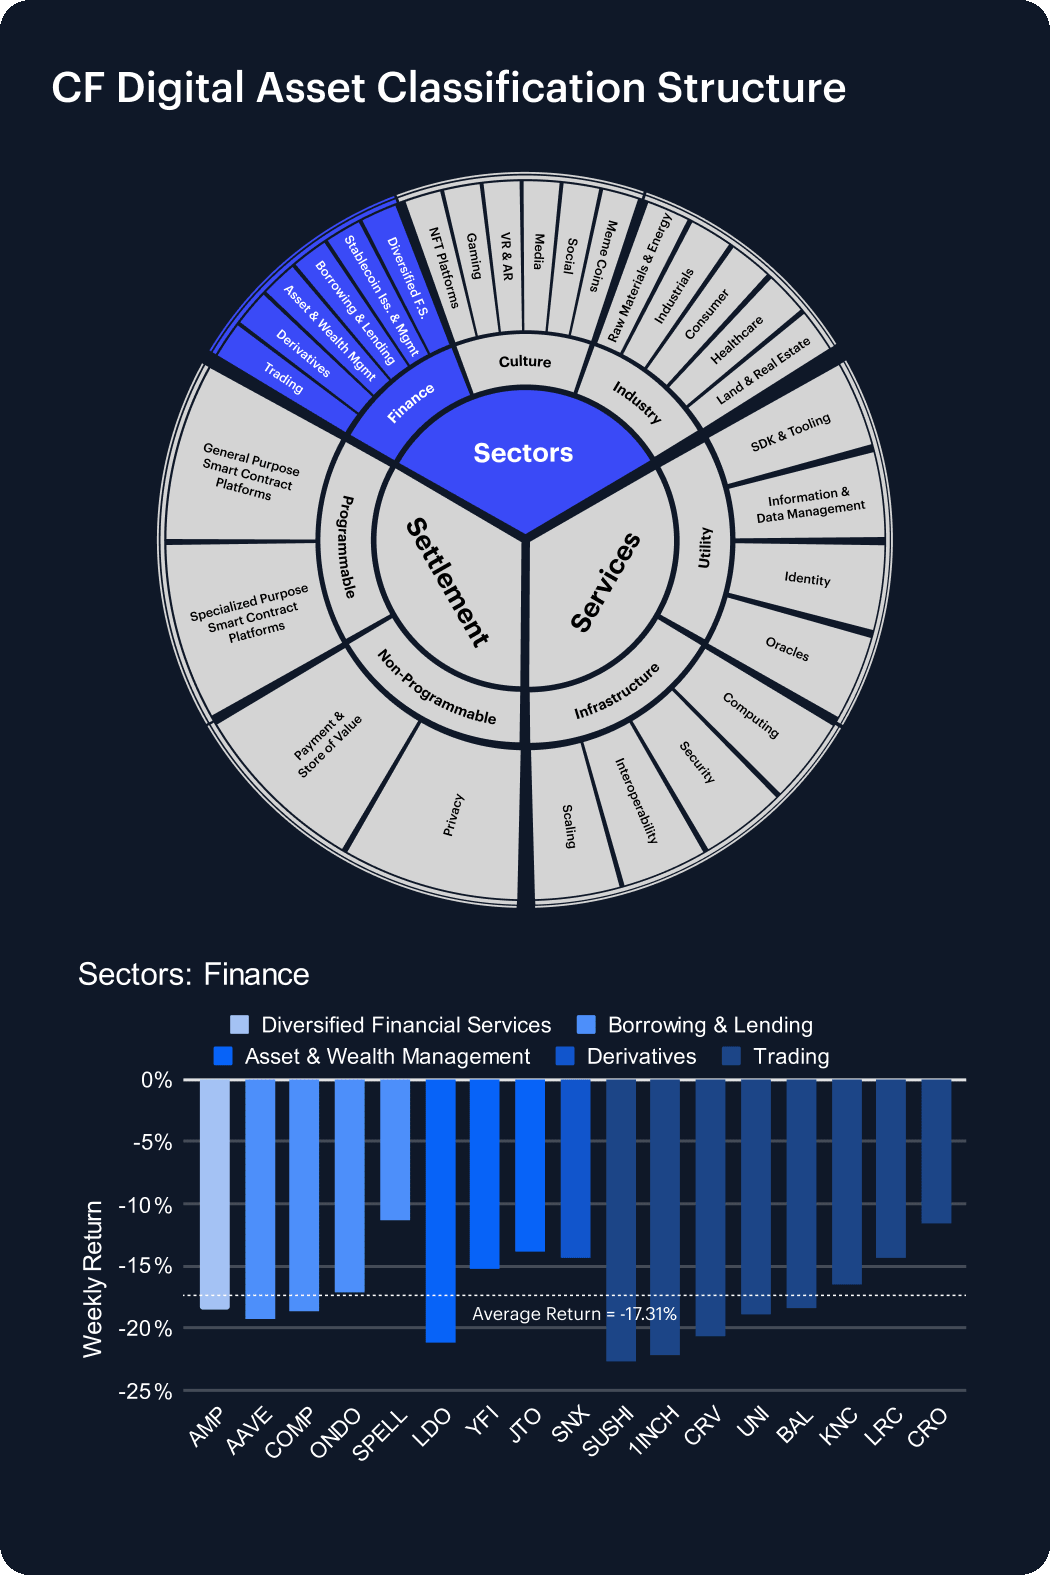
Sector Analysis
Sector performance diverged across the CF DACS complex, with Finance averaging -17.3% w/w versus Culture’s -20.7% average. Within Finance, relative resilience was visible even as returns stayed negative: SPELL (Borrowing & Lending Segment) and CRO (Trading) showed relative leadership of the group at -11.3% and -11.6%, while other Trading and Borrowing & Lending tokens clustered around mid-to-high teens declines (e.g., UNI at -18.8%). Culture’s weaker print was dragged by deeper losses in VR And AR and Social exposures, with BAT and AXS down -29.5% and -27.4%. Across constituents, weekly moves spanned -29.5% to -11.3%, implying that dispersion existed, but that the median outcome remained decisively risk-off. In aggregate, the Finance-over-Culture spread of 3.39 pp is consistent with investors preferring tokens with clearer utility, or fee narratives, over higher-beta cultural expressions.
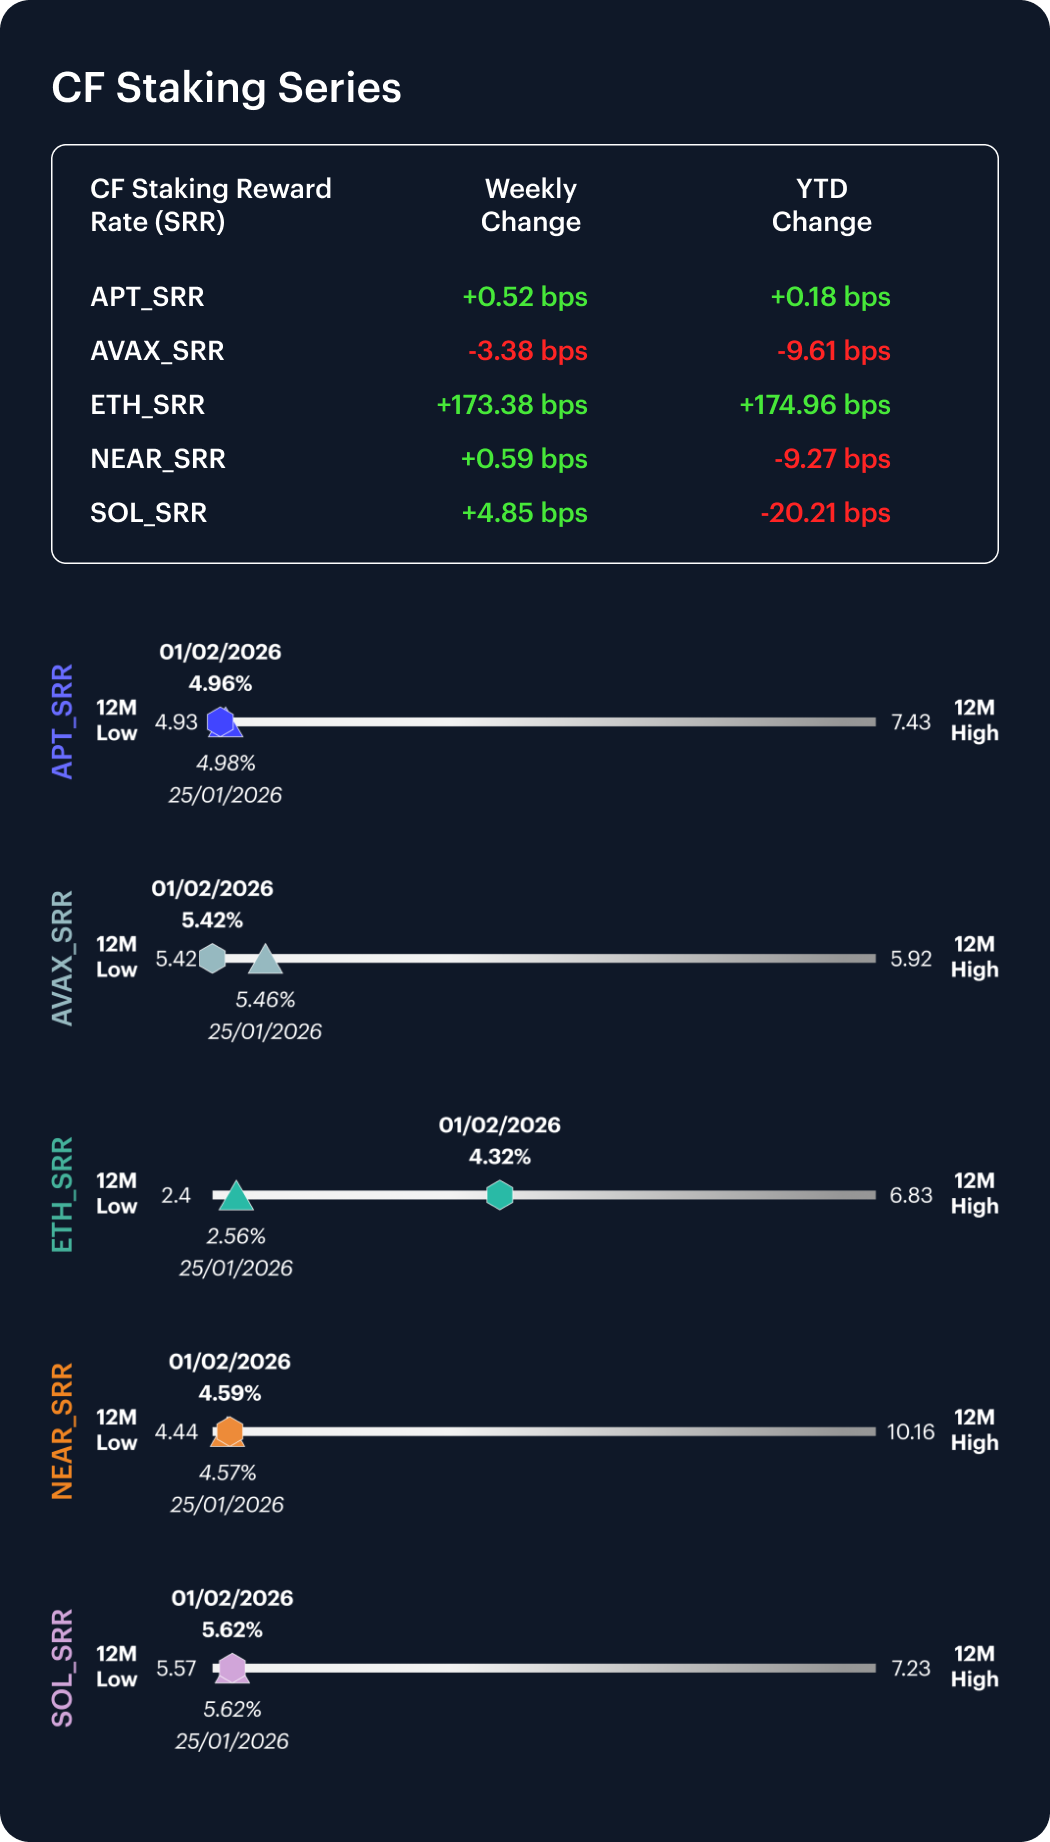
CF Staking Series
Within the CF Staking Series, reward-rate moves were measured for most assets, but ETH showed a step-change. APT Staking returned 0.1% w/w as its reward rate inched up around 0.5 bp over the January 26th to February 1st window. AVAX Staking fell -0.6% w/w, nudging its reward rate down -3.4 bps. In sharp contrast though, ETH Staking return accelerated 67.1% higher w/w equating to a 173.4 bps intra-week increase in the reward rate. NEAR Staking gained 0.1% as its reward rate added just 0.6 bp. In keeping with most of the other modest moves, SOL Staking advanced 0.9% w/w with its reward rate up 4.8 bps. Across the complex, intra-week reward-rate changes ranged from -3.4 bps to Ethereum’s +173.4 bps. Putting aside the clearly protocol specific ETH step-change, staking yields were largely stable in the most recent week.
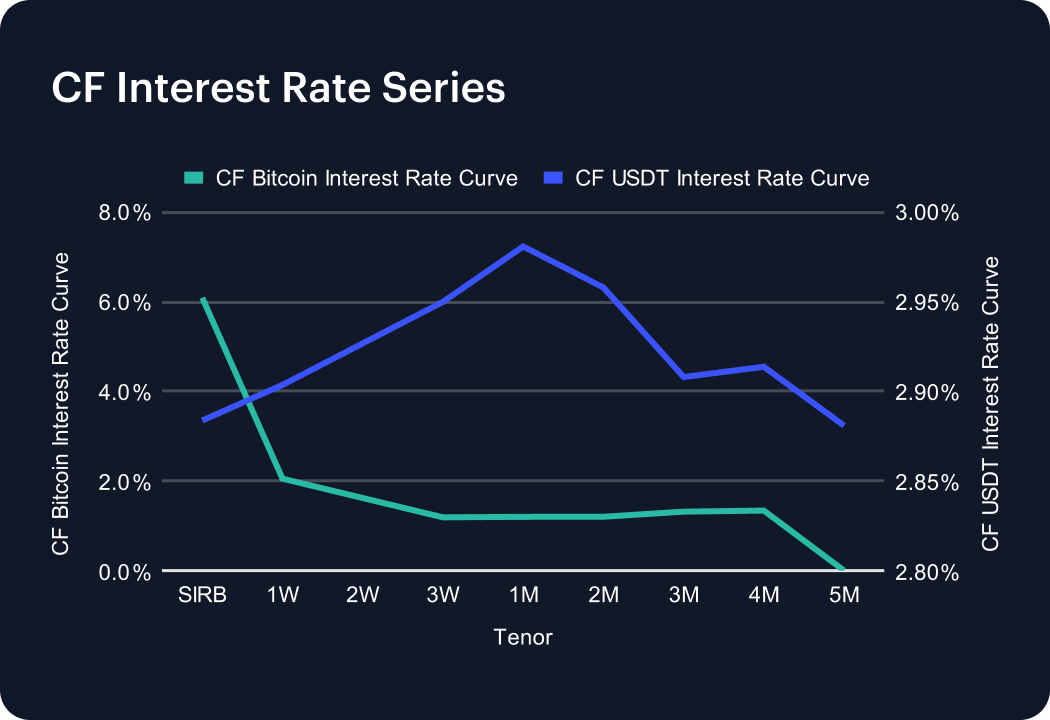
Interest Rate Analysis
Funding conditions largely eased across both BTC and USDT curves, with USDT SIRB down -116.1 bps and BTC SIRB down -33.8 bps week-on-week. BTC SIRB moved from 6.43% to 6.09%, while the 1W and 3M tenors printed 2.05% and 1.32% versus 1.17% and 0.85% a week earlier (changes of 88.5 bps and 47.6 bps). In USDT, SIRB fell from 4.04% to 2.88%, and the 1W–to-3M sector moved from 4.04%/3.88% to 2.90%/2.91% (down -113.9 and -97.8 bps). Across the two curves, tenor-by-tenor changes spanned -118.7 to 88.5 bps, leaving a configuration where front-end funding premia compressed materially. This aligns with the broad deleveraging impulse witnessed in spot over the week.
The information contained within is for educational and informational purposes ONLY. It is not intended nor should it be considered an invitation or inducement to buy or sell any of the underlying instruments cited including but not limited to cryptoassets, financial instruments or any instruments that reference any index provided by CF Benchmarks Ltd. This communication is not intended to persuade or incite you to buy or sell security or securities noted within. Any commentary provided is the opinion of the author and should not be considered a personalised recommendation. Please contact your financial adviser or professional before making an investment decision.
Note: Some of the underlying instruments cited within this material may be restricted to certain customer categories in certain jurisdictions.
Changes to the Token Market Price Benchmarks Series - Market Prices – 21 July 2026
The Administrator has confirmed changes to the Token Market Price Family for the period 14 July 2026 to 21 July 2026.

CF Benchmarks
Softer CPI Reprices July Hike Risk & Lifts Digital Assets
Digital assets extended their recovery over the past week as cooler US inflation prints repriced Fed expectations; the bid was broad across the large cap indices, growth factor leadership returned, stablecoin funding repriced lower, and stress stayed isolated in names hit by token-specific news.
Mark Pilipczuk
Notice of the Demising of CF Dai-Dollar Settlement Price and Spot Rate
The Administrator announces that it will demise the CF Dai-Dollar Settlement Price (DAIUSD_RR) and CF Dai-Dollar Spot Rate (DAIUSD_RTI) which are members of the CF Digital Asset Index Family.
CF Benchmarks
By clicking Accept, you consent to CF Benchmarks's use of cookies.
Visit Cookie Settings to learn how CF Benchmarks uses cookies and to adjust your preferences.