
Feb 23, 2026
Weekly Index Highlights, February 23, 2026
Market Performance Update
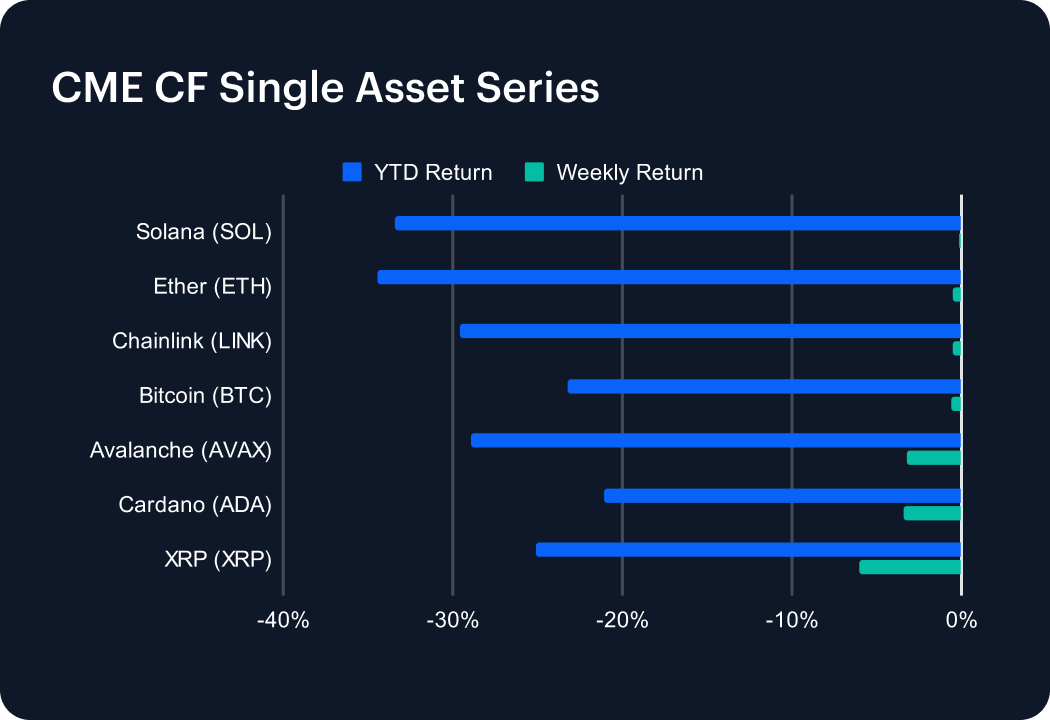
Appetite for digital asset risk faded even further in the recently completed week, with losses broad across the seven coins tracked by the CME CF Single Asset Series, while dispersion skewed to the downside. At the index level, Bitcoin slipped 0.59% week-on-week (w/w) and ETH fell 0.51%, keeping core ‘beta’ negative but relatively contained. The more meaningful signal was arguably in the tails: XRP dropped 6.05% and Cardano (ADA) fell 3.44%, pulling the aggregate tone more toward outright ‘de-risking’ rather than simple consolidation. Solana (SOL) was comparatively resilient at -0.12%, but that stability did not translate into broader strength. Avalanche (AVAX) retreated 3.18% with Chainlink (LINK) down 0.52%. Taken together, the week suggests another modest drawdown increment in majors paired with sharper idiosyncratic weakness in select large-cap alts, consistent with reduced appetite for higher-volatility exposures. Meanwhile, the wider-angle year-to-date (YTD) view is turning more definitively negative, with assets in this series in the red by between roughly 21% to 34%.
Volatility Analysis
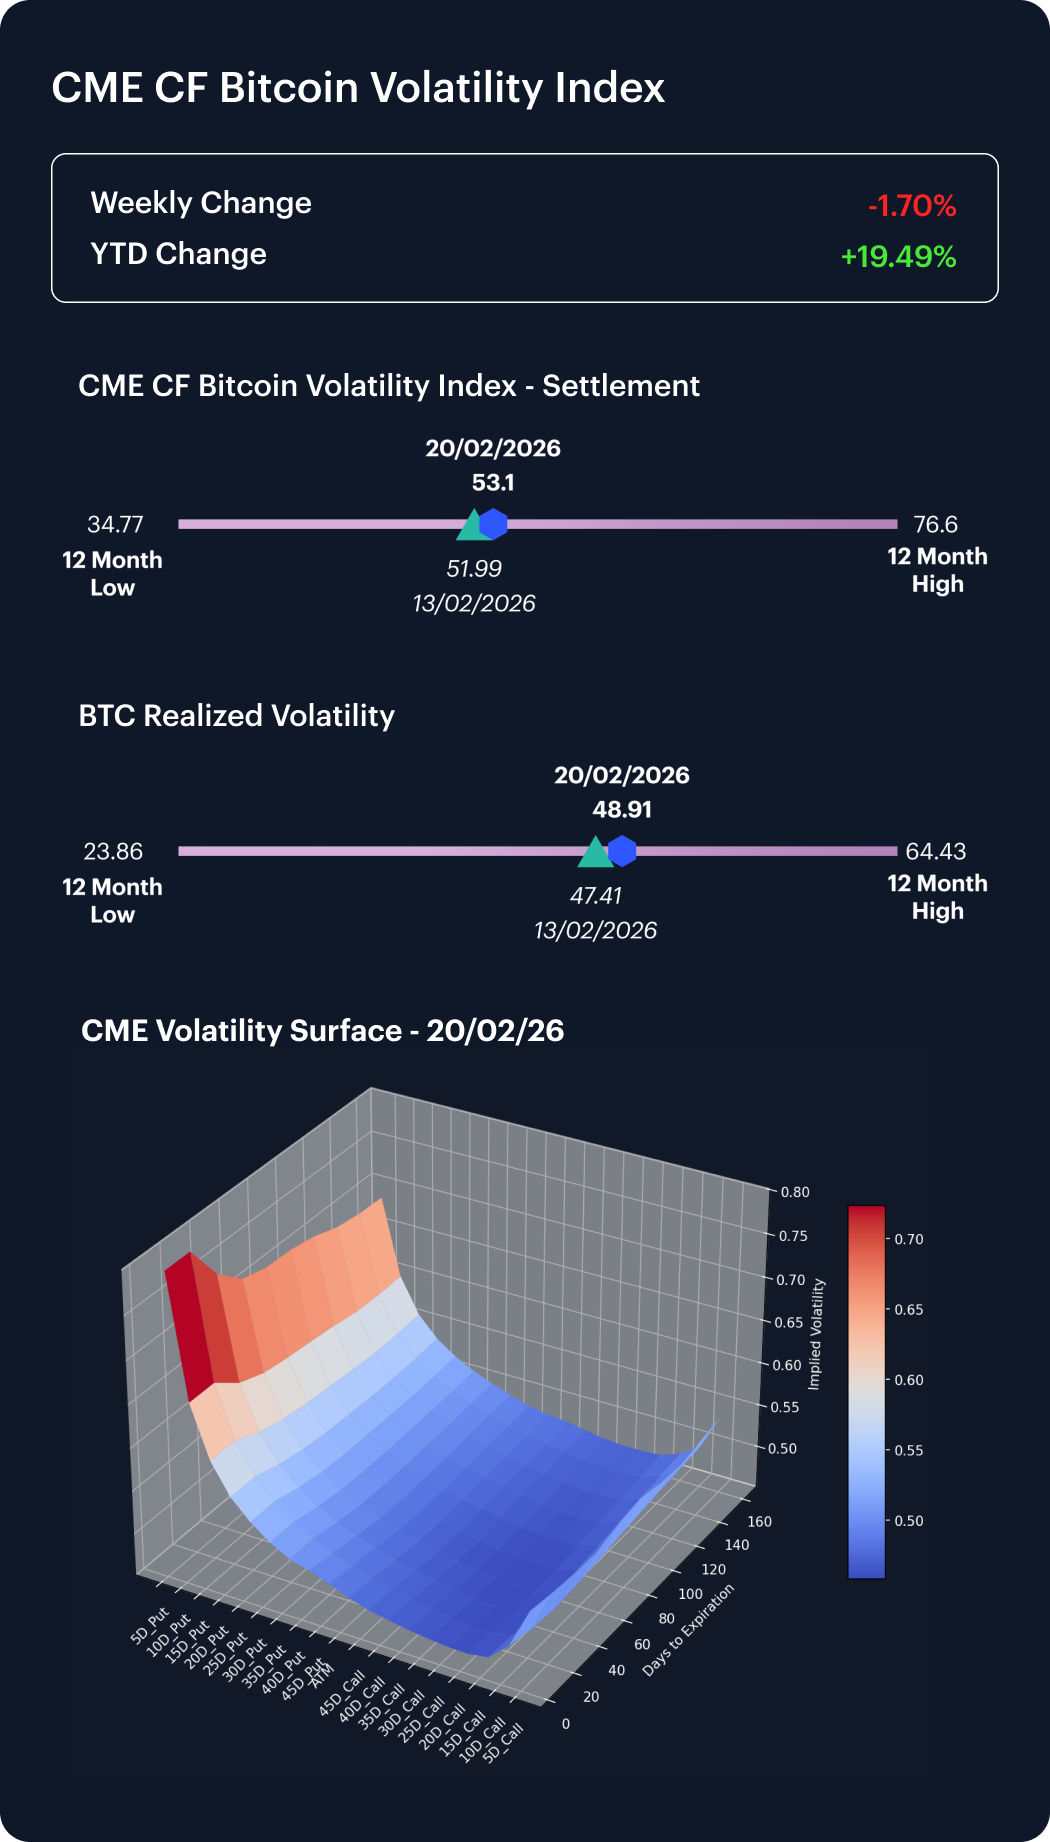
Volatility measures delivered a subtle but important nuance: implied eased even as realized firmed. Typically, that could be read as consistent with a market that is pricing less forward turbulence despite choppy spot outcomes. Looking at the February 17th to February 20th February window, our CME CF Bitcoin Volatility Index – Settlement (BVXS) declined from 54.02 to 53.10, a move of 0.92 points (about 1.7%). Over the same window, realized Bitcoin volatility increased from approximately 48.15 to 48.91, a rise of 0.76 points. The combination suggests that realized movement picked up at the margin, but options markets – essentially – did not demand higher compensation for uncertainty. In practice, that configuration often aligns with ‘contained risk-off’, when spot weakens and dispersion rises, but forward hedging pressure does not accelerate. Tentatively, this may be a hopeful signal for near-term sentiment.
Market Cap Index Performance
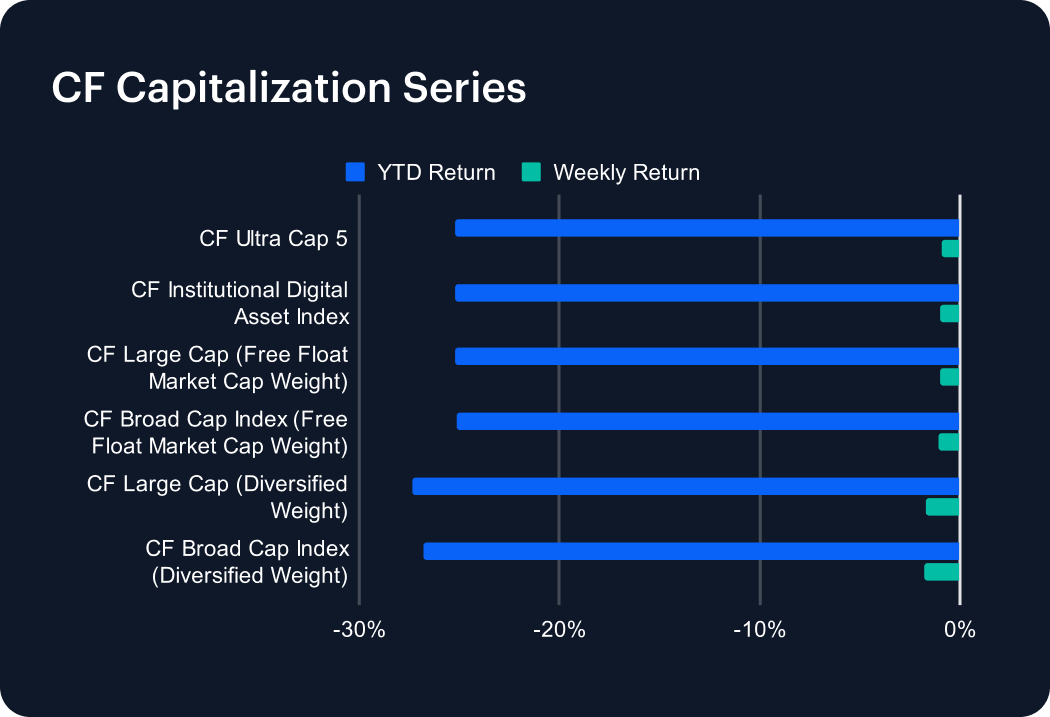
The capitalization complex also signaled that the calibration of de-risking was dialed a few notches into more cautious territory, rather than an impression of forced liquidation, with cap-weighted benchmarks clustered around a one percent decline and diversified-weight variants underperforming modestly. CF Ultra Cap 5 fell 0.94% and the CF Institutional Digital Asset Index fell 0.99%, keeping the large, liquid core tightly ranged. The softer breadth shows up once weights are diversified: CF Large Cap (Diversified Weight) declined 1.67% and CF Broad Cap (Diversified Weight) declined 1.76%. That gap is a useful diagnostic because it indicates that weakness was somewhat broader than the cap-weighted headline suggests, but it did not cascade into a disorderly selloff in the largest names. In other words, the week reads like a ‘core down slightly, breadth down a bit more’ framing, which is consistent with a cautious tone rather than panic.
Factors Analysis
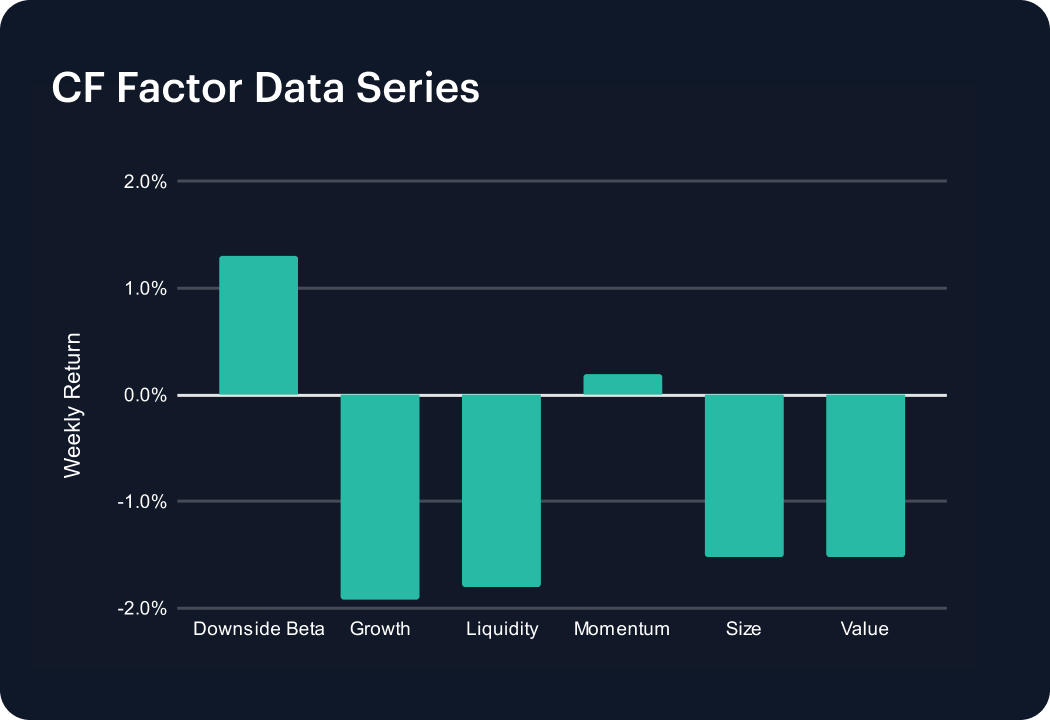
Factor returns this week were sharply bifurcated, with defensiveness and trend exposure holding up as the market penalized ‘long-duration’ and less liquid profiles. Downside Beta led at +1.30% and Momentum added +0.19%, signaling that exposures geared toward downside protection and residual trend resilience outperformed in a softer tape. The other side of the ledger was decisive: Growth fell -1.93% and Liquidity declined -1.81%, while Size and Value each detracted -1.52%. In aggregate, the factor mix points to a controlled risk-off regime in which investors stayed selective—favoring defensive factor characteristics—while rotating away from smaller, cheaper, and less liquid exposures rather than broad capitulation.
Classification Series Analysis
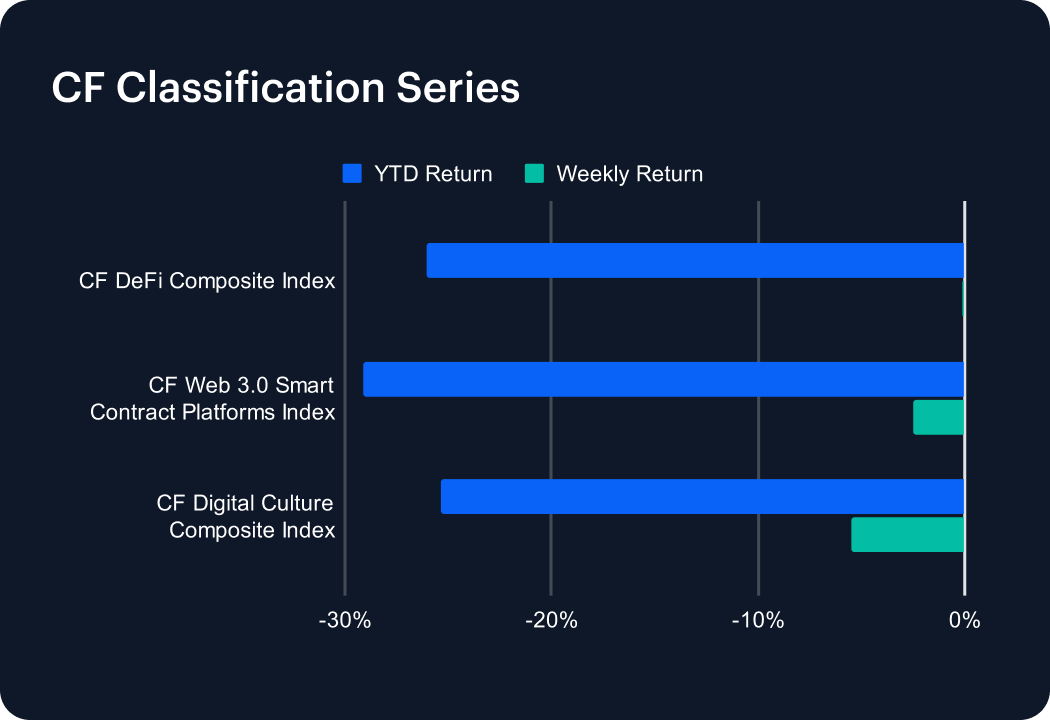
Cross-classification dispersion widened meaningfully even though the headline remained negative. The CF DeFi Composite Index was essentially flat at -0.09% w/w, signaling that the selloff did not express as a uniform unwind of on-chain finance. By contrast, the CF Web 3.0 Smart Contract Platforms Index fell 2.49%, and the CF Digital Culture Composite Index dropped 5.49%, placing the sharpest weakness in the more sentiment-sensitive sleeve. The split matters for interpretation, helping corroborate the overarching view of the week as less like a broad ‘risk-off across crypto’ and more like a rotation away from higher-duration narratives, with DeFi holding up as relatively defensive. The magnitude gap between Culture (-5.49%) and DeFi (-0.09%) is the cleanest numeric expression of that dispersion.
Sector Analysis
Performance across tiers of our CF Digital Asset Classification Structure (CF DACS) reinforced the same de-risking regime, with every reported DACS category negative on average, and the deepest declines concentrated in higher-beta segments. Programmable fell 3.11% on average, while Finance was comparatively resilient at -1.52%, leaving the ‘core’ down but not disorderly. The stress sat further out the curve: Infrastructure declined 7.45% and Culture fell 7.50%, with Utility down 4.16% and Non-Programmable down 2.74%. The pattern is important because it was not simply an ‘everything red’ week. Instead, this looks like a clear steepening of the drawdown profile as you move toward segments that typically carry more narrative risk and reflexivity. All in, the sector tape – just like analyses from other sections in this edition – suggests a controlled risk-off rotation rather than an indiscriminate selloff, with weakness concentrated where sentiment and beta are typically most exposed.
CF Staking Series
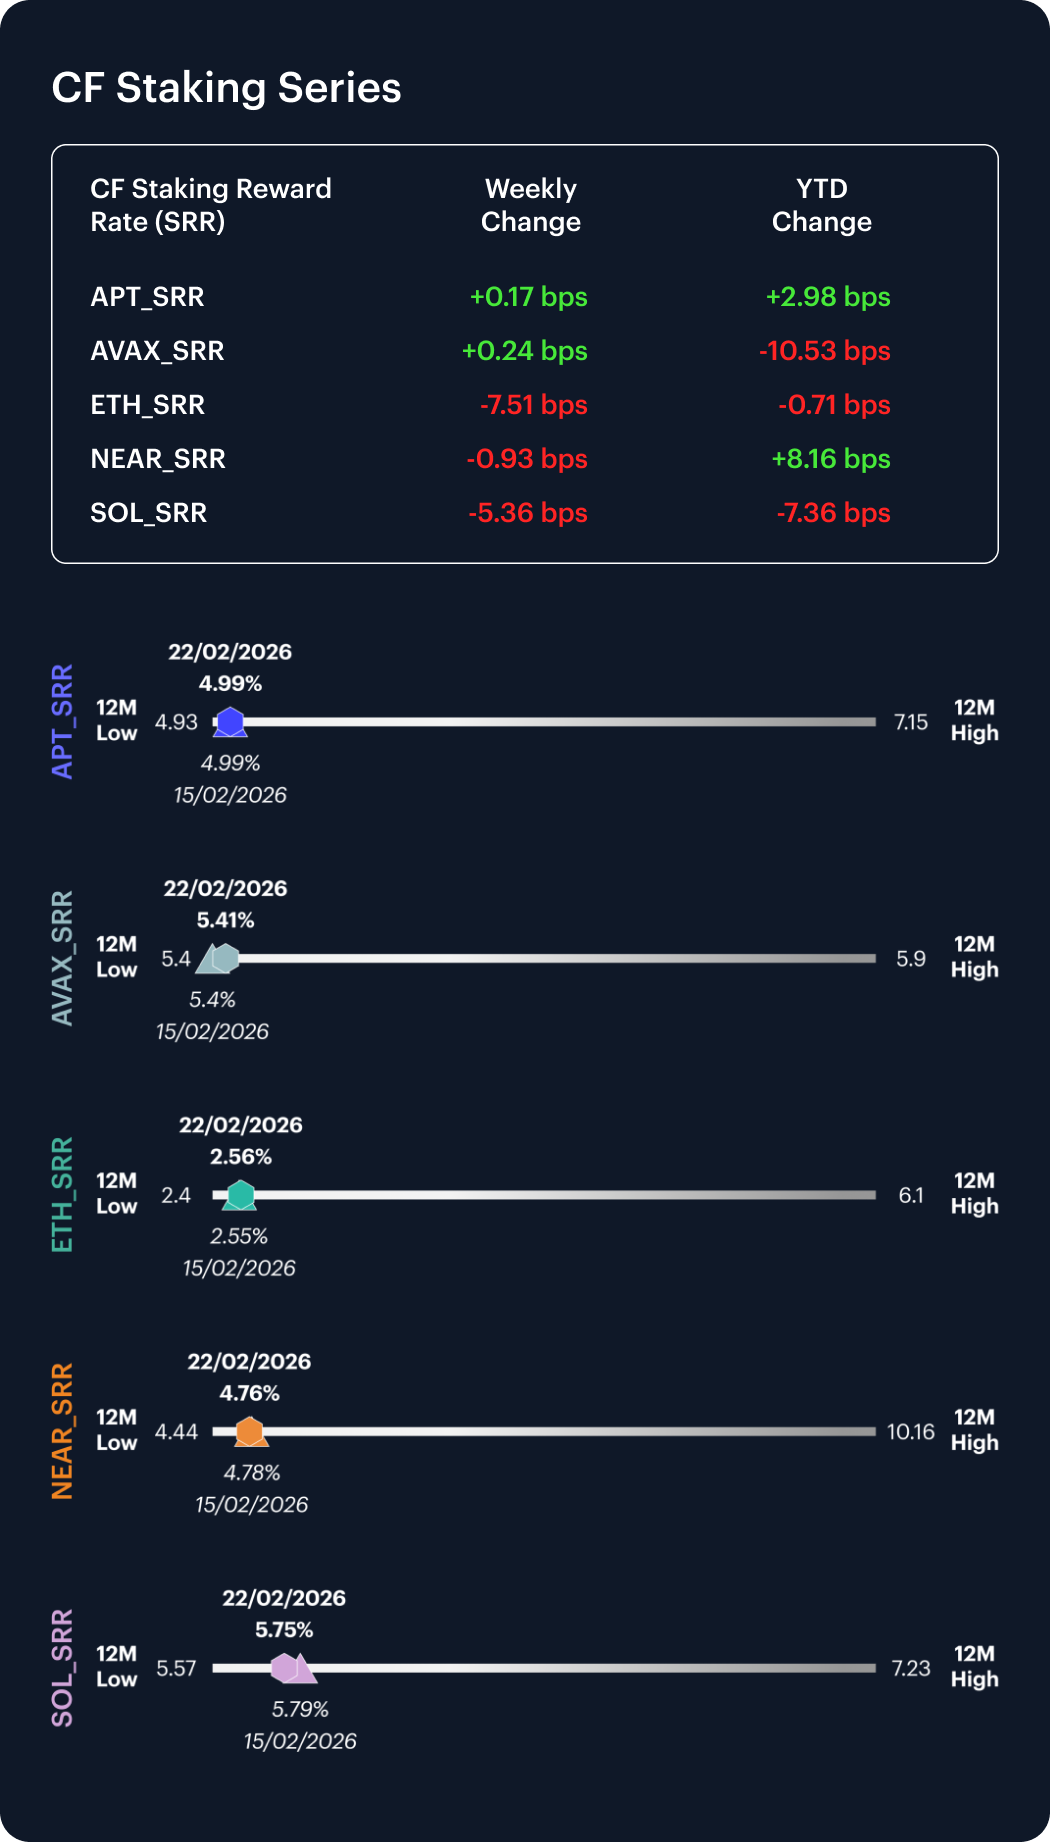
Staking performance was mixed over the week, with price returns softening even as reward rates moved only modestly. ETH staking returned 2.85% w/w as its reward rate declined 7.51 bps, and leaving the rate close to its recent range relative to a 12-month low of 2.40% and high of 6.10%. SOL staking declined 0.92% as its reward rate fell 5.36 bps to 5.75% from 5.82%, still toward the lower end of its 12-month band (5.57%–7.23%). In contrast, APT and AVAX staking were effectively flat at +0.03% and +0.04%, with reward rates nudging higher by 0.17 bps and 0.24 bps to 4.99% and 5.41% respectively. NEAR staking slipped 0.19% as its reward rate eased 0.93 bps to 4.76%, remaining well below its 12-month high of 10.16% despite a positive YTD rate move of 8.16 bps.
Interest Rate Analysis
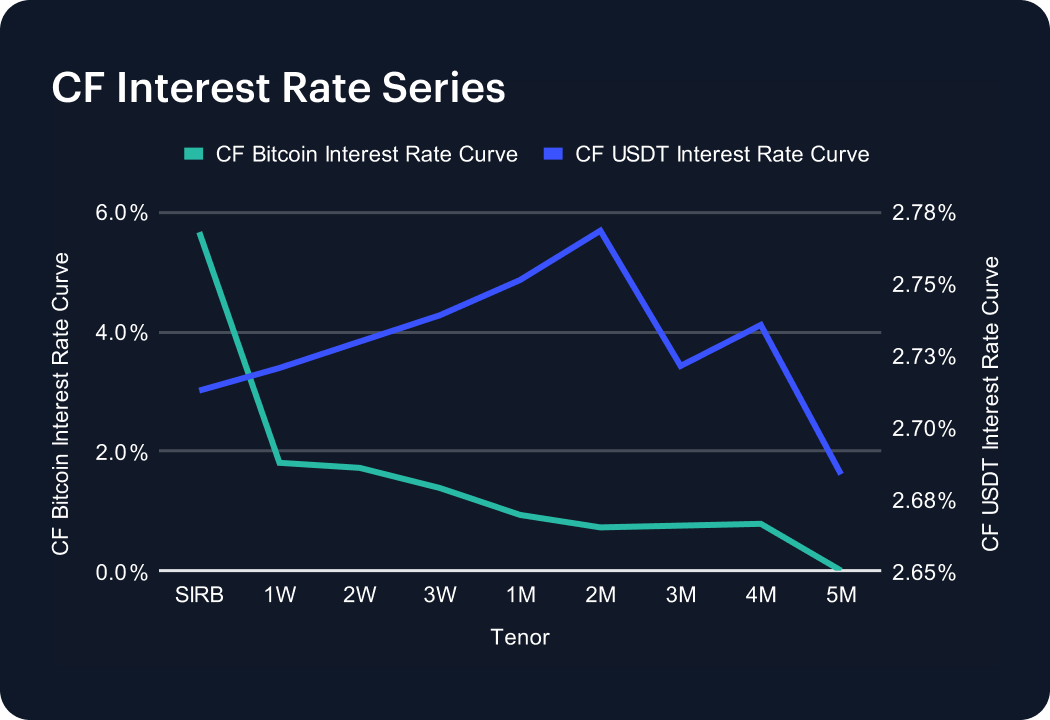
Rates seemed to have been among the most dislocated surfaces over the week, with a sharp front-end move in the CF Bitcoin Interest Rate Curve (CF BIRC) that did not propagate uniformly across tenors. SIRB fell 143 bps, from 7.099% to 5.669%, marking a meaningful repricing at the shortest point on the curve. Further out, the curve moved higher at intermediate maturities, with 2W up 86.8 bps from 0.853% to 1.721% and 1M up 36.3 bps from 0.569% to 0.932%. In USDT, the curve shifted higher in a more conventional fashion, with SIRB up 13.2 bps from 2.581% to 2.713% and 1M up 9.7 bps from 2.654% to 2.751%. The net read is a curve that became more kinked in BTC funding, suggesting idiosyncratic front-end dynamics rather than a simple parallel shift.
The information contained within is for educational and informational purposes ONLY. It is not intended nor should it be considered an invitation or inducement to buy or sell any of the underlying instruments cited including but not limited to cryptoassets, financial instruments or any instruments that reference any index provided by CF Benchmarks Ltd. This communication is not intended to persuade or incite you to buy or sell security or securities noted within. Any commentary provided is the opinion of the author and should not be considered a personalised recommendation. Please contact your financial adviser or professional before making an investment decision.
Note: Some of the underlying instruments cited within this material may be restricted to certain customer categories in certain jurisdictions.
Changes to the Token Market Price Benchmarks Series - Market Prices – 21 July 2026
The Administrator has confirmed changes to the Token Market Price Family for the period 14 July 2026 to 21 July 2026.

CF Benchmarks
Softer CPI Reprices July Hike Risk & Lifts Digital Assets
Digital assets extended their recovery over the past week as cooler US inflation prints repriced Fed expectations; the bid was broad across the large cap indices, growth factor leadership returned, stablecoin funding repriced lower, and stress stayed isolated in names hit by token-specific news.
Mark Pilipczuk
Notice of the Demising of CF Dai-Dollar Settlement Price and Spot Rate
The Administrator announces that it will demise the CF Dai-Dollar Settlement Price (DAIUSD_RR) and CF Dai-Dollar Spot Rate (DAIUSD_RTI) which are members of the CF Digital Asset Index Family.
CF Benchmarks
By clicking Accept, you consent to CF Benchmarks's use of cookies.
Visit Cookie Settings to learn how CF Benchmarks uses cookies and to adjust your preferences.