
Dec 15, 2025
Weekly Index Highlights, December 15, 2025
Market Performance Update
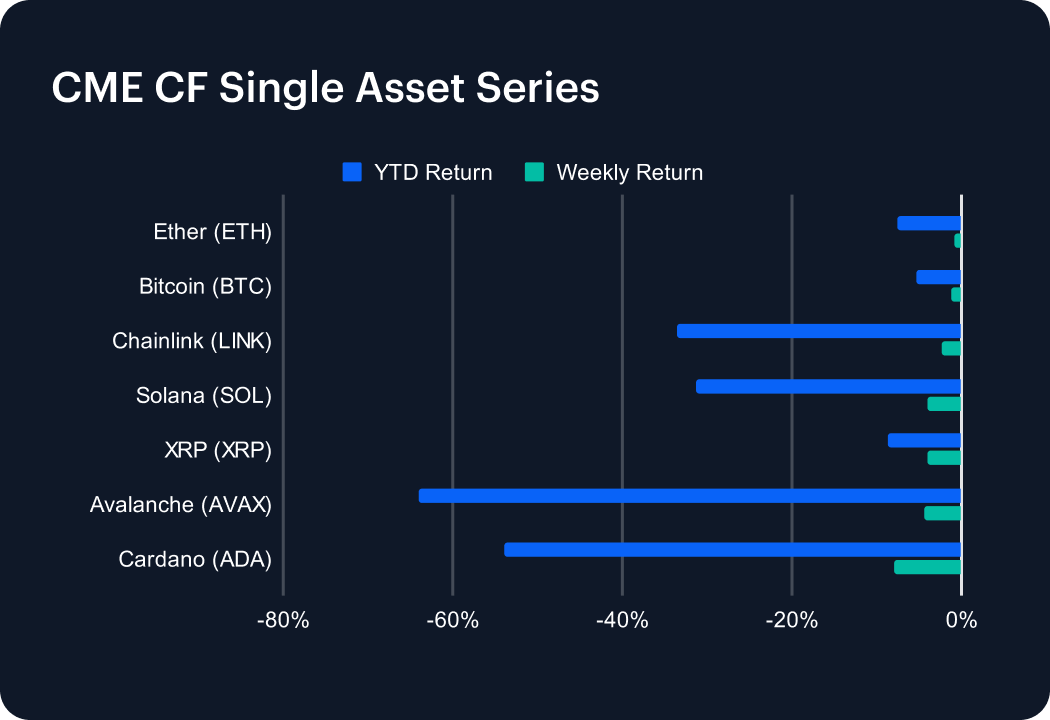
Digital assets gave back some of the gains booked in the prior week over the most recent one, with large caps declining, but avoiding disorderly price action. Bitcoin fell -1.2% week-on-week (w/w), leaving it -5.2% year-to-date (YTD), while Ether slipped a milder -0.9% w/w and to stand at -7.6% YTD. Higher-beta names absorbed a larger share of the adjustment: Chainlink (LINK) declined -2.3% w/w (-33.6% YTD), Solana lost -4.0% w/w (-31.4% YTD), Avalanche (AVAX) dropped -4.3% w/w (-63.9% YTD) and Cardano (ADA) underperformed with an -8.0% w/w retreat (-53.8% YTD). Meanwhile, XRP tracked the weaker end of the major-cap complex at -4.1% w/w (-8.6% YTD). The pattern shows a broad, orderly pullback skewed towards higher-beta assets rather than an idiosyncratic shock to a single theme or token, with BTC and ETH continuing to anchor the complex, and still showing meaningfully shallower YTD drawdowns than most alt L1s.
Sector Analysis
Sector performance through the CF DACS lens showed that the retracement was far from uniform. In Finance, assets delivered an average weekly return of around -3.2% w/w, but dispersion was wide: LRC rallied +28.2% w/w, while a long tail of peers traded lower, including BAL (-2.9% w/w), UNI (-4.4% w/w), 1INCH (-5.1% w/w), SUSHI (-5.4% w/w) and CRO and KNC (both -6.4% w/w). Derivatives token SNX weakened -9.8% w/w, and Asset & Wealth Management names LDO and YFI printed -1.7% and -5.5% w/w respectively, underscoring the pressure on fee- and leverage-sensitive exposures. Culture fared worse on average, with tokens in the Gaming, Social, Media, VR/AR and NFT Platform buckets losing about -5.5% w/w. PRIME dropped -14.0% w/w, SAND -9.4% w/w, and IMX and MANA -8.0% and -7.4% w/w, partially offset by positive weekly gains in CHZ (+4.1% w/w) and BAT (+2.8% w/w). The result is a picture of selective de-risking, with investors more willing to sell structurally speculative Culture assets than core Finance rails, while still rotating aggressively within each bucket.
CF Staking Series
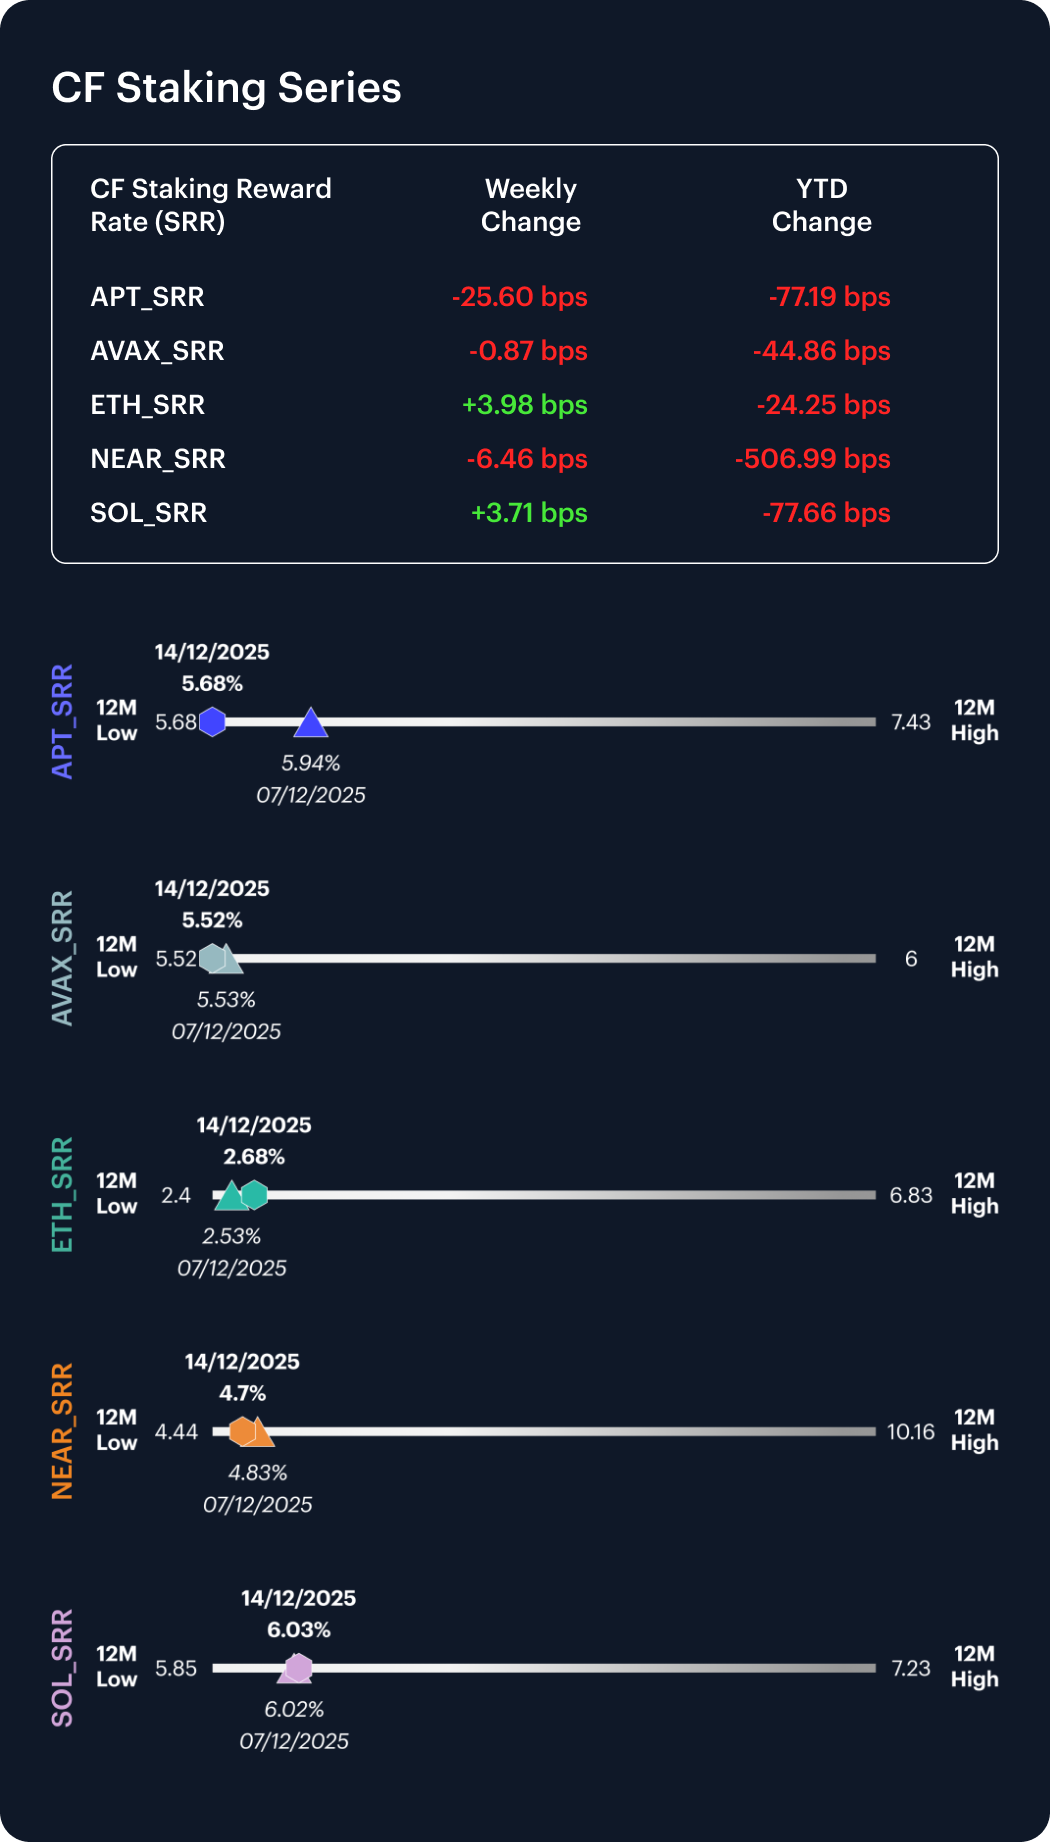
Staking markets remained orderly, with reward curves adjusting in relatively narrow bands rather than signaling stress. Current reward rates stand at around 5.68% for APT, 5.52% for AVAX, 2.68% for ETH, 4.70% for NEAR and 6.03% for SOL. The combination of a notable compression in APT yields, modest softening in NEAR, and small upward adjustments in ETH and SOL suggests that validators and delegators are repricing network-specific risks and demand rather than rotating out of staking wholesale. With all five networks’ reward rates still sitting comfortably within their observed 12-month ranges, the CF Staking Series continues to signal granular repositioning across chains as opposed to a drain of capital from the staking complex.
Market Cap Index Performance
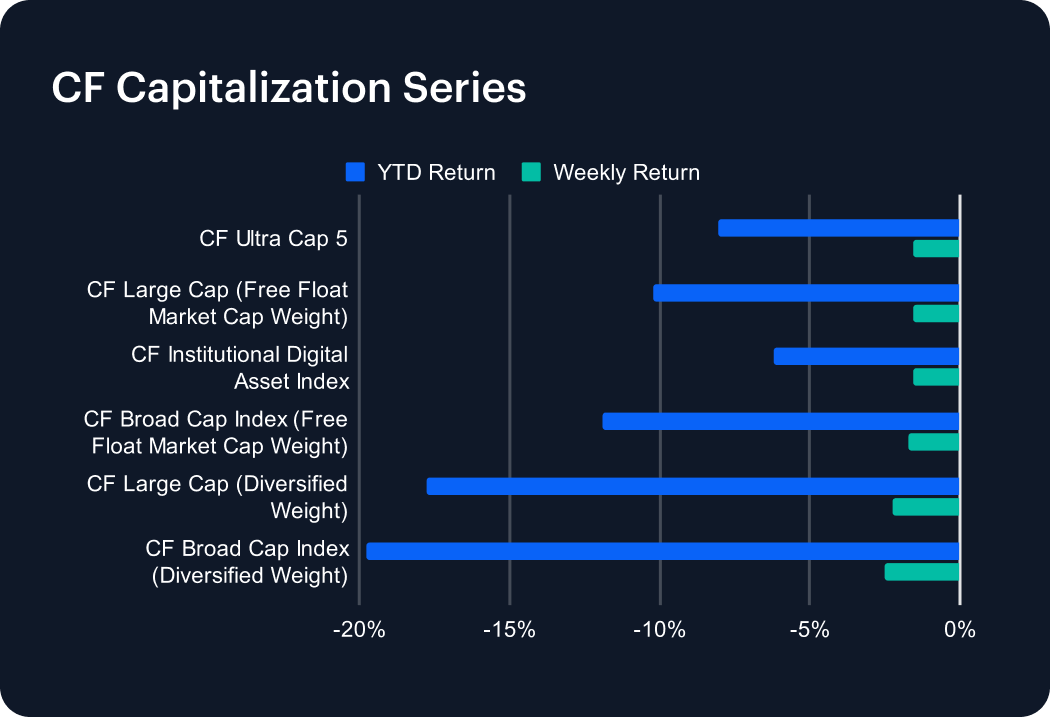
Capitalization tiers moved lower in a clustered fashion, with all major CF Capitalization indices recording mid-single-digit percentage point declines at the index level. The CF Ultra Cap 5 fell -1.5% w/w (-8.0% YTD), while the CF Large Cap (Free Float Market Cap Weight) and CF Broad Cap Index (Free Float Market Cap Weight) printed -1.6% w/w (-10.2% YTD) and -1.7% w/w (-11.9% YTD) respectively. Diversified-weight benchmarks underperformed modestly: the CF Large Cap (Diversified Weight) lost -2.2% w/w (-17.7% YTD) and the CF Broad Cap Index (Diversified Weight) weakened -2.5% w/w (-19.8% YTD). The gap of roughly 1 percentage point between free-float and diversified outcomes indicates that smaller and more weakly-weighted constituents faced greater selling pressure, but the overall clustering of returns points to a broad beta move rather than a sharp regime shift favoring or penalizing any specific capitalization bucket.
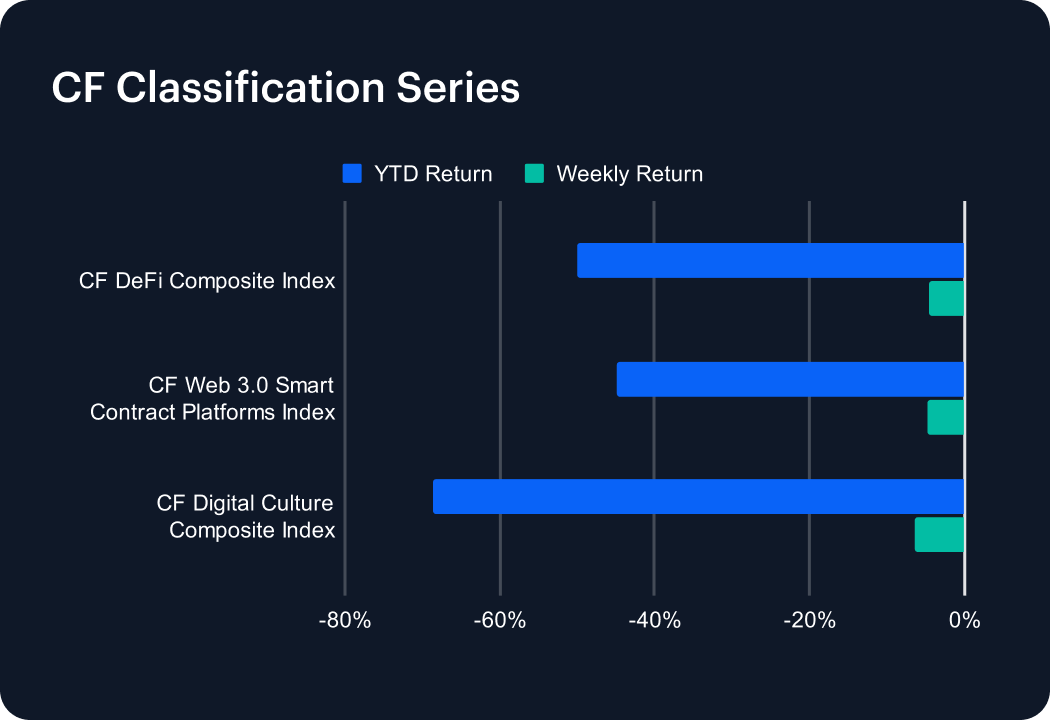
Classification Series Analysis
The CF Classification Series registered a synchronized setback, with all three thematic indices declining 4% to 6% w/w from already depressed year-to-date levels. The CF Web 3.0 Smart Contract Platforms Index fell -4.7% and now sits -44.9% YTD, the CF DeFi Composite Index declined -4.6% (-50.1% YTD), and the CF Digital Culture Composite Index lagged again at -6.4% w/w, extending its YTD loss to -68.7%. Web 3.0 and DeFi therefore traded in a tight weekly range, while Culture underperformed by nearly 2 percentage points on the week. The narrowing gap between Web 3.0 and DeFi returns, alongside persistent underperformance of Culture, suggests allocators are paring back risk across all high-beta themes, but remain most cautious on narrative-driven, non-cashflow segments. Web 3.0’s smaller weekly drawdown relative to its YTD damage hints that investors are still treating core execution platforms as the more resilient way to maintain structural exposure to the asset class.
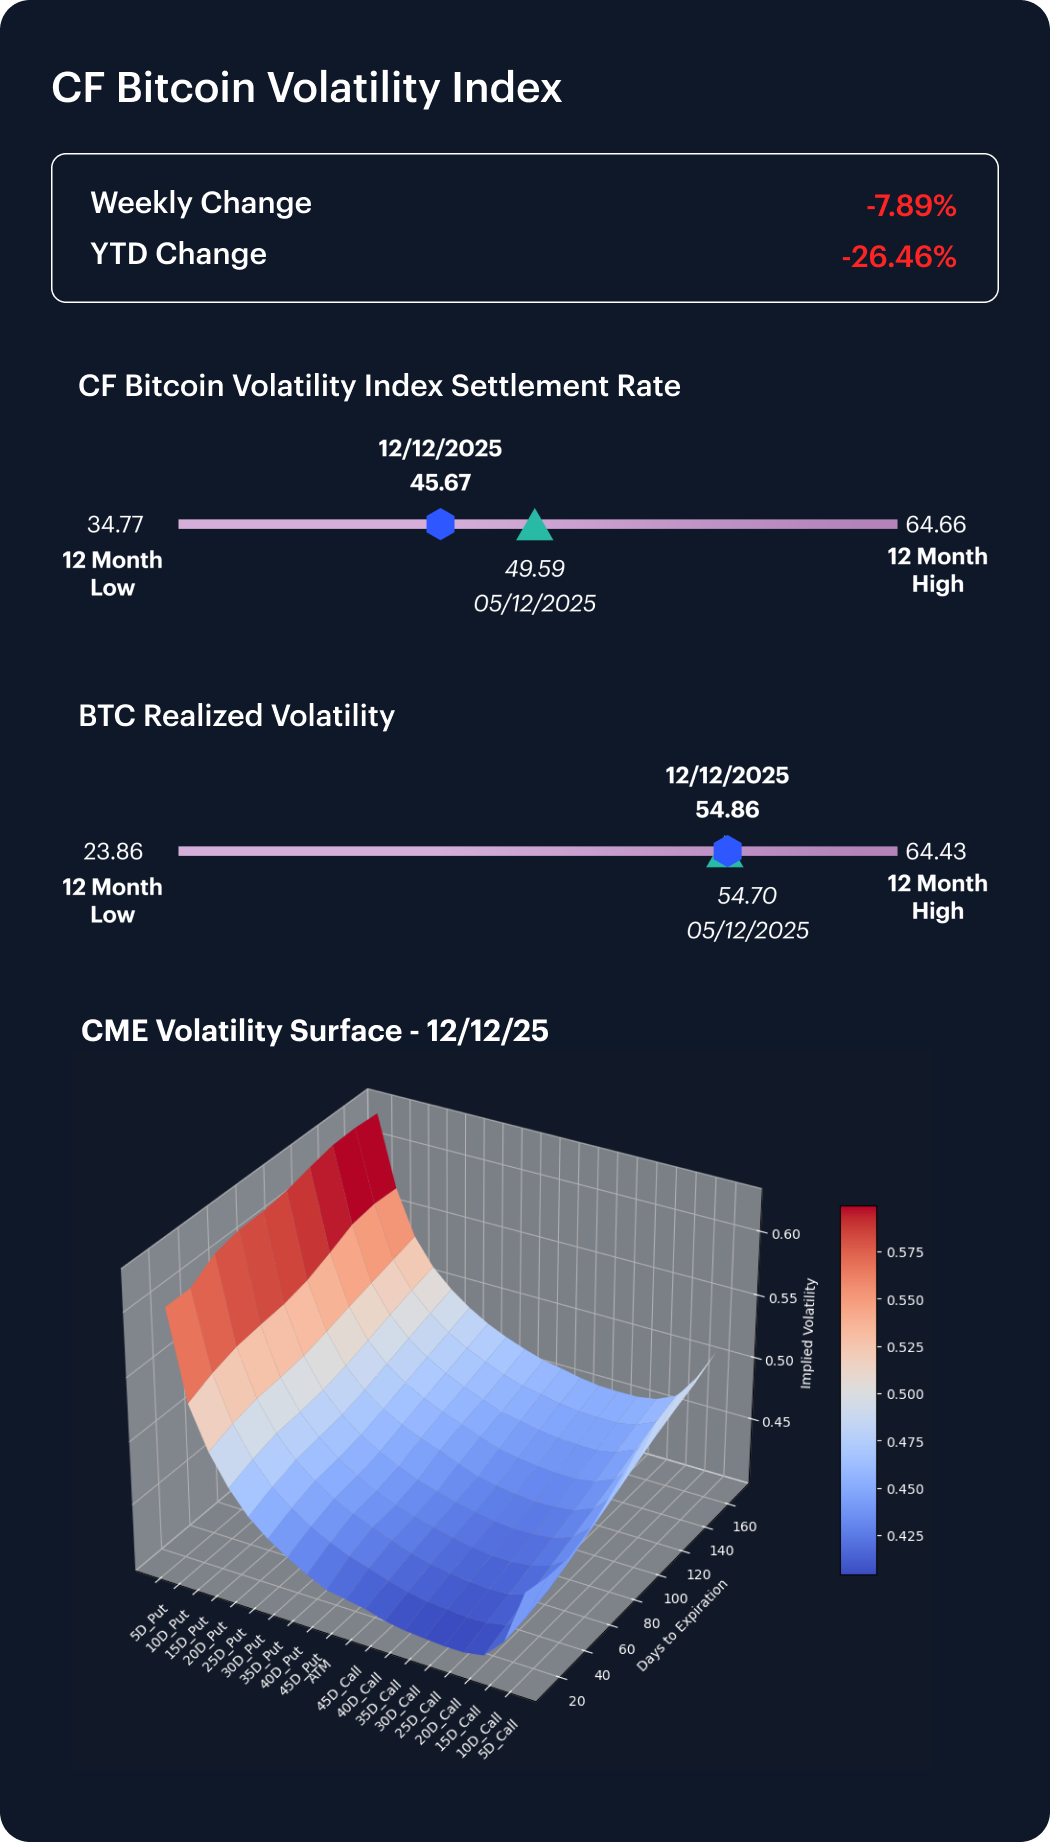
Volatility Analysis
Bitcoin’s volatility surface continued to be dominated by realized price swings rather than an aggressive repricing of option premia. The CF Bitcoin Volatility Index (BVX) eased from 49.6 to 45.7 over the week (ending December 12th), even as realized volatility ticked higher from 54.7 to 54.9. As a result, realized volatility now exceeds implied by roughly 9.2 vol. points, compared with about 5.1 vol. points a week earlier. This widening negative implied–realized spread indicates that spot markets have been absorbing a meaningful amount of turbulence without a proportionate rise in hedging demand. Volatility sellers have not been forced to capitulate en masse, but option buyers have also refrained from chasing further protection, despite the drawdown in underlying prices. The configuration is consistent with a market that is accepting elevated realized volatility as part of an ongoing repricing process, while still viewing current option levels as broadly fair, rather than urgently cheap.
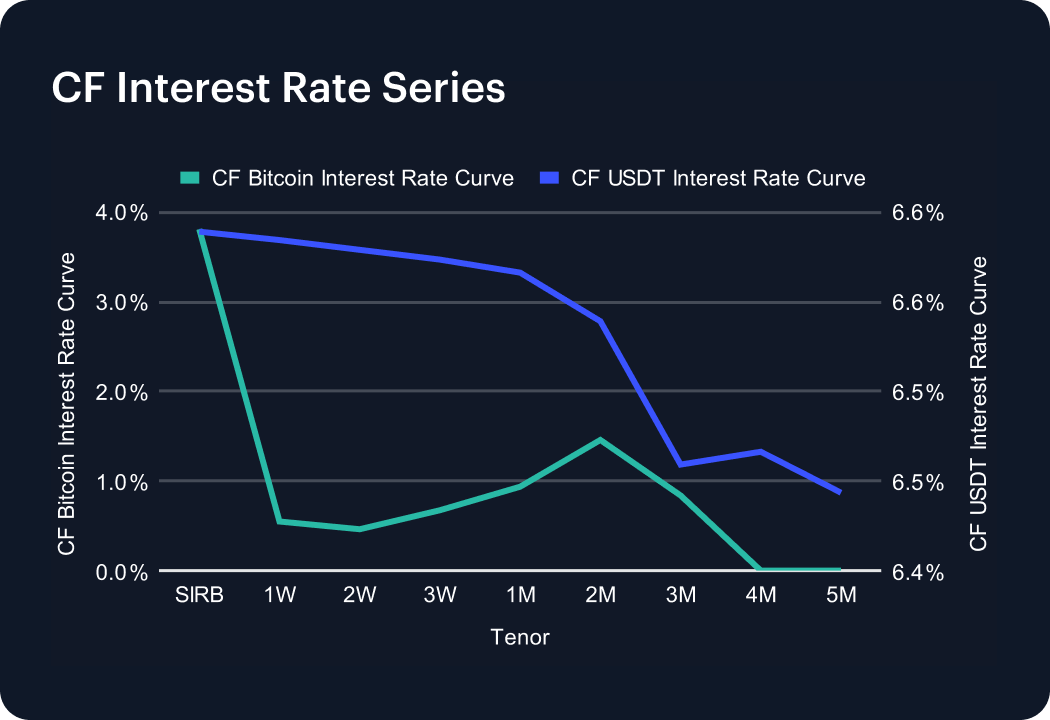
Interest Rate Analysis
Funding conditions across the CF BIRC curves showed a sharp divergence between BTC and USDT. On the BTC side, the SIRB rate fell from 4.86% to 3.81% (about -105 bps w/w), while the 1W tenor dropped from 1.80% to 0.55% (around -125 bps) and the 3M tenor eased from 1.16% to 0.84% (roughly -33 bps). The 1M and 2M points held near 0.94% and 1.46%, leaving the 1M–2M belly modestly upward-sloping even as the very front end reset lower. In contrast, the USDT SIRB climbed from 4.21% to 6.59% (about +238 bps), and the 1W–3M sector shifted almost in parallel, with 1W rising from 4.19% to 6.58% and 3M from 3.97% to 6.46% (each roughly +250 bps). Summing up, the pattern suggests targeted normalization of BTC leverage premia after recent dislocations, set against a backdrop of broad tightening in dollar funding. Any thesis indicating a unified funding shock across both curves is much less favored.
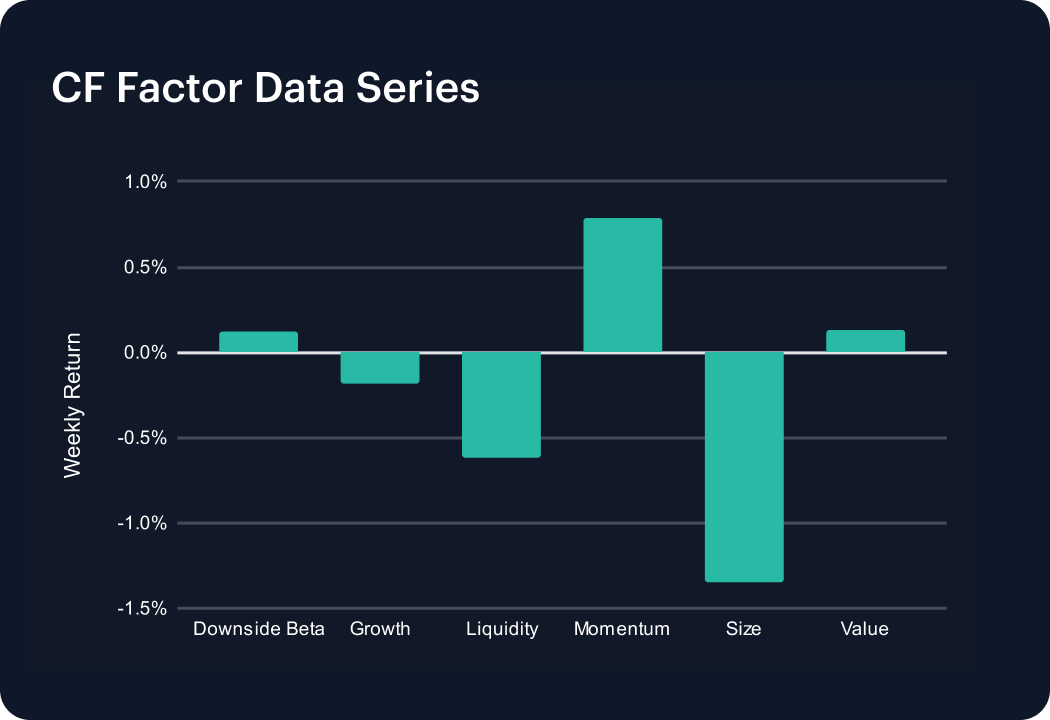
Factors Analysis
Factor returns pointed to a cooling of the prior week’s pro-risk tilt, with most styles delivering smaller absolute moves and some reversing sign. Downside Beta fell from 0.85% to 0.12%, and Growth swung from +0.47% to -0.19%, while Momentum decelerated from +2.01% to +0.79%. On the defensive side, Liquidity weakened further from -0.21% to -0.61%, implying underperformance of less liquid names, but Size improved from -2.00% to -1.35%, and Value flipped from -1.58% to a slightly positive +0.13%. The net configuration suggests investors trimmed high-octane trend and growth expressions but did not rotate aggressively back into downside protection; instead, they favored larger, more fundamentally grounded assets at the margin, while continuing to de-emphasize illiquid segments. In short, the factor tape reads as risk still being pared back, but in a measured fashion that rewards quality and value as opposed to crowded momentum.
The information contained within is for educational and informational purposes ONLY. It is not intended nor should it be considered an invitation or inducement to buy or sell any of the underlying instruments cited including but not limited to cryptoassets, financial instruments or any instruments that reference any index provided by CF Benchmarks Ltd. This communication is not intended to persuade or incite you to buy or sell security or securities noted within. Any commentary provided is the opinion of the author and should not be considered a personalised recommendation. Please contact your financial adviser or professional before making an investment decision.
Note: Some of the underlying instruments cited within this material may be restricted to certain customer categories in certain jurisdictions.
Changes to the Token Market Price Benchmarks Series - Market Prices – 21 July 2026
The Administrator has confirmed changes to the Token Market Price Family for the period 14 July 2026 to 21 July 2026.

CF Benchmarks
Softer CPI Reprices July Hike Risk & Lifts Digital Assets
Digital assets extended their recovery over the past week as cooler US inflation prints repriced Fed expectations; the bid was broad across the large cap indices, growth factor leadership returned, stablecoin funding repriced lower, and stress stayed isolated in names hit by token-specific news.
Mark Pilipczuk
Notice of the Demising of CF Dai-Dollar Settlement Price and Spot Rate
The Administrator announces that it will demise the CF Dai-Dollar Settlement Price (DAIUSD_RR) and CF Dai-Dollar Spot Rate (DAIUSD_RTI) which are members of the CF Digital Asset Index Family.
CF Benchmarks
By clicking Accept, you consent to CF Benchmarks's use of cookies.
Visit Cookie Settings to learn how CF Benchmarks uses cookies and to adjust your preferences.