
Apr 07, 2025
Weekly Index Highlights, April 7, 2025
Market Performance Update
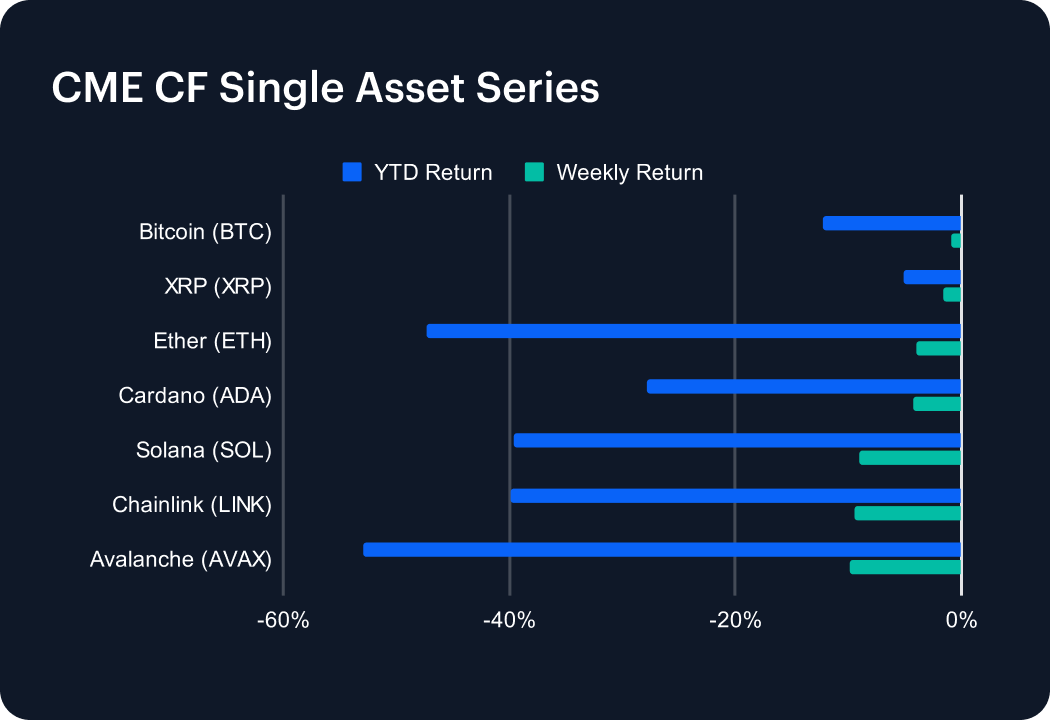
The digital asset market continued to face downward pressure this week, though losses were more moderate compared to previous sell-offs. Bitcoin (BTC) showed relative resilience, slipping just 0.89%, bringing its year-to-date (YTD) return to -12.25%. XRP followed with a 1.59% weekly decline, deepening its YTD loss to -5.15%. Ether (ETH) dropped 4.03%, widening its YTD deficit to -47.30%. Cardano (ADA) fell 4.22% this week, pushing its YTD performance to -27.82%. Solana (SOL) and Chainlink (LINK) posted steeper weekly losses of 9.08% and 9.52%, respectively, driving their YTD returns down to -39.67% and -39.85%. Avalanche (AVAX) led declines with a 9.87% drop, extending its YTD slump to -52.91%. Market sentiment remains cautious amid ongoing macroeconomic headwinds.
Sector Analysis
CF DACS sub-categories broadly declined this week, though a few tokens defied the trend. EOS stood out with a striking 18.36% gain in the General Purpose Smart Contract Platforms segment, followed by ATOM’s solid 6.81% rise. COMP also outperformed, jumping 10.15% in Borrowing & Lending segment. Meanwhile, major underperformers spanned several segments. BICO fell 16.37% in SDK & Tooling, and LPT dropped 16.05% in VR and AR. Scaling tokens saw sharp declines, led by TIA (-20.97%) and SKL (-17.39%). Meme Coins continued their slide, with WIF down -17.33% and RARI off -11.98%. INJ also retreated -10.67% within Specialized Purpose Smart Contract Platforms. Overall, despite a few bright spots, weakness across segments persisted.
Staking Metrics
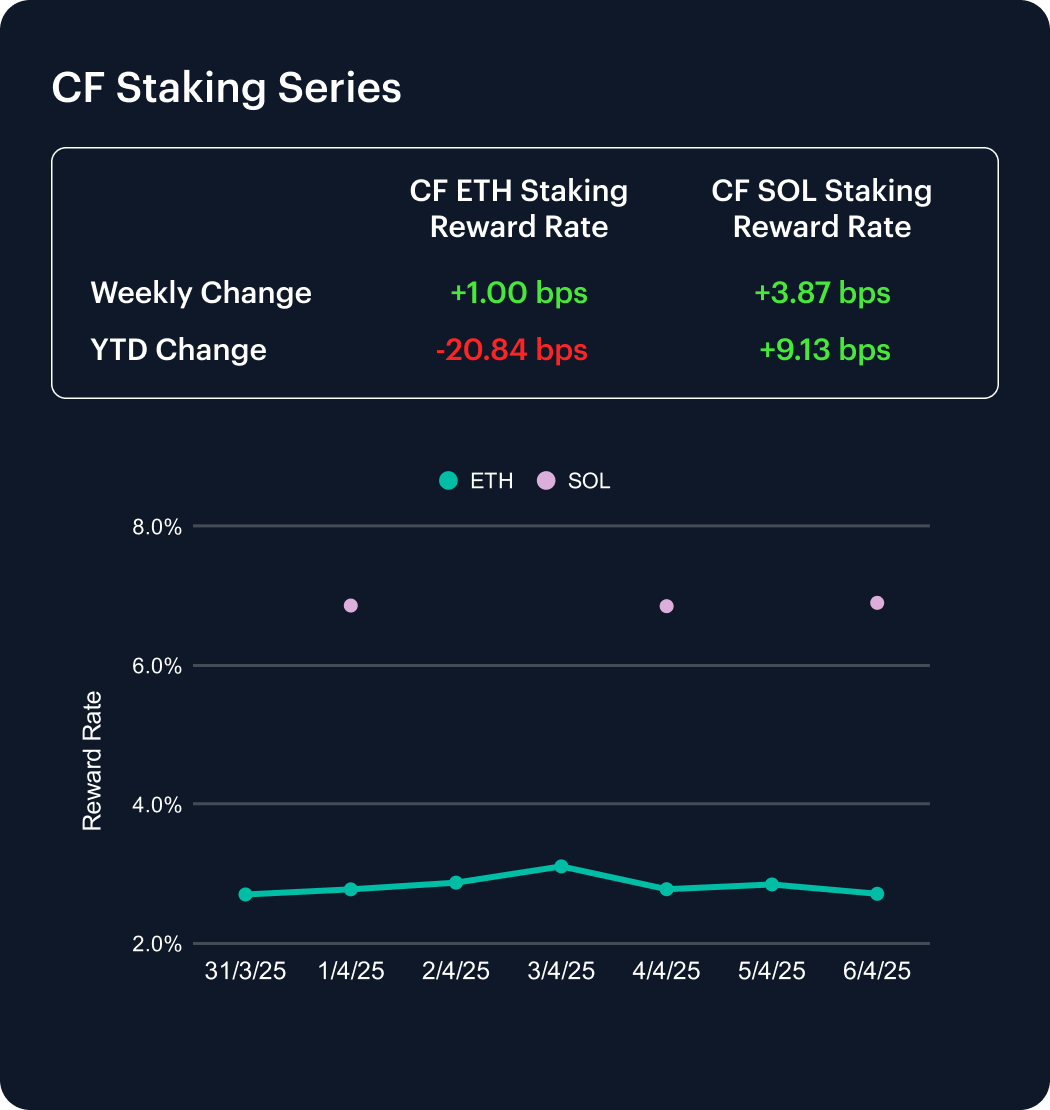
The CF Ether Staking Reward Rate Index (ETH_SRR) inched up by 1 basis point this week to 2.71%, marking a modest 0.37% gain. Despite this slight recovery, ETH_SRR remains down 20.84 bps year-to-date, reflecting a 7.13% cumulative decline.
In contrast, the CF SOL Staking Reward Rate Index (SOL_SRR) rose 3.87 bps to 6.90%, delivering a 0.56% weekly increase. SOL_SRR continues to trend upward in 2025, now up 9.13 bps YTD or 1.34%. These figures highlight ongoing compression in Ethereum staking yields, while Solana maintains steady outperformance, underscoring its resilience in a shifting staking landscape.
Market Cap Index Performance
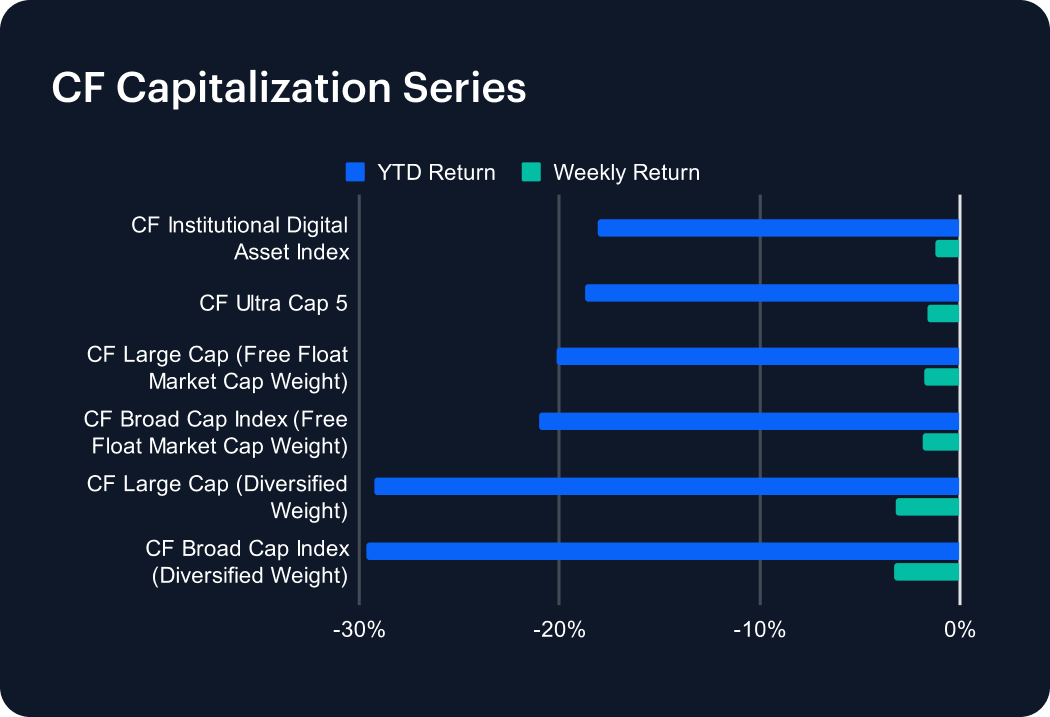
The CF Capitalization Series declined again this week, though losses were more contained compared to prior sell-offs. Diversified-weighted indices continued to underperform their free-float market cap-weighted counterparts. The CF Broad Cap Index (Diversified Weight) led losses with a 3.30% weekly decline, deepening its year-to-date (YTD) drawdown to -29.63%. The CF Large Cap Index (Diversified Weight) followed closely, falling 3.18% and extending its YTD loss to -29.28%. Among free-float market cap-weighted indices, the CF Broad Cap and CF Large Cap indices dropped 1.89% and 1.81%, respectively, with YTD returns now at -21.05% and -20.18%. The CF Ultra Cap 5 slipped 1.64%, while the CF Institutional Digital Asset Index declined 1.25%, reflecting a flight to large-cap tokens sentiment amid continued market volatility.
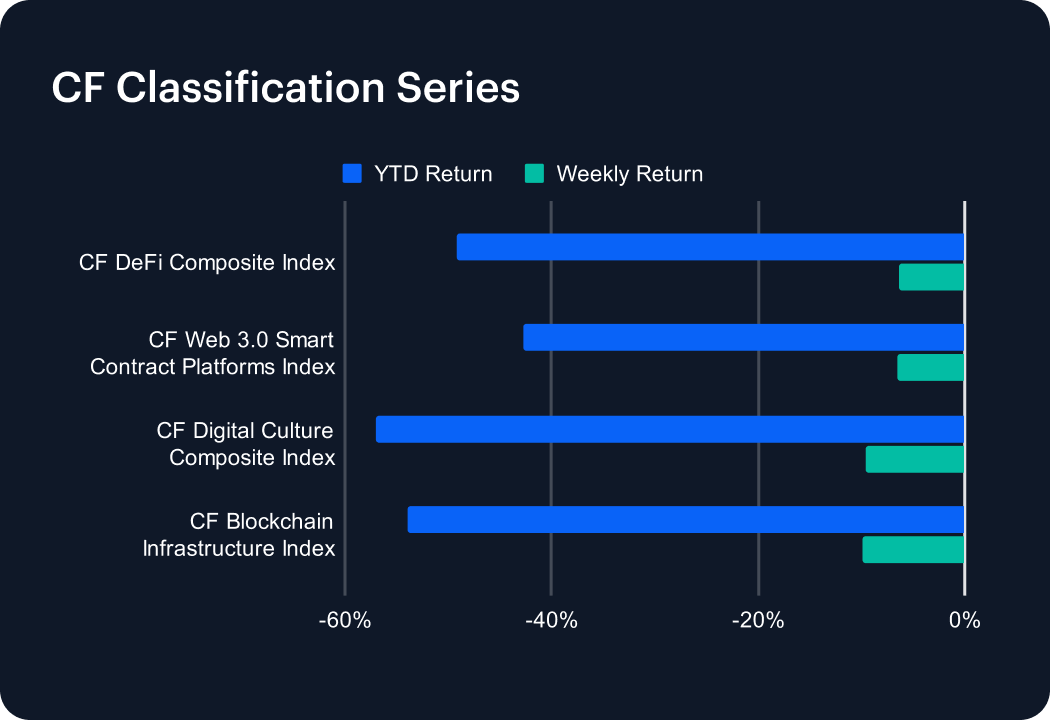
Classification Series Analysis
The CF Classification Series continued to decline this past week, with key digital asset verticals extending their losses amid persistent market weakness. The CF Blockchain Infrastructure Index led the pullback, dropping 9.94% weekly and deepening its year-to-date (YTD) loss to -53.96%. The CF Digital Culture Composite Index followed closely, falling 9.58% and pushing its YTD return to -57.04%, the steepest among the group. The CF Web 3.0 Smart Contract Platforms Index declined 6.48%, extending its YTD drawdown to -42.79%. Meanwhile, the CF DeFi Composite Index lost 6.44%, now down 49.15% YTD. These broad-based losses underscore continued investor aversion to small-cap and thematic digital assets, as risk appetite remains subdued across the crypto market landscape.
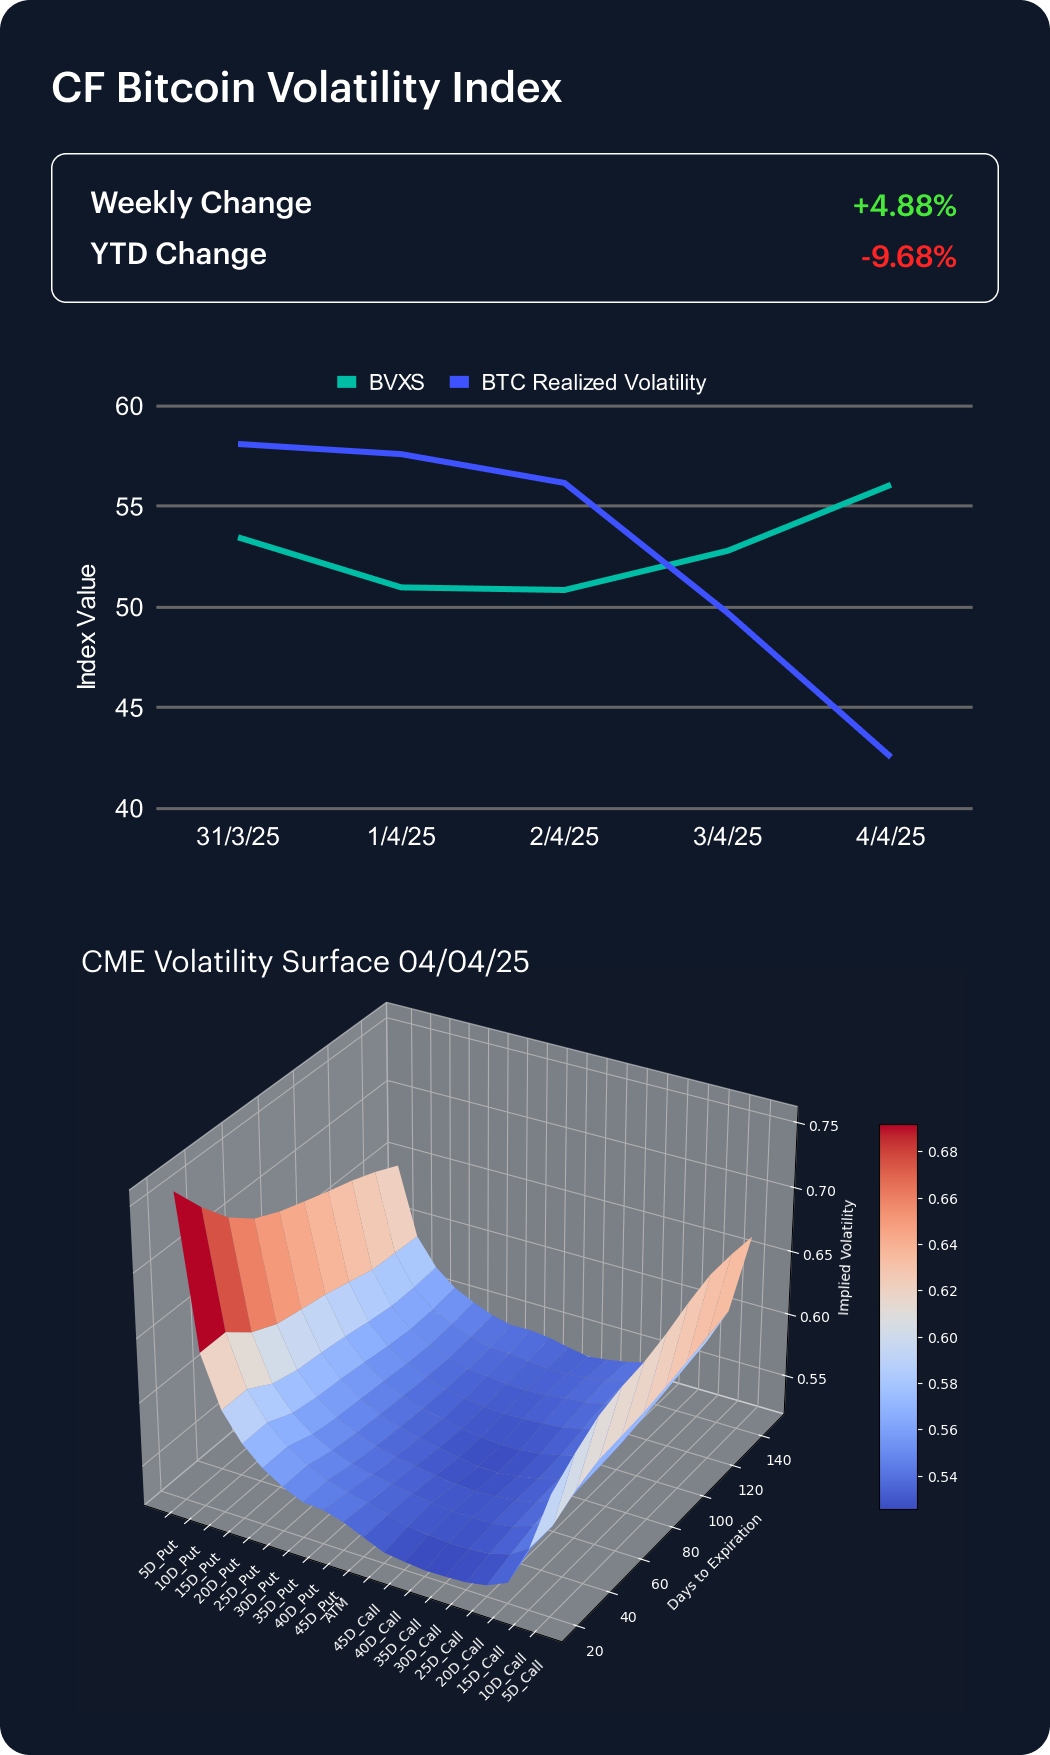
Volatility Analysis
The CF Bitcoin Volatility Index Settlement Rate (BVXS) rose by 4.88 percent over the past week, closing at 56.09 and reflecting a rebound in implied volatility. Despite the increase, the index remains down 9.68 percent year-to-date (YTD), signaling an overall decline in volatility expectations throughout 2025. In contrast, realized volatility fell sharply, dropping from 58.12 at the beginning of the week to 42.56, which indicates reduced short-term price fluctuations even as implied risk perceptions climbed.
Data from the CME Bitcoin Volatility Surface show that skews at the 10, 15, 20, and 25 delta levels remain negative, pointing to sustained demand for downside protection. This persistent skew, combined with elevated convexity, underscores ongoing investor caution and heightened sensitivity to potential sharp market moves in a still-uncertain macro and crypto environment.
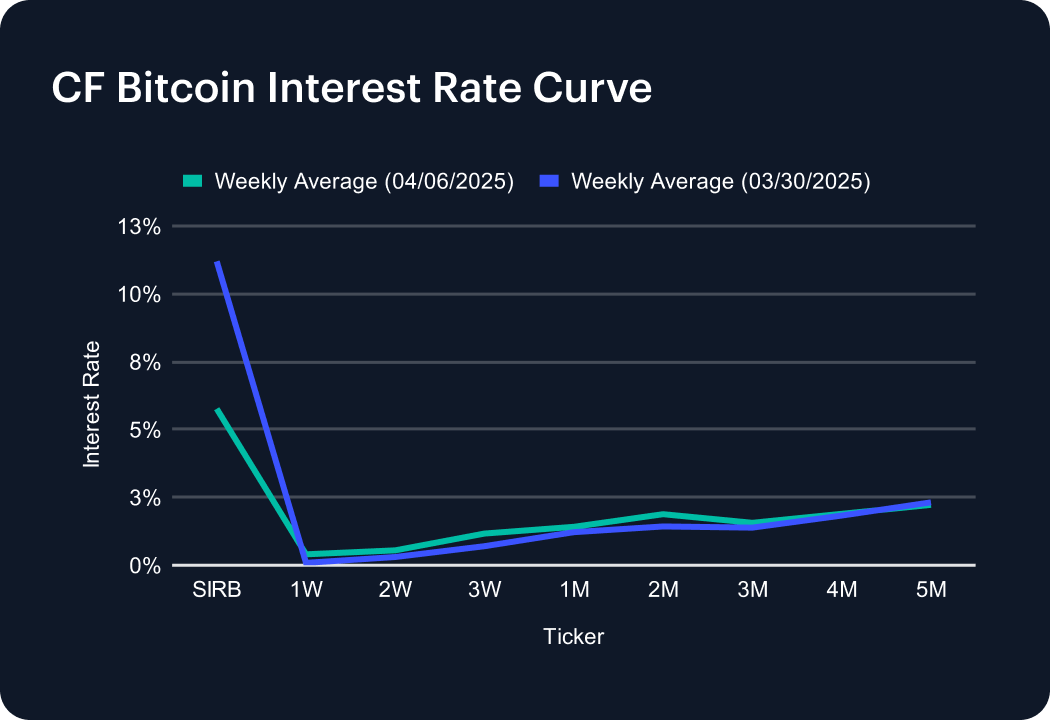
Interest Rate Analysis
The CF Bitcoin Interest Rate Curve shifted lower overall this past week, led by a sharp drop in short-term borrowing costs. The Short-Term Interest Rate Benchmark (SIRB) fell significantly to 5.77% from 11.20%, reflecting easing demand for immediate liquidity. In contrast, short-dated tenors rose modestly, with the 1-week rate increasing to 0.40%, the 2-week to 0.55%, and the 3-week to 1.17%. Medium-term rates also edged higher—4-month and 5-month tenors reached 1.89% and 2.22%, respectively—suggesting sustained interest in longer-duration borrowing. The curve’s shape points to a normalization in funding conditions, with investors cautiously extending exposure across maturities.
The information contained within is for educational and informational purposes ONLY. It is not intended nor should it be considered an invitation or inducement to buy or sell any of the underlying instruments cited including but not limited to cryptoassets, financial instruments or any instruments that reference any index provided by CF Benchmarks Ltd. This communication is not intended to persuade or incite you to buy or sell security or securities noted within. Any commentary provided is the opinion of the author and should not be considered a personalised recommendation. Please contact your financial adviser or professional before making an investment decision.
Note: Some of the underlying instruments cited within this material may be restricted to certain customer categories in certain jurisdictions.
Changes to the Token Market Price Benchmarks Series - Market Prices – 21 July 2026
The Administrator has confirmed changes to the Token Market Price Family for the period 14 July 2026 to 21 July 2026.

CF Benchmarks
Softer CPI Reprices July Hike Risk & Lifts Digital Assets
Digital assets extended their recovery over the past week as cooler US inflation prints repriced Fed expectations; the bid was broad across the large cap indices, growth factor leadership returned, stablecoin funding repriced lower, and stress stayed isolated in names hit by token-specific news.
Mark Pilipczuk
Notice of the Demising of CF Dai-Dollar Settlement Price and Spot Rate
The Administrator announces that it will demise the CF Dai-Dollar Settlement Price (DAIUSD_RR) and CF Dai-Dollar Spot Rate (DAIUSD_RTI) which are members of the CF Digital Asset Index Family.
CF Benchmarks
By clicking Accept, you consent to CF Benchmarks's use of cookies.
Visit Cookie Settings to learn how CF Benchmarks uses cookies and to adjust your preferences.