Oct 18, 2022
We need to talk about crypto oracles
CF Benchmarks’ index methodology makes attacks like the one that juiced Mango Markets virtually impossible
The attack that bilked $100m from DeFi trading platform Mango Markets is among the latest of a resurgent bout of exploits and hacks that's hit the space in recent weeks. This one though, was too juicy even for mainstream news outlets to resist.
With an unknown number of Mango Markets depositors out of pocket, the news is another salutary lesson in how not to calculate the price of a DeFi asset.
So, from our perspective as a regulated cryptocurrency Benchmark Administrator, we believe the details and implications are well worth examining.
What happened: the TL;DR
- Two accounts controlled by an attacker, funded with stablecoin USDC, took sizeable, long and short positions in Mango (MNGO) perps on the Mango Markets DEX
- The attacker then manipulated the price of MNGO on spot markets from which oracle network Pyth draws data to produce the MNGO price. (Note: Mango Markets sources its MNGO price from the Pyth network.)
- The attacker manipulated the Pyth MNGO price from around $0.04 to as high as $0.91
- Unrealized profits from the perp trades were then deployed on the Mango lending platform as collateral for a loan
- The attacker then withdrew funds amounting to c. $100m denominated in several tokens – the whole process appears to have taken half an hour to complete
- The net result is that the “incident has effectively resulted in a total draining of all equity available” for depositors on the platform, according to Mango itself
The latest
Mango said deposits were disabled as it investigated the incident whilst communicating with the perpetrator about the possible return of some funds in return for a bounty. @mangomarkets tweeted on October 15th that “$67M in various crypto assets have been returned to the DAO”. It’s not yet clear why or how these funds were returned, nor whether they may be distributed to depositors.
When illiquidity meets faulty pricing
The basic thing to know, in order to understand how and why the exploit occurred, is that MNGO is a relatively illiquid token. Whilst in fiat markets it would be ‘problematic’ to secure a loan collateralised against, say, OTC shares, it’s possible to do so in DeFi.
More to the point, with Mango Markets having been victim of a price manipulation attack, it’s the platform’s price arrangements that are in focus. We don’t think there’s much doubt now that these arrangements were very inadequate.
Mango Markets relied on prices distributed by a blockchain oracle to value the MNGO token.
The oracle, provided by Pyth Network, “focuses on sourcing continuous real-world and crypto-related market data originating off-chain and streaming it at sub-second speeds for smart contract consumption”.
Unfortunately, the methodology Pyth Networks deploys to achieve this involves inadequate safeguards for the pricing of a market-traded asset.
According to Pyth’s own documents, its prices are essentially aggregate prices. An aggregated price is simply the average of all prices within a stated window, including all traded prices from the beginning of the window till the end of the window—‘i.e., the Last Trade Price’.
This contrasts with the methodology utilised by CF Benchmarks for ‘streaming’ prices. We call these Real-time Indices (RTIs). They are updated every second.
Relevant Order Books and Constituent Exchanges
From a very high level, here’s the essence of what RTIs are in practice:
“CME CF Cryptocurrency Real Time Indices are calculated in real time, based on the Relevant Order Books of all Constituent Exchanges”
(From CME CF Cryptocurrency Real Time Indices - Methodology Guide, section 4.1 - Methodology).
The key term is ‘Relevant Order Books’, which as a concept, simply builds on the widely understood notion of an orderbook.
The CFB refinement is the use of “unmatched limit orders” to buy or sell an asset on a Constituent Exchange.
Relevant Order Books and Constituent Exchanges are two inviolable foundations (note: there are others) of the Benchmark Methodology for all assets we publish prices for. These foundations are subject to strictly enforced rules in themselves.
As stated however, they are just the foundations. Based on these foundations we can summarise how we calculate RTIs as follows:
RTIs are calculated from the mid-spread volume curve of the consolidated orderbook.
This is the first safeguard incorporated into our calculation Methodology. It makes the kind of exploit inflicted on the Mango price virtually impossible to inflict on a CF Benchmarks Real Time Price.
In other words, for an attacker to successfully manipulate an aggregate price, they simply need to somehow bid up the ‘Last Trade Price’ to profit from the manipulation.
To successfully manipulate a CFB Real Time Index, an attacker must own all bids on the orderbook across all Constituent Exchanges—and do so for the length of time needed to complete the exploit, thereby running the risk that their orders are matched.
Furthermore, to maintain the manipulation, let us say for 30 minutes, the attacker would need a significant sum of capital, and be willing to risk it, by essentially throwing good money after bad to elevate the price.
Threat Screening, by Mathematics
All the above said, while we are confident of our calculation design, we are not overconfident about it.
That is why the CF Benchmarks Real Time Index methodology also incorporates a live process of automated ‘threat screening’ that prevents potentially manipulated price data from entering our indices.
Within the methodology, such price data are referred to as Potentially Erroneous Data.
In essence, the policy is simple:
- Mid-prices of each individual Constituent Exchange’s orderbook are continuously monitored
- If any price from one orderbook deviates from the mean of prices of other Relevant Order Books, that Constituent Exchange’s orderbook is omitted from the index calculation entirely
It’s important to stress that while this screening process observes orderbook mid-prices, mid-prices are not part of the index calculation methodology.
It is at the individual Constituent Exchange level that mid-prices are triaged by this process, so that any price data that may have been subject to manipulation are eliminated before they reach the index calculation stage.
The parameter of deviation can vary depending on specific characteristics of the asset, particularly how liquid it is. For a token like MNGO, the parameter would typically be set at the relatively wide level of 25%. For more liquid tokens, the parameter would be narrower. For Bitcoin, for instance, the band is set at 10%.
This ongoing screening means that any would be attacker attempting to manipulate a single market for which CF Benchmarks provides an index, would not be able to move the value of that index.
Proof of the Mango Pudding
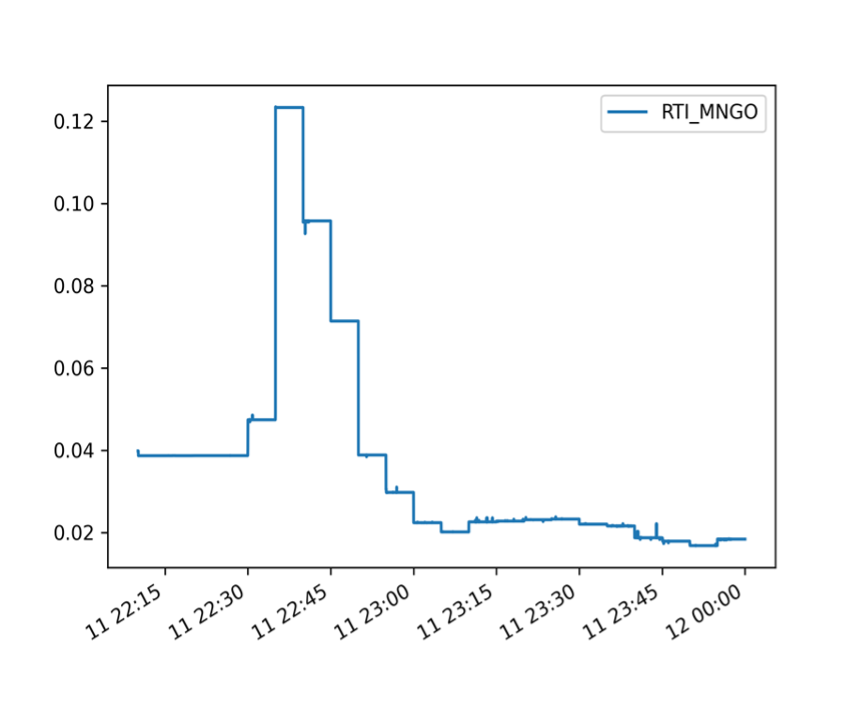
As a further demonstration of the efficacy of our Benchmark Methodology, and its ability to resist the manipulation that the MNGO token succumbed to, we have created a hypothetical MNGO index.
This exercise comes with an important proviso: CF Benchmarks does not calculate a MNGO index on an ongoing basis. This is chiefly because we deem the MNGO token to be too illiquid to be investible, a critical criterion of benchmark eligibility.
That said, an index of observable MNGO market data covering the period of the attack, calculated by CF Benchmarks’ Real Time Index methodology, produces the chart below.

The chart is rendered at a resolution of 15-minute intervals covering 22:15 UTC to 23.59 UTC, October 11, 2022.
Although not shown exactly, we can see that the simulated CFB MNGO price would have peaked somewhat above $0.12, sometime between 22:30 UTC and 22.45 UTC.
Where MNGO exploit prices?
Now, we need to compare this chart with a MNGO chart based on PYTH Network prices at the time of the exploit. However, sourcing such data retrospectively is problematic. At the time of writing there were, understandably, no MNGO prices at all on the Mango Markets DEX.
On other platforms, where prices of the token at the time of the attack remain visible, it appears prices may have been retroactively ‘adjusted’ to exclude manipulated data. Many of these platforms no longer display MNGO prices around that time as high as $0.91.
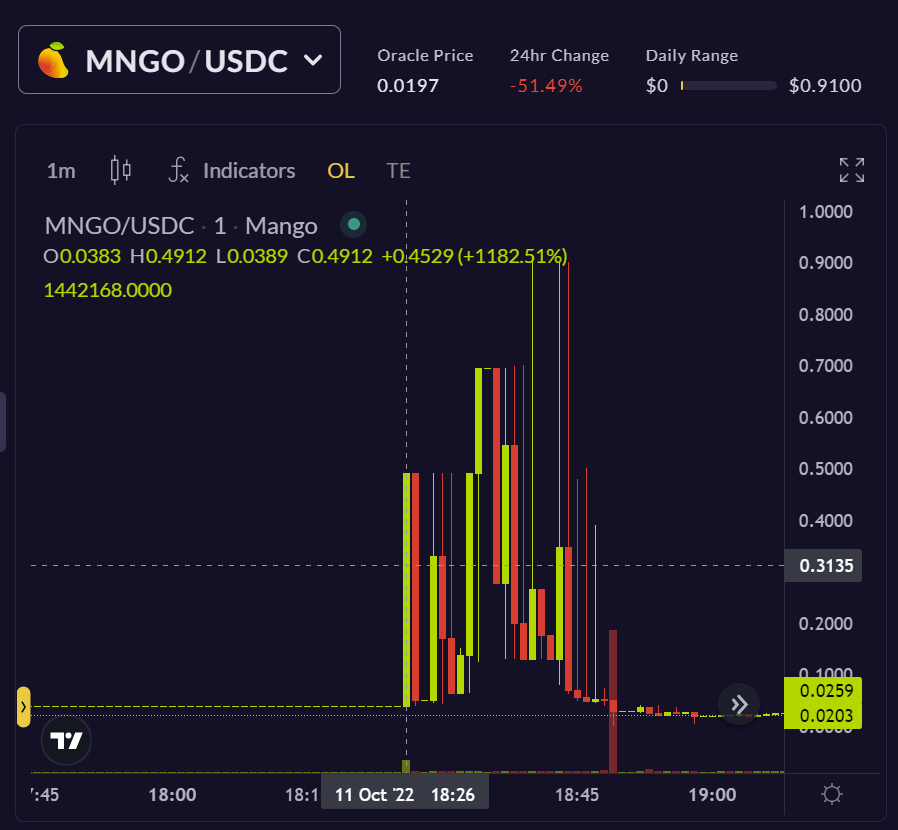
Fortunately, at least for the record, there are plenty of screen grabs available of the MNGO price during the attack.
The image below is a snapshot from the Mango Markets platform itself, with the date and time clearly visible. The asset pair depicted is MNGO-USDC. As stated, USDC is the stablecoin valued at approximately $1.

The timezone is EST, which is currently four hours behind UTC. Therefore, according to the chart image, MNGO was peaking around $0.90/$0.91 a little before 22:45 UTC.
The price disparity vs. CFB-calculated MNGO prices is obvious. And although, MNGO reached $0.90 -$0.91 only momentarily, it’s also clear prices were abnormally elevated for a longer spell of about fifteen minutes, relative to the CFB price.
Conclusion: No short cuts
This comparison makes clear that safeguards and mechanisms inherent in CF Benchmarks’ index calculation methodology would almost certainly have prevented the aberrant MNGO price behaviour witnessed on October 11th.
The upshot is that an attacker would have to put such an exponentially high amount of capital at risk to move a CF Benchmarks MNGO RTI as to make the economics of the manipulation absurd.
The Mango episode shows once again that there are no short cuts available when calculating and publishing reliable, high integrity prices that can be depended upon for important functions like collateral valuation and derivatives pricing.
On the contrary, only 100% focus on a watertight calculation methodology, and just as importantly, vigilance on the use cases of a pricing benchmark within the wider crypto ecosystem, can ensure it is fit for purpose.
Learn more about CF Benchmarks' Real Time Index Methodology
Read about the latest audit of CF Benchmarks' operational, governance and technology policies
The information contained within is for educational and informational purposes ONLY. It is not intended nor should it be considered an invitation or inducement to buy or sell any of the underlying instruments cited including but not limited to cryptoassets, financial instruments or any instruments that reference any index provided by CF Benchmarks Ltd. This communication is not intended to persuade or incite you to buy or sell security or securities noted within. Any commentary provided is the opinion of the author and should not be considered a personalised recommendation. Please contact your financial adviser or professional before making an investment decision.
Note: Some of the underlying instruments cited within this material may be restricted to certain customer categories in certain jurisdictions.
CF Benchmarks Newsletter Issue 100
Product news is led by CME Group's launch of three new crypto futures contracts and BlackRock's filing for the iShares Premium-Income Bitcoin ETF.

Ken Odeluga
CME Launches CFB-Powered Cardano, Chainlink and Lumens Futures
CME adds Cardano (ADA), Chainlink (LINK) and Lumens (XLM) to its suite of CF Benchmarks-settled crypto futures.

CF Benchmarks
Weekly Index Highlights, February 9, 2026
Risk aversion deepened further during the recent week as majors fell hard again, with Bitcoin -9.4%, Ether -10.5%, and Solana-16.1%. Our BVXS implied volatility gauge repriced defensively, while BTC front-end funding surged. Among more positive outcomes, APT Staking bucked the tape, +17.9%.

CF Benchmarks