CF Benchmarks
CF benchmarks logo

Jul 09, 2023

The ETH/BTC Ratio through time

The Ether to Bitcoin price ratio, or ETH/BTC ratio, is a metric that reflects the relative value of Ethereum to Bitcoin. It serves as an indicator of market sentiment, guiding investment decisions by showing which of the two leading cryptocurrencies is currently favored. The ratio may aid in portfolio management decisions, suggesting when to rebalance based on the relative performance of Ethereum and Bitcoin. It may also present potential trading opportunities when the ratio diverges from its historical average, providing insights into the market dominance between the two largest cryptocurrencies.

Over the past 5 years, several headlines and milestones can be highlighted:

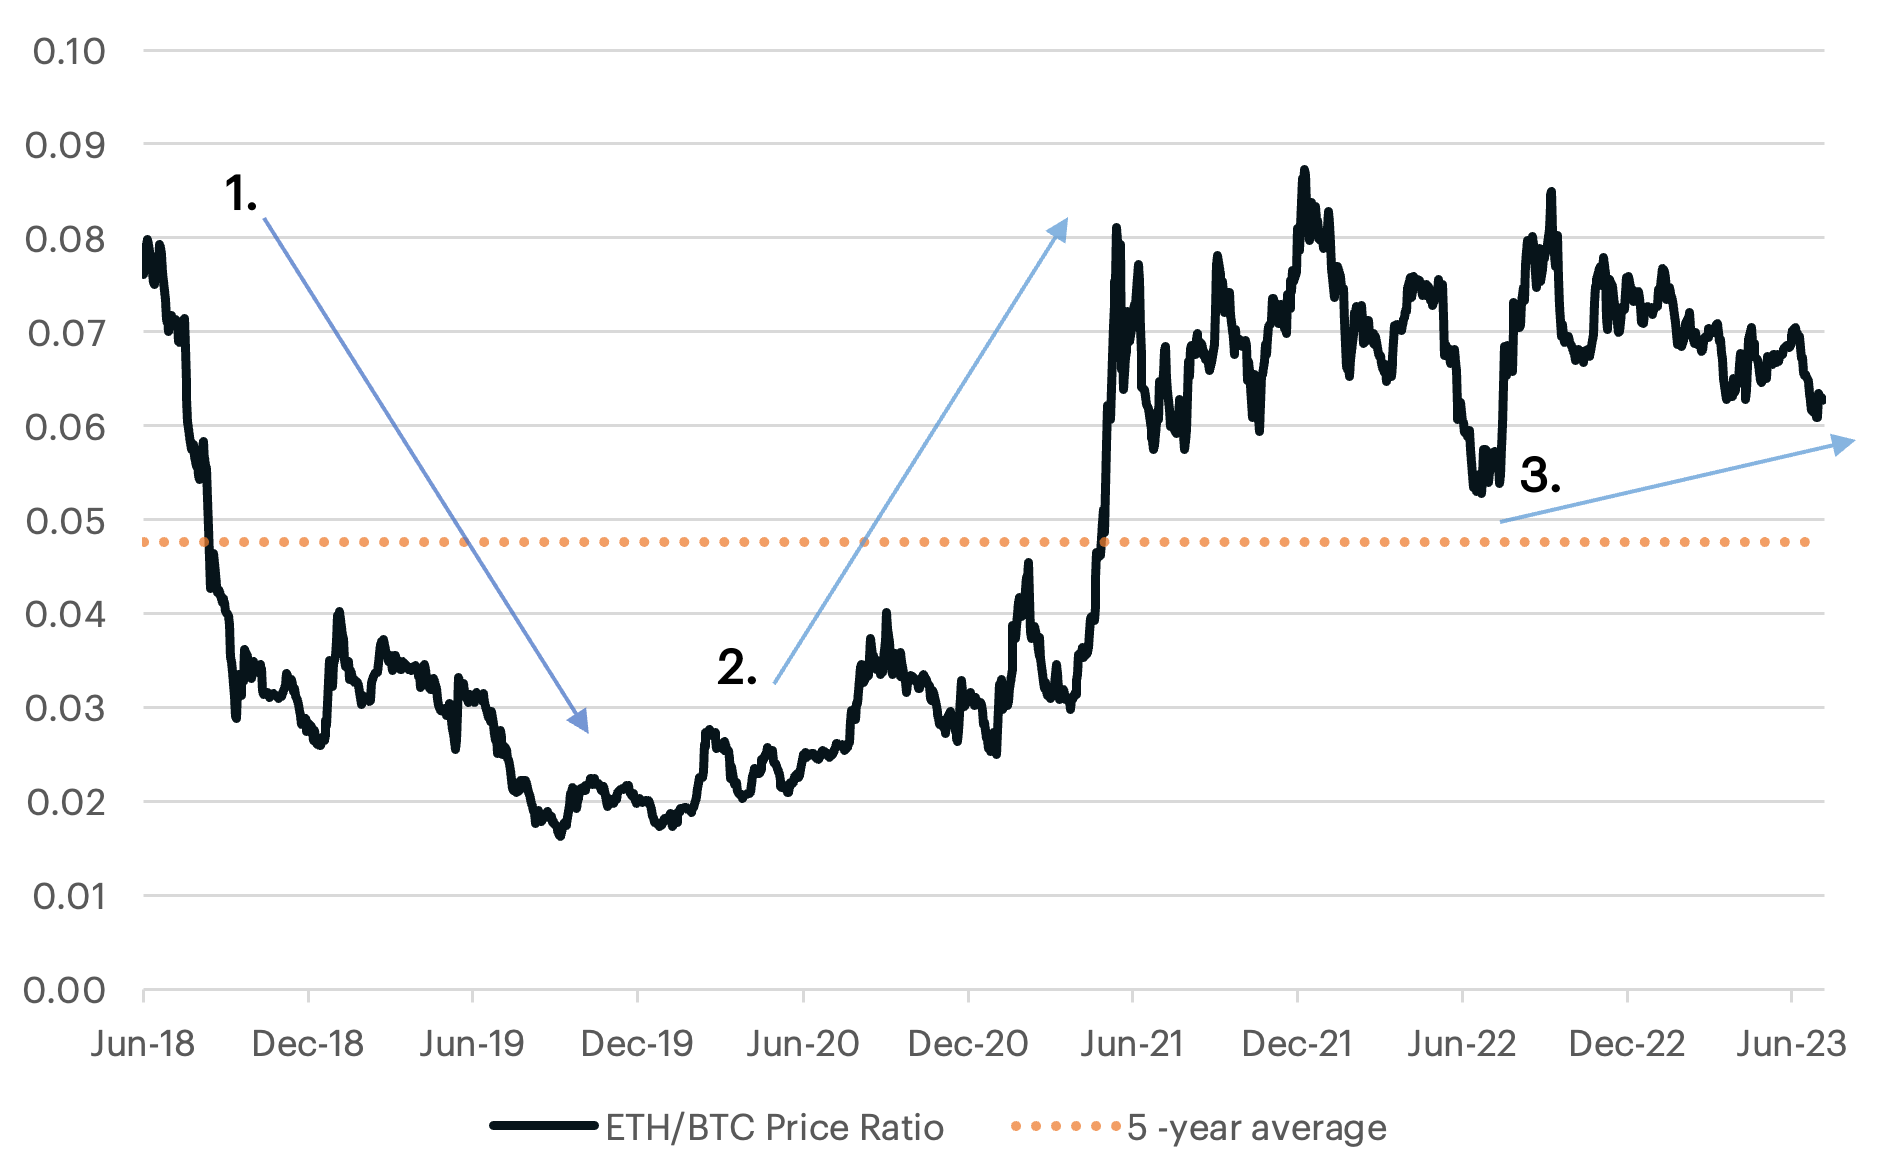
1). In 2018, the crypto winter led to defensive price action, and the ETH/BTC ratio experienced a significant decline, reaching its lowest levels for that year. The ratio had been steadily decreasing since May, when it peaked at about 0.084. By December, the ratio was at about 0.026. This decline began to stabilize at the turn of the new year as bullish sentiment ignited the next bull-market cycle. However, the ratio remained suppressed due to a broader trend of Bitcoin steadily increasing its dominance in the cryptocurrency market.

2). In mid-2020, DeFi Summer formed a major catalyst for a turning point in the ETH/BTC ratio as the development of decentralized apps (DApps) provided a new fundamental driver for relative ETH strength. The emergence of more DApps increased demand for Ether, making it the most popularly used programmable blockchain in the world. The subsequent bull market run sparked further momentum. Ether's price continued to hold its relative value throughout 2021, reaching a new peak in the ratio value at approximately 0.087.

3). More recently, the ratio has been mostly range-bound. The announcement of Ethereum's network proof-of-stake update in mid-2022 lifted the ratio from the 0.05 area to a near-record high in September 2022. However, continued bearish price action throughout the remainder of the year led to some pairing of Ether's relative price gains.

As the industry prepares for the next wave of institutional adoption with the CME's launch of ETH to BTC Ratio Futures, this price ratio will continue to provide useful insights for practitioners and market participants.

Graph displaying the ETH/BTC price ratio and the 5-year average
Source: CF Benchmarks, Bloomberg, as of July 6, 2023

The information contained within is for educational and informational purposes ONLY. It is not intended nor should it be considered an invitation or inducement to buy or sell any of the underlying instruments cited including but not limited to cryptoassets, financial instruments or any instruments that reference any index provided by CF Benchmarks Ltd. This communication is not intended to persuade or incite you to buy or sell security or securities noted within. Any commentary provided is the opinion of the author and should not be considered a personalised recommendation. Please contact your financial adviser or professional before making an investment decision.


Note: Some of the underlying instruments cited within this material may be restricted to certain customer categories in certain jurisdictions.


Factor Friday - April 10, 2026

The market posted its strongest week of 2026 at +7.1%. However, factor breadth was notably thin. Size was the only non-market factor to finish positive at +1.3%, while growth and value lagged, suggesting the rally was driven by directional flows rather than fundamentals.

Mark Pilipczuk
Mark Pilipczuk

Mark Pilipczuk

9 mins read
CFB Talks Digital Assets Episode 56: Live X Space - Bitcoin In Crisis

Head of Research Gabe Selby, CFA is joined by Kraken's Chief Economist Thomas Perfumo, CFA, CF Benchmarks Research Analyst, Mark Pilipczuk, and Senior Product Manager, Cristian Isac.

Ken Odeluga
Ken Odeluga

Ken Odeluga

1 mins read
Announcement of Consultation on Changes to the CME CF Bitcoin Volatility Index - Settlement Methodology

The Administrator is launching a consultation on proposed changes to the CME CF Bitcoin Volatility Index - Settlement (BVXS) Methodology.

CF Benchmarks
CF Benchmarks

CF Benchmarks

1 mins read

Footer

Subscribe to our newsletter

The latest news, articles, and resources, sent to your inbox weekly.

By submitting this form, you agree to our Terms of Service and Privacy Policy.

Already subscribed? Manage your preferences

© 2026 CF Benchmarks Ltd. All rights reserved.

CF Benchmarks Ltd (“CF Benchmarks”), a company registered in England and Wales with company number 11654816 and authorised and regulated by the Financial Conduct Authority. Information about us can be found on the Financial Services Register (register number 847100).

Registered Office: 6th Floor One London Wall, London, United Kingdom, EC2Y 5EB.

You agree not to, and have no rights to, use the CF Benchmarks Data to create, calculate, issue, settle, maintain, support or develop any financial instruments (including but, without limitation exchange traded products, certificates, warrants, contracts for difference, swaps, binary options, structured products), indices, products, services (including but without limitation, portfolio management services, pre- and post-trade risk management services, or valuation services) or any other derivative works without the express written consent of CF Benchmarrks.

You agree not to analyze, reverse-engineer or disassemble any CF Benchmarks data and not to insert any code or product to manipulate the Website content in any way that affects any user’s experience. Unless CF Benchmarks gives you prior written permission, use of any Web browsers (other than generally available third-party browsers), engines, scripts, software, spiders, robots, avatars, agents, tools or other devices or mechanisms (such as crawlers, browser plug-ins and add-ons, or other technology) to navigate, access, copy in bulk, retrieve, harvest, index, search or analyse any portion of the Website is strictly prohibited.

No part of this information may be reproduced, stored in a retrieval system or transmitted in any form or by any means, electronic, mechanical, photocopying, recording or otherwise, without prior written permission of CF Benchmarks Ltd. Use and distribution of the CF Benchmarks data requires a license from CF Benchmarks or its authorized licensing agents.

All information is provided for information purposes only. All information and data contained on this website is obtained by CF Benchmarks, from sources believed by it to be accurate and reliable. Such information and data is provided "as is" without warranty of any kind.

CF Benchmarks, nor its directors, officers, employees, partners or licensors make any claim, prediction, warranty or representation whatsoever, expressly or implied, either as to the accuracy, timeliness, completeness or merchantability of any information or of results to be obtained from the use of the CF Benchmarks indices or the fitness or suitability of the same indices for any particular purpose to which they might be put. Any representation of historical data accessible through CF Benchmarks indices is provided for information purposes only and is not a reliable indicator of future performance.

No responsibility or liability can be accepted by CF Benchmarks nor their respective directors, officers, employees, partners or licensors for any loss or damage in whole or in part caused by, resulting from, or relating to any error (negligent or otherwise) or other circumstance involved in procuring, collecting, compiling, interpreting, analysing, editing, transcribing, transmitting, communicating or delivering any such information or data or from use of this website or links to this website.

CF Benchmarks and its respective directors, officers, employees, partners or licensors do not provide investment advice and nothing accessible through CF Benchmarks, should be taken as constituting financial or investment advice or a financial promotion. Charts and graphs are provided for illustrative purposes only. Index returns shown may not represent the results of the actual trading of any assets.

CF Benchmarks is a member of the Crypto Facilities group of companies which is in turn a member of the Payward, Inc. group of companies.
  • Payward, Inc. is the owner and operator of the Kraken Exchange, a venue that facilitates the trading of cryptocurrencies. The Kraken Exchange is a source of input data for certain CF Benchmarks indices.
  • Payward, Inc. is the owner and operator of the Staked, a venue that operates the block production nodes for decentralized PoS protocols on behalf of institutional investors. Staked.us is a source of input data for certain CF Benchmarks indices.

Please refer to the individual product family documentation for more information about applicable input data sources.

By clicking Accept, you consent to CF Benchmarks's use of cookies.

Visit Cookie Settings to learn how CF Benchmarks uses cookies and to adjust your preferences.