
Feb 22, 2021
The CME CF Ether-Dollar Reference Rate: Integrity Defined
Our latest research confirms that the CME CF Ether-Dollar Reference Rate (ETHUSD_RR) is the most trustworthy Ether market, with prices that are consistently achievable at an institutional scale

Trading of the CME Group’s new Ether Futures contract, which settles to the regulated CME CF Ether-Dollar Reference Rate (ETHUSD_RR) is off to a solid start. 1,856 contracts were traded in CME Ether's first week, worth around 92,000 Ether. It's a promising gradient of early volume growth that backs the view that institutional participants have been chomping at the bit to participate in the market of the second-largest cryptocurrency.
Looking at the expansion of the DeFi market—which owes almost all its existence to Ethereum’s ERC-20 protocol—part of the impetus behind demand for Ether is obvious. It’s worth noting that, in partnership with the CME, CF Benchmarks launched ETHUSD_RR as early as May 2018. Therefore, there’s good reason to assume that the timing of the exchange’s launch of Ether futures, almost three years later, was deemed to be optimal.
What’s more, the CME’s decision to go ahead with the launch on 8th February was in itself an endorsement of the integrity, representativeness and accuracy of the Ether market that underpins ETHUSD_RR: ETHUSD_RR Constituent Exchanges. After all, both the Constituent Exchange criteria and the overarching index methodology upheld by CF Benchmarks are an obligation of its role as an EU-authorised Benchmark Administrator, with active oversight by the UK’s FCA, an arrangement that the EU has confirmed will continue on an equivalent basis now that Britain has left the European Union.
It was by way of continuation of these rigorous policies that we decided to undertake a comprehensive examination of the qualities and capabilities of the Ether-Dollar Reference Rate, and then to publish the results in a formal paper that would remain available ‘on the record’ for scrutiny.
What’s the paper about and why did we publish it?
- The paper describes how Ether purchases at an institutional scale can be transacted at the CME CF Ether-Dollar Reference Rate price. The ETHUSD_RR is published and administered by CF Benchmarks, the only cryptocurrency Benchmark Administrator authorised under the EU’s Benchmark Regulation regime (EU BMR) and regulated by the UK Financial Conduct Authority. The Benchmark Regulation regime subjects CF Benchmarks to the same scrutiny and controls as providers of traditional financial market benchmarks like ICE LIBOR, SONIA and ICESWAP. Likewise, CF Benchmarks is subject to active oversight and supervision by the UK’s financial regulator the FCA
- This official accreditation requires CF Benchmarks to satisfy rigorous standards and be subject to ongoing scrutiny. The ultimate aim of this scrutiny is to ensure the market and price integrity of the CF Benchmarks instruments that regulators have ascribed Benchmark status to. To corroborate the ETHUSD_RR market and its price integrity even further, the paper also details an audit of CF Benchmarks’ Control Procedures with respect to EU BMR
- The ETHUSD_RR is the only Ether price provided by an authorised Benchmark Administrator. Hence, due to the index’s transparent and regulated status, it follows that users of the ETHUSD_RR can have full confidence that it is an Ether price with the highest possible standards of price and market integrity
- Given that institutional market participants and financial product providers are obligated by regulation to participate in or offer products based only on regulated markets with price and market integrity, the process by which Ether can be bought at the ETHUSD_RR price at institutional scale is as much of a breakthrough as results described for The Bitcoin Reference Rate in another paper we published in December
An empirical evaluation of ETHUSD_RR in a nutshell
- Conducted an exhaustive analysis of Constituent Exchange trading volumes
- Measured cross-exchange price deviation
- Modelled massive daily purchases of Ether for 366 consecutive trading sessions
Key findings and takeaways
ETHUSD_RR input prices from Constituent Exchanges are highly correlated:
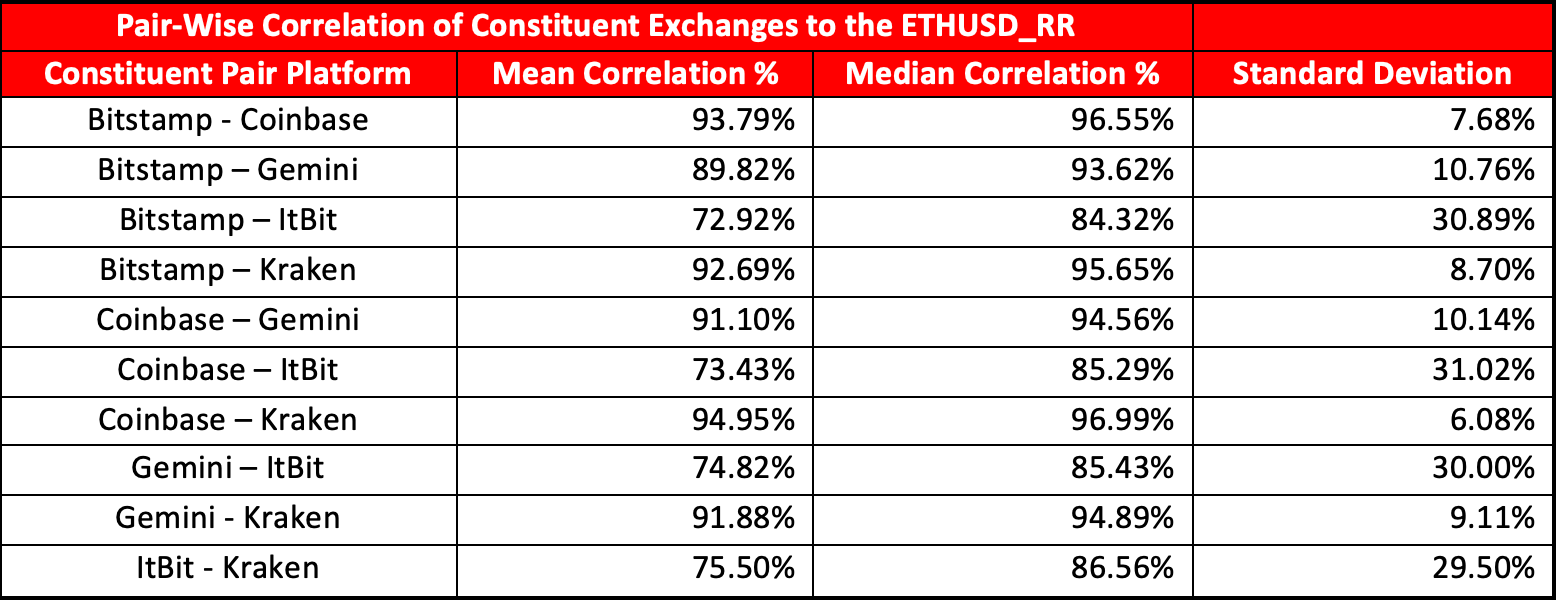
An analysis was undertaken of the pair-wise correlation of prices from Constituent Exchanges on a per-minute basis (the price difference between transactions for each minute at each exchange) during the 366-day observation period. The data are summarised in the table below.
Pair-wise correlation of ETHUSD_RR Constituent Exchange
 Source: CF Benchmarks
The clustering towards correlation coefficients of 1.00 demonstrate a strong price correlation between Constituent Exchanges.
In turn, the strong price correlation is evidence of a lack of manipulation within Constituent Exchange prices that might potentially have occurred on a smaller scale than would be captured by CF Benchmarks control procedures (such as the Potentially Erroneous Data Parameter) and to which the ETHUSD_RR is immune due to its aggregate construction. (Read an explanation of our Potentially Erroneous Data Parameter.) Takeaway: There’s solid evidence that ETHUSD_RR has not been subject to manipulation through manipulation of prices on individual Constituent Exchanges.
ETHUSD_RR comprises sufficient volume to be valid as a benchmark:
Note that on average 18,305.82 Ether were traded over an average of about 4,134 transactions, worth an average $5,829,964.62 during the one-hour observation window of 15.00 to 16.00 London Time. (Prices were contemporaneous with when the trades were observed.)
Takeaway: Although the paper acknowledges some uncertainty about the proportion of the broader Ether market represented by ETHUSD_RR, such uncertainty reflects broader unknowns about typical institutional transaction sizes. As well, there is strong evidence that institutional orders are typically conducted over multiple transactions anyway. On that basis, it is highly likely that the daily volumes found to be transactable at the ETHUSD_RR price will prove to be sufficient for most institutional purposes.
The ETHUSD_RR price is replicable:
Volume data summarised above represents evidence of the ‘achievability’ (another word for ‘replicability’) of the ETHUSD_RR price. However the paper also prescribed a close observation of much larger daily transaction volumes of Ether for the specific purpose of simulating the extent of ‘slippage'.
The exercise described in the paper was aimed at removing any lingering doubts about the ability of the ETHUSD_RR price to sustain multiple large-scale Ether purchases every day whilst remaining replicable to a high degree. Multiple purchases of Ether were simulated on each of the 366 observation days: the goal was to complete one purchase of Ether per second during a 3,600-second calculation window, until 500 Ether had been purchased.
Defining slippage as the percentage difference between the replication price and the ETHUSD_RR itself, results of the slippage analysis are presented in the graphic below.
Figure 2 - Slippage rates vs. ETHUSD_RR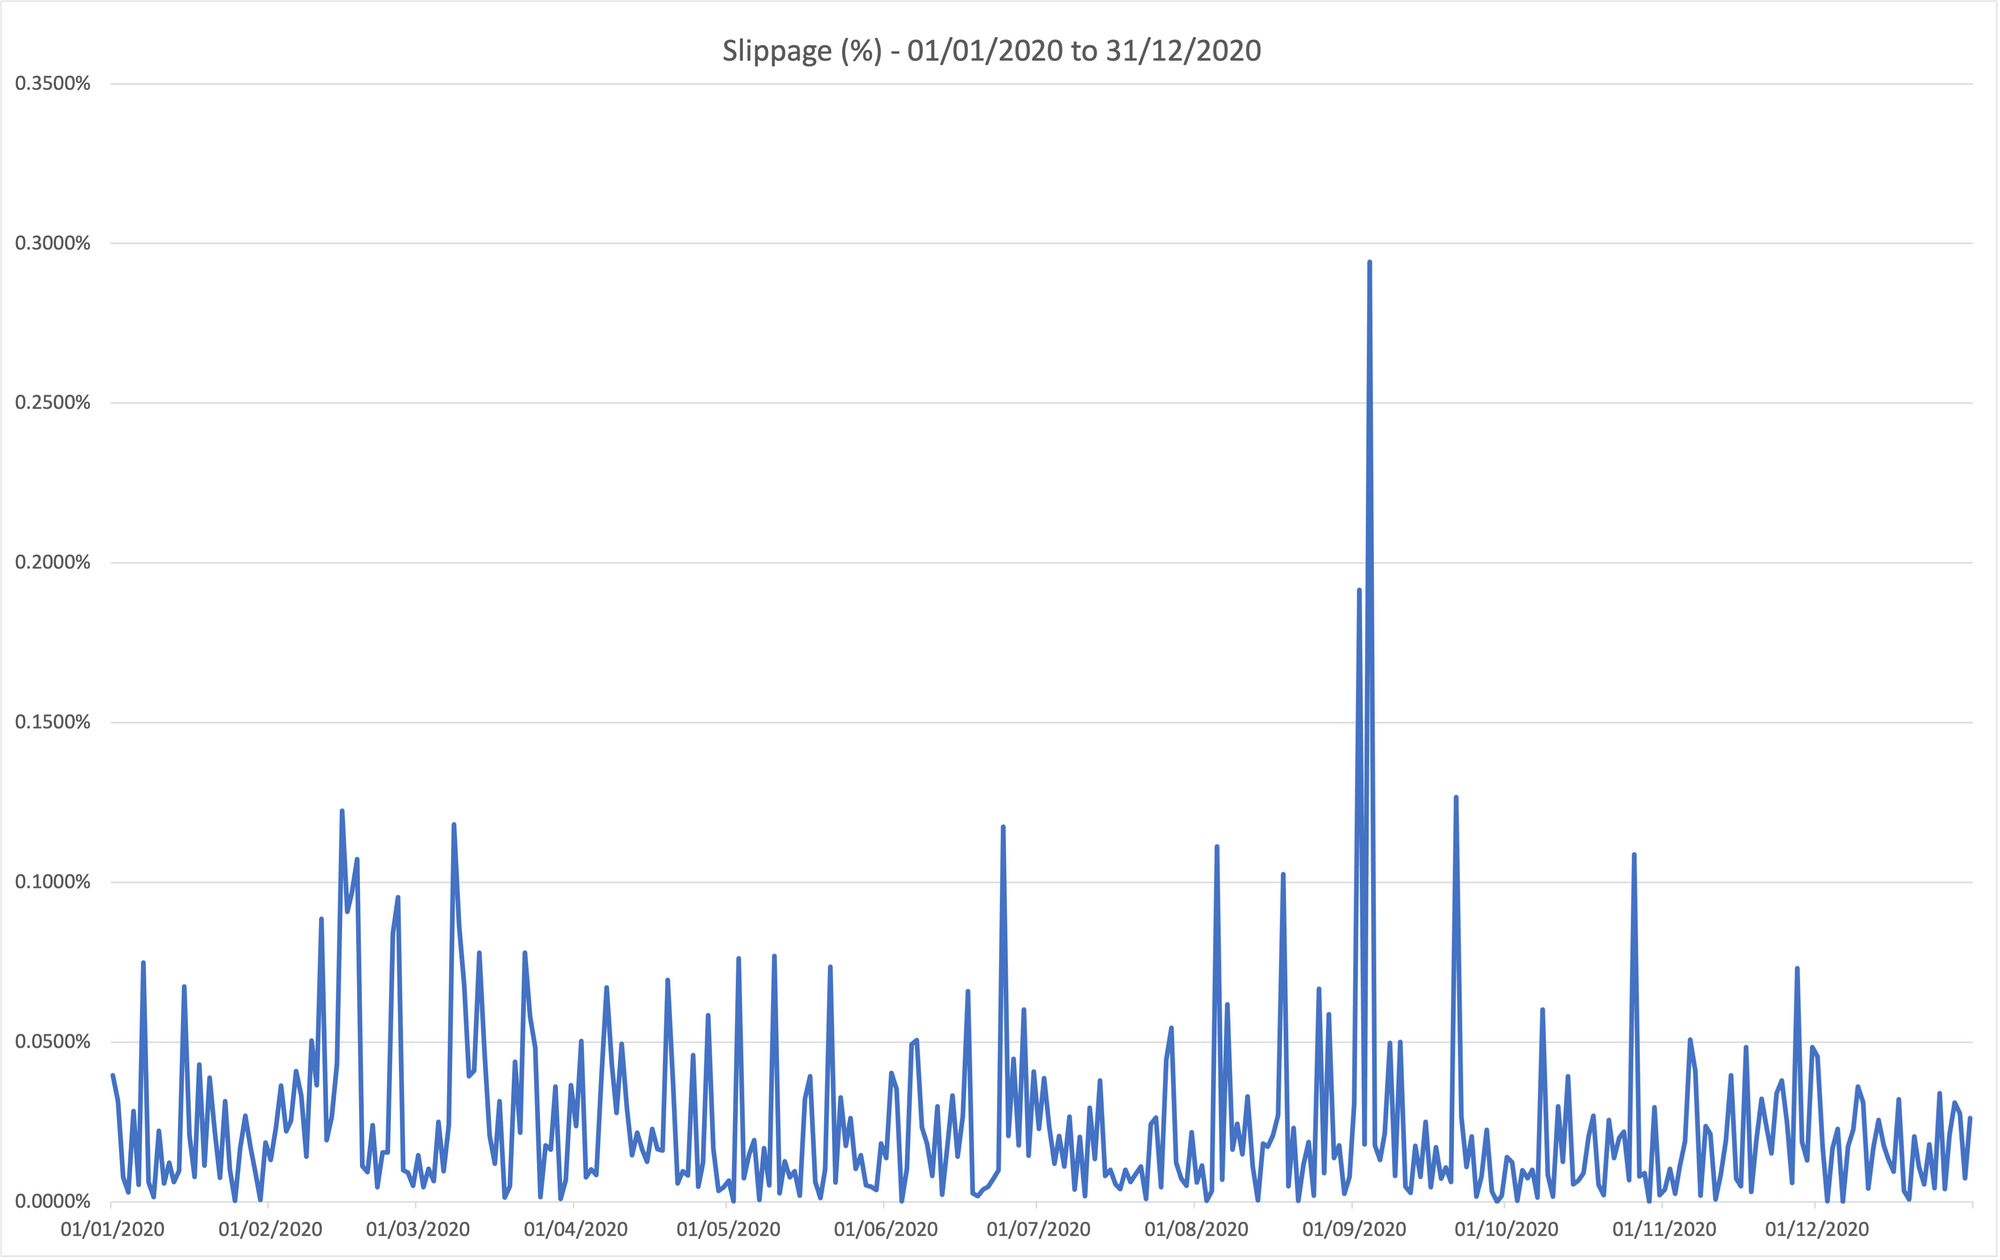 Source: CF Benchmarks
The chart’s obvious standout data point show’s an anomalous ~0.3% slippage on one day of the exercise in September 2020. That was the maximum slippage observed on a single day during the observation period with the remainder of values congregating approximately within the range of 0%-to-0.15%. Takeaway: slippage can be described as having been negligible during the observation period.
Conclusions
- Our research demonstrates that ETHUSD_RR answers a longstanding call from institutional product providers for a compliant Ether price that is replicable
- We’ve confirmed the existence of an Ether market with integrity and sufficient liquidity on which institutions can confidently base financial products
READ OR DOWNLOAD THE FULL RESEARCH PAPER: An evaluation of the CME CF Ether-Dollar Reference Rate as a benchmark for regulated financial products
FIND OUT MORE ABOUT THE CME CF ETHER-DOLLAR REFERENCE RATE: https://www.cfbenchmarks.com/indices/ETHUSD_RR
The information contained within is for educational and informational purposes ONLY. It is not intended nor should it be considered an invitation or inducement to buy or sell any of the underlying instruments cited including but not limited to cryptoassets, financial instruments or any instruments that reference any index provided by CF Benchmarks Ltd. This communication is not intended to persuade or incite you to buy or sell security or securities noted within. Any commentary provided is the opinion of the author and should not be considered a personalised recommendation. Please contact your financial adviser or professional before making an investment decision.
Note: Some of the underlying instruments cited within this material may be restricted to certain customer categories in certain jurisdictions.
Factor Friday - May 22, 2026
The market pulled back hard at -5.65%, the worst weekly drop of 2026. Growth and Value were the only positive factors, with fundamentals leading during the drawdown. Downside Beta fell, deviating from its pattern of resilience in earlier drawdowns.

Mark Pilipczuk
Outcome of Consultation on Changes to the CME CF Bitcoin Volatility Index - Real Time Methodology
The Administrator can now confirm it will implement all proposed changes to the CME CF Bitcoin Volatility Index - Real Time methodology.
CF Benchmarks
UPDATE: xStocks-Owner Payward Added to DTCC Tokenization Task Force
Two recent moves by the Depository Trust & Clearing Corporation (DTCC) have compelling implications for the evolution of tokenized equities broadly, and potentially for xStocks.
Ken Odeluga
By clicking Accept, you consent to CF Benchmarks's use of cookies.
Visit Cookie Settings to learn how CF Benchmarks uses cookies and to adjust your preferences.