
Jul 28, 2025
Weekly Index Highlights, July 28, 2025
Market Performance Update
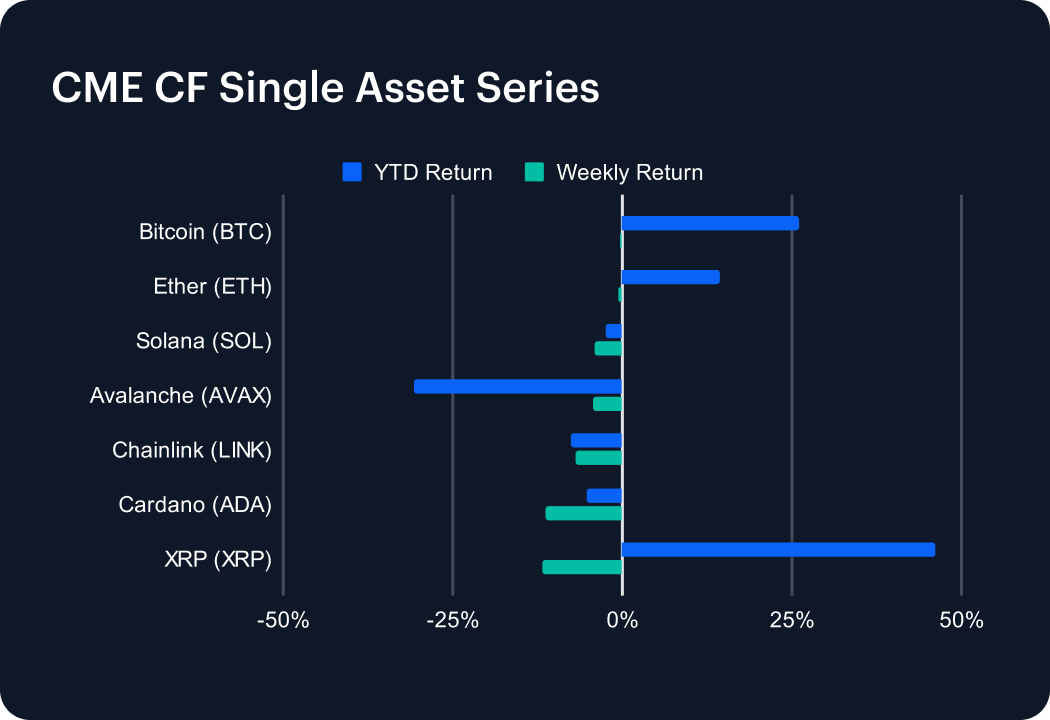
Crypto markets retreated last week, with all seven major tokens posting losses. Ether (ETH) dipped 0.67%, though its year-to-date return remained positive at 14.30%. Bitcoin (BTC) fell 0.45% but maintains a 25.99% gain for the year. Solana (SOL) slid 3.99%, narrowing its YTD drop to 2.39%. Avalanche (AVAX) lost 4.25%, bringing its decline to 30.79% YTD, while Chainlink (LINK) dropped 6.87%, widening its slide to 7.56%. Cardano (ADA) plunged 11.32%, extending its year-to-date loss to 5.34%. XRP (XRP) tumbled 11.87% yet still sits on a 46.12% gain for the year. Despite the broad pullback, the long-term outlook remains positive.
Sector Analysis
The DACS segments reversed course last week, as declines dominated across categories. In Trading, CRV led the pack with a 6.13% gain versus a –8.21% sector average, while 1INCH and SUSHI lagged at –13.64% and –14.58%, respectively. Culture tokens were uniformly weak: SUPER slid 5.84%, PRIME plunged 20.05%, and meme names like BONK and PEPE fell 4.95% and 11.39%. Within the Utility sub-category, ENS bucked the trend with an 8.34% rise against a –3.94% average. Infrastructure remained under pressure, with STX down 7.68% and all major scaling tokens in negative territory. Within programmable settlement, SUI was the sole gainer at 5.39%, as XTZ plunged 16.79%. Non-programmable settlements were mixed, led by BCH’s 12.16% gain but dragged lower by XRP’s 11.87% retreat.
CF Staking Series
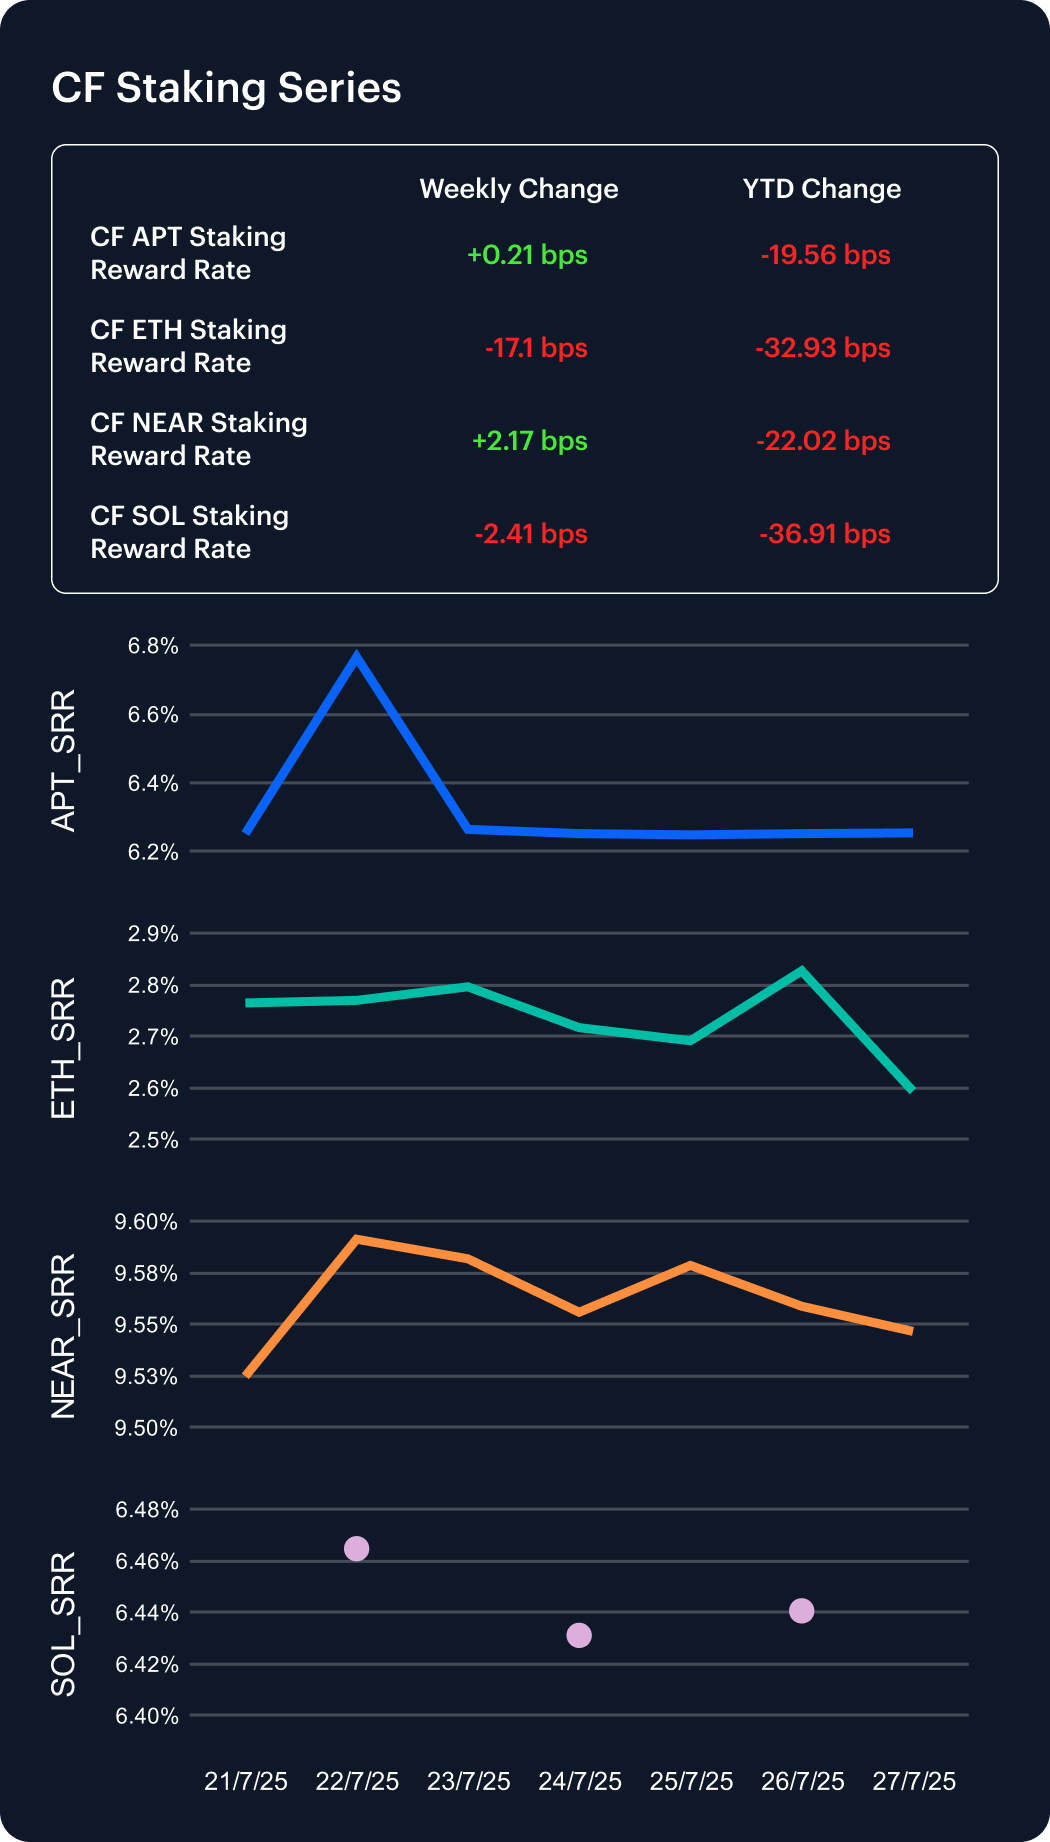
Staking yields diverged again last week, with NEAR emerging as the weekly leader and Ether the laggard. NEAR_SRR climbed 2.17 basis points to 9.55%, narrowing its year-to-date decline to 2.25%. Aptos also edged higher, gaining 0.21 bps to 6.25% and trimming its YTD drop to 3.03%. Solana’s reward rate slipped 2.41 bps to 6.44%, bringing its YTD shortfall to 5.42%. By contrast, Ether’s SRR plunged 17.1 bps to 2.59%, widening its year-to-date decrease to 11.27%. NEAR remains the highest-yielding network at 9.55%, whereas Ether’s 2.59% sits at the bottom, with Aptos and Solana in the middle. These shifts underscore diverging staking demand and inflation dynamics across proof-of-stake networks, driving broad dispersion in on-chain reward profiles.
Market Cap Index Performance
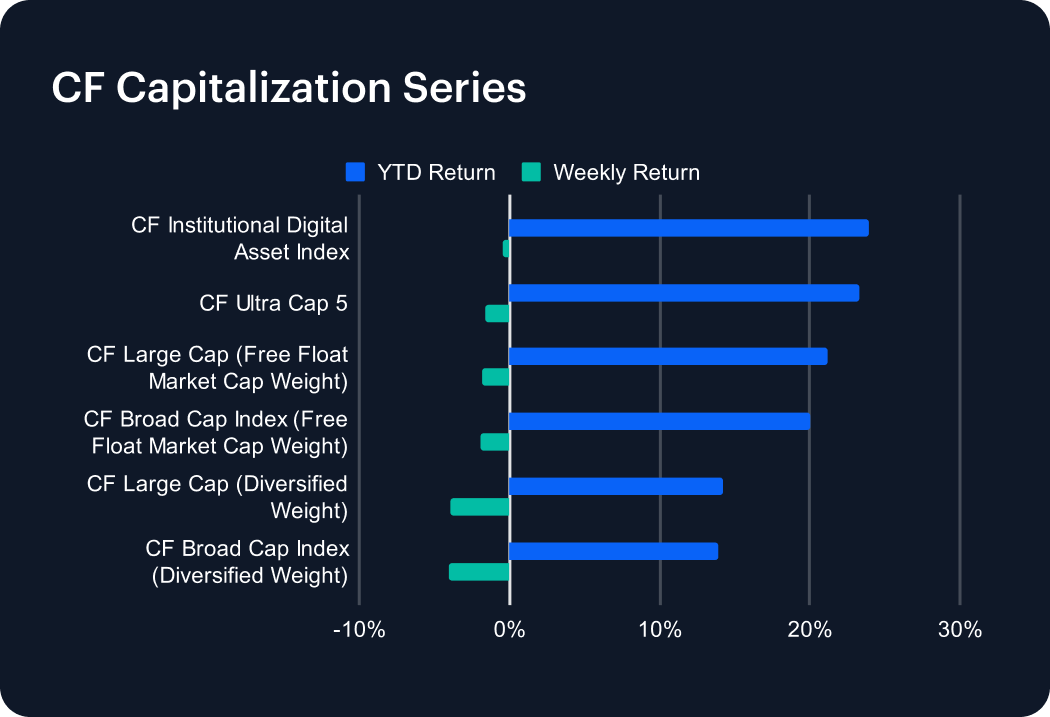
The CF Capitalization Series saw a broad pullback last week, as all marquee indices posted declines. Leading the group, the Institutional Digital Asset Index fell just 0.48%, while the Broad Cap Index (Diversified Weight) slid 4.05%. YTD returns remain solid: the broad market gauge tops at 23.97%, followed by Ultra Cap 5’s 23.35% despite a 1.63% weekly drop. Free-float variants outperformed diversified weights; the Broad Cap (Free Float) dipped 1.95% but sits on a 20.04% YTD gain, and the Large Cap (Free Float) eased 1.84% to 21.20% YTD. By contrast, the Large Cap (Diversified Weight) lost 3.95% and has a 14.20% annual return. This divergence underscores large-cap token’s resilience amid volatility.
Classification Series Analysis
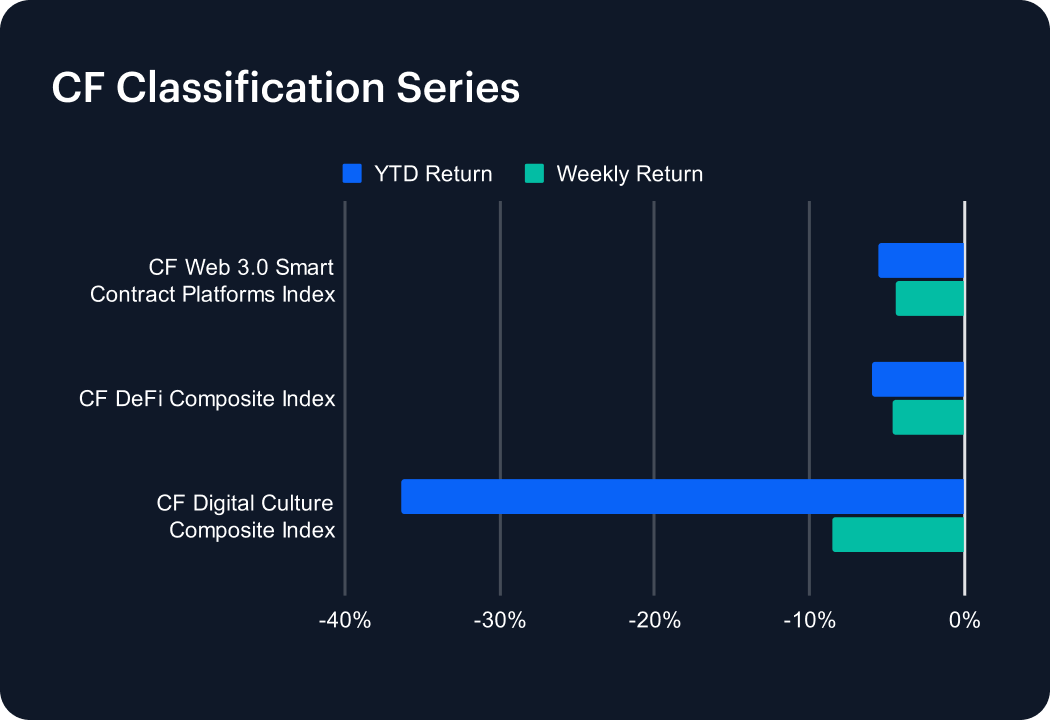
The CF Classification Series reversed course last week, as every thematic index posted notable declines. The CF Web 3.0 Smart Contract Platforms Index led the pullback, easing 4.43% and bringing its YTD deficit to 5.63%. The CF DeFi Composite Index followed, sliding 4.62% to widen its year-to-date shortfall to 6.02%. Worst hit was the CF Digital Culture Composite Index, which plunged 8.53%, deepening its 2025 decline to 36.34%. High-beta themes remain under pressure despite recent rebounds, and significant drawdowns mean these benchmarks still face a steep climb to recapture early-January highs.
Volatility
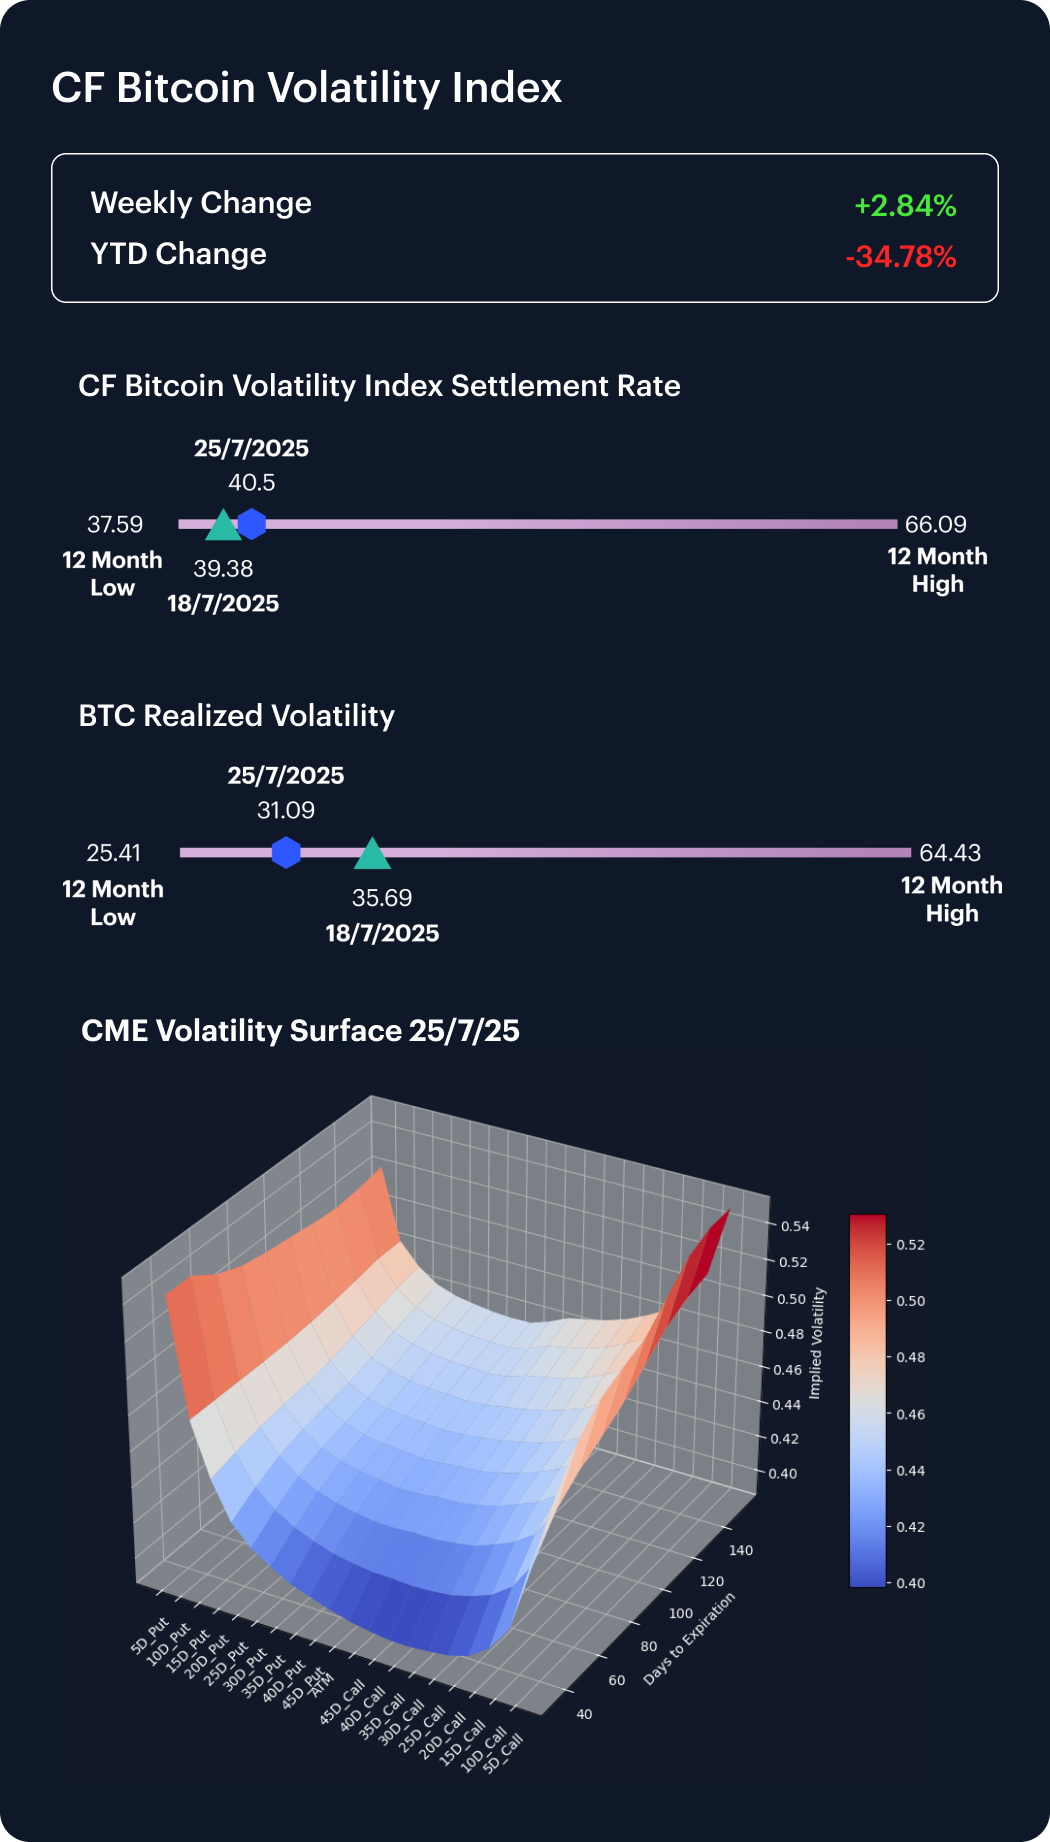
The CF Bitcoin Volatility Index Settlement Rate (BVXS) climbed 2.84% last week, rising from 39.38 to 40.50 and remaining 34.78% below its January 1 level. Realized volatility eased to 31.09—down sharply from 35.69 a week earlier—reflecting calmer spot swings even as option premia stay muted. Skew remains broadly positive across all delta buckets, and convexity has increased, steepening the volatility curve. Short-dated tenors under 60 days continue to trade as the softest segment of the surface, whereas longer maturities command a material premium. Together, firmer BVXS prints, elevated convexity and pervasive skew positivity indicate that market participants are persisting in adding directional exposure despite subdued realized volatility.
Interest Rate Analysis
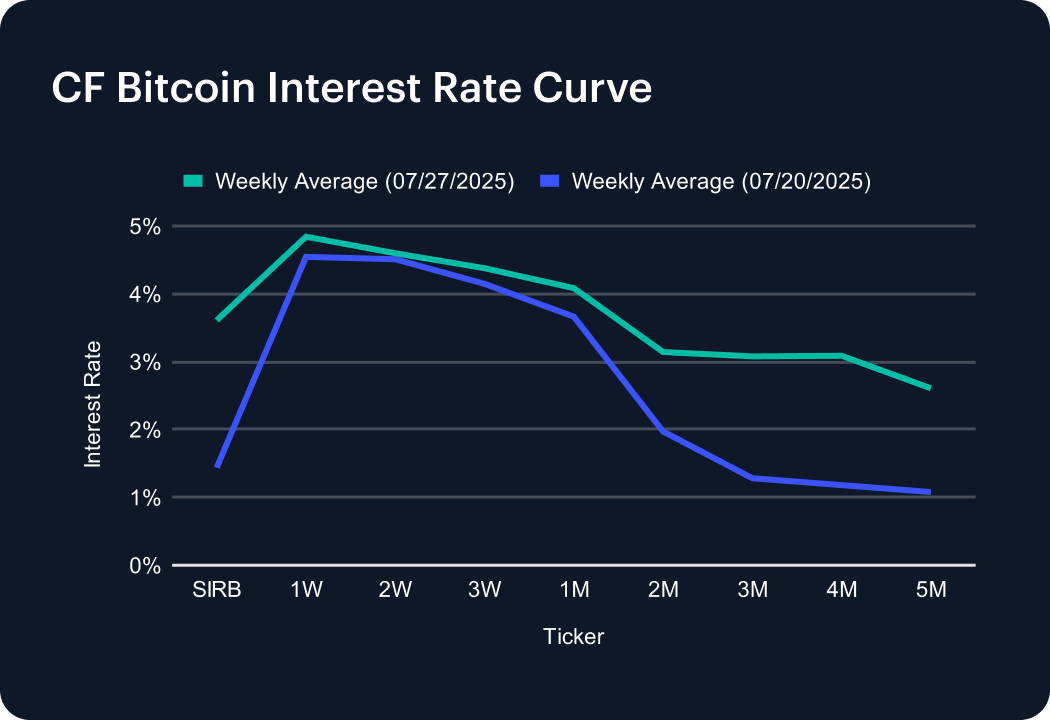
The CF Bitcoin Interest Rate Curve’s anchor surged dramatically, as the Short-Term Interest Rate Benchmark jumped 217 basis points to 3.61%. One-week funding ticked up 29 bps to 4.84%, with two- and three-week tenors rising 9 bps to 4.60% and 23 bps to 4.38%, respectively. One-month rates climbed 42 bps to 4.08%. Beyond the mid-curve, longer maturities saw even larger increases: two-month soared 117 bps to 3.14%, three-month rose 180 bps to 3.08%, four-month added 191 bps to 3.09%, and five-month jumped 153 bps to 2.61%. This pronounced hump and firmer long-end premiums reflect sharply divergent funding demand across tenors.
The information contained within is for educational and informational purposes ONLY. It is not intended nor should it be considered an invitation or inducement to buy or sell any of the underlying instruments cited including but not limited to cryptoassets, financial instruments or any instruments that reference any index provided by CF Benchmarks Ltd. This communication is not intended to persuade or incite you to buy or sell security or securities noted within. Any commentary provided is the opinion of the author and should not be considered a personalised recommendation. Please contact your financial adviser or professional before making an investment decision.
Note: Some of the underlying instruments cited within this material may be restricted to certain customer categories in certain jurisdictions.
Changes to the Token Market Price Benchmarks Series - Market Prices – 21 July 2026
The Administrator has confirmed changes to the Token Market Price Family for the period 14 July 2026 to 21 July 2026.

CF Benchmarks
Softer CPI Reprices July Hike Risk & Lifts Digital Assets
Digital assets extended their recovery over the past week as cooler US inflation prints repriced Fed expectations; the bid was broad across the large cap indices, growth factor leadership returned, stablecoin funding repriced lower, and stress stayed isolated in names hit by token-specific news.
Mark Pilipczuk
Notice of the Demising of CF Dai-Dollar Settlement Price and Spot Rate
The Administrator announces that it will demise the CF Dai-Dollar Settlement Price (DAIUSD_RR) and CF Dai-Dollar Spot Rate (DAIUSD_RTI) which are members of the CF Digital Asset Index Family.
CF Benchmarks
By clicking Accept, you consent to CF Benchmarks's use of cookies.
Visit Cookie Settings to learn how CF Benchmarks uses cookies and to adjust your preferences.