
Mar 11, 2021
The ‘Bitcoin Effect’ on the traditional 60/40 portfolio
Bitcoin ETF launches reflect demand for tried and trusted ways to disrupt the most traditional portfolio with one of the most modern assets

Let’s face it, the credibility of the 60/40 portfolio as a long-term investment strategy has taken a battering over the last couple of decades, to say the least. After around twenty years of historically low interest rates coupled with the advent of equity market phenomena like FAANG stock market leadership, representation and influence, the ability of an allocation of 60% to equity and 40% to ‘safer’ assets to clearly outperform riskier approaches has been severely undermined.
Put another way, the jury is out on the question of whether the traditional 60/40 portfolio still offers an adequate basis upon which more customised long-term investment advice can be built. The dilemma of whether to minimise risk or maximise risk-adjusted returns looms large.
Of course, to the extent that the one-size-fits-all investment strategy has increasingly been recognised as unrealistic, the erosion of confidence in 60/40 was inevitable eventually, either way. Still, as Forbes’ renowned investment columnist Gary Mishuris notes, a large swathe of personal financial assets overseen by U.S. investment managers are still likely deployed in some variation of the 60/40 portfolio. And it appears that–with some justification—the investment management industry is more focused on variants of the tradition than on optimising individual investment approaches on a case-by-case basis.
As such, with digital assets showing clear signs of having passed the point of no return within the institutional investment zeitgeist, it’s still cogent to consider the impact of potential investments into the most prominent and important of such assets—Bitcoin—on the traditional 60/40 portfolio.
To be clear, this is by no means a novel area of research. Here’s a link to a paper on one of the most thorough examinations of the topic available, published by Bitwise Asset Management. Generally, what studies like Bitwise’s and others illustrate is that an allocation of between 1% to 5% to Bitcoin within a traditional portfolio tends to produce cumulative long-term returns superior to those from traditional portfolios with no allocation to Bitcoin.
After the launch of the first Bitcoin ETFs in quick succession a few weeks ago, reflecting investor demand for Bitcoin investment within the tried and trusted structure of an ETF, the robustness of the ‘Bitcoin effect’ is the bigger question. Additionally, given the historical volatility of assets like Bitcoin, the matter of robustness is inextricably tied to another major question: what is the optimal frequency of rebalancing for such a portfolio? These and other critical refinements, like potential maximum drawdowns, and quantification of risk via Sharpe ratios and standard deviations are solidly dealt with in the Bitwise paper, a more ambitious publication than this one.
With the proportion of assets referencing CF Benchmarks’ regulated CME CF Bitcoin Reference Rate (BRR), such as Evolve Funds Group’s Bitcoin ETF, almost certainly set to increase in coming months, specific data on the effect of ETFs referencing the BRR on a typical traditional portfolio will soon become more readily available. For now, recognising that at a minimum, some form of rebalancing is essential when assessing the ‘Bitcoin effect’ it’s already clear that when utilising pricing data from BRR Constituent Exchanges, the broad outcomes of long-term returns cohere very closely with existing observations. This is illustrated in the two charts below.
Figure 1 – Impact on a 60/40 portfolio from allocations to Bitcoin at BRR price without rebalancing (rebased to 100)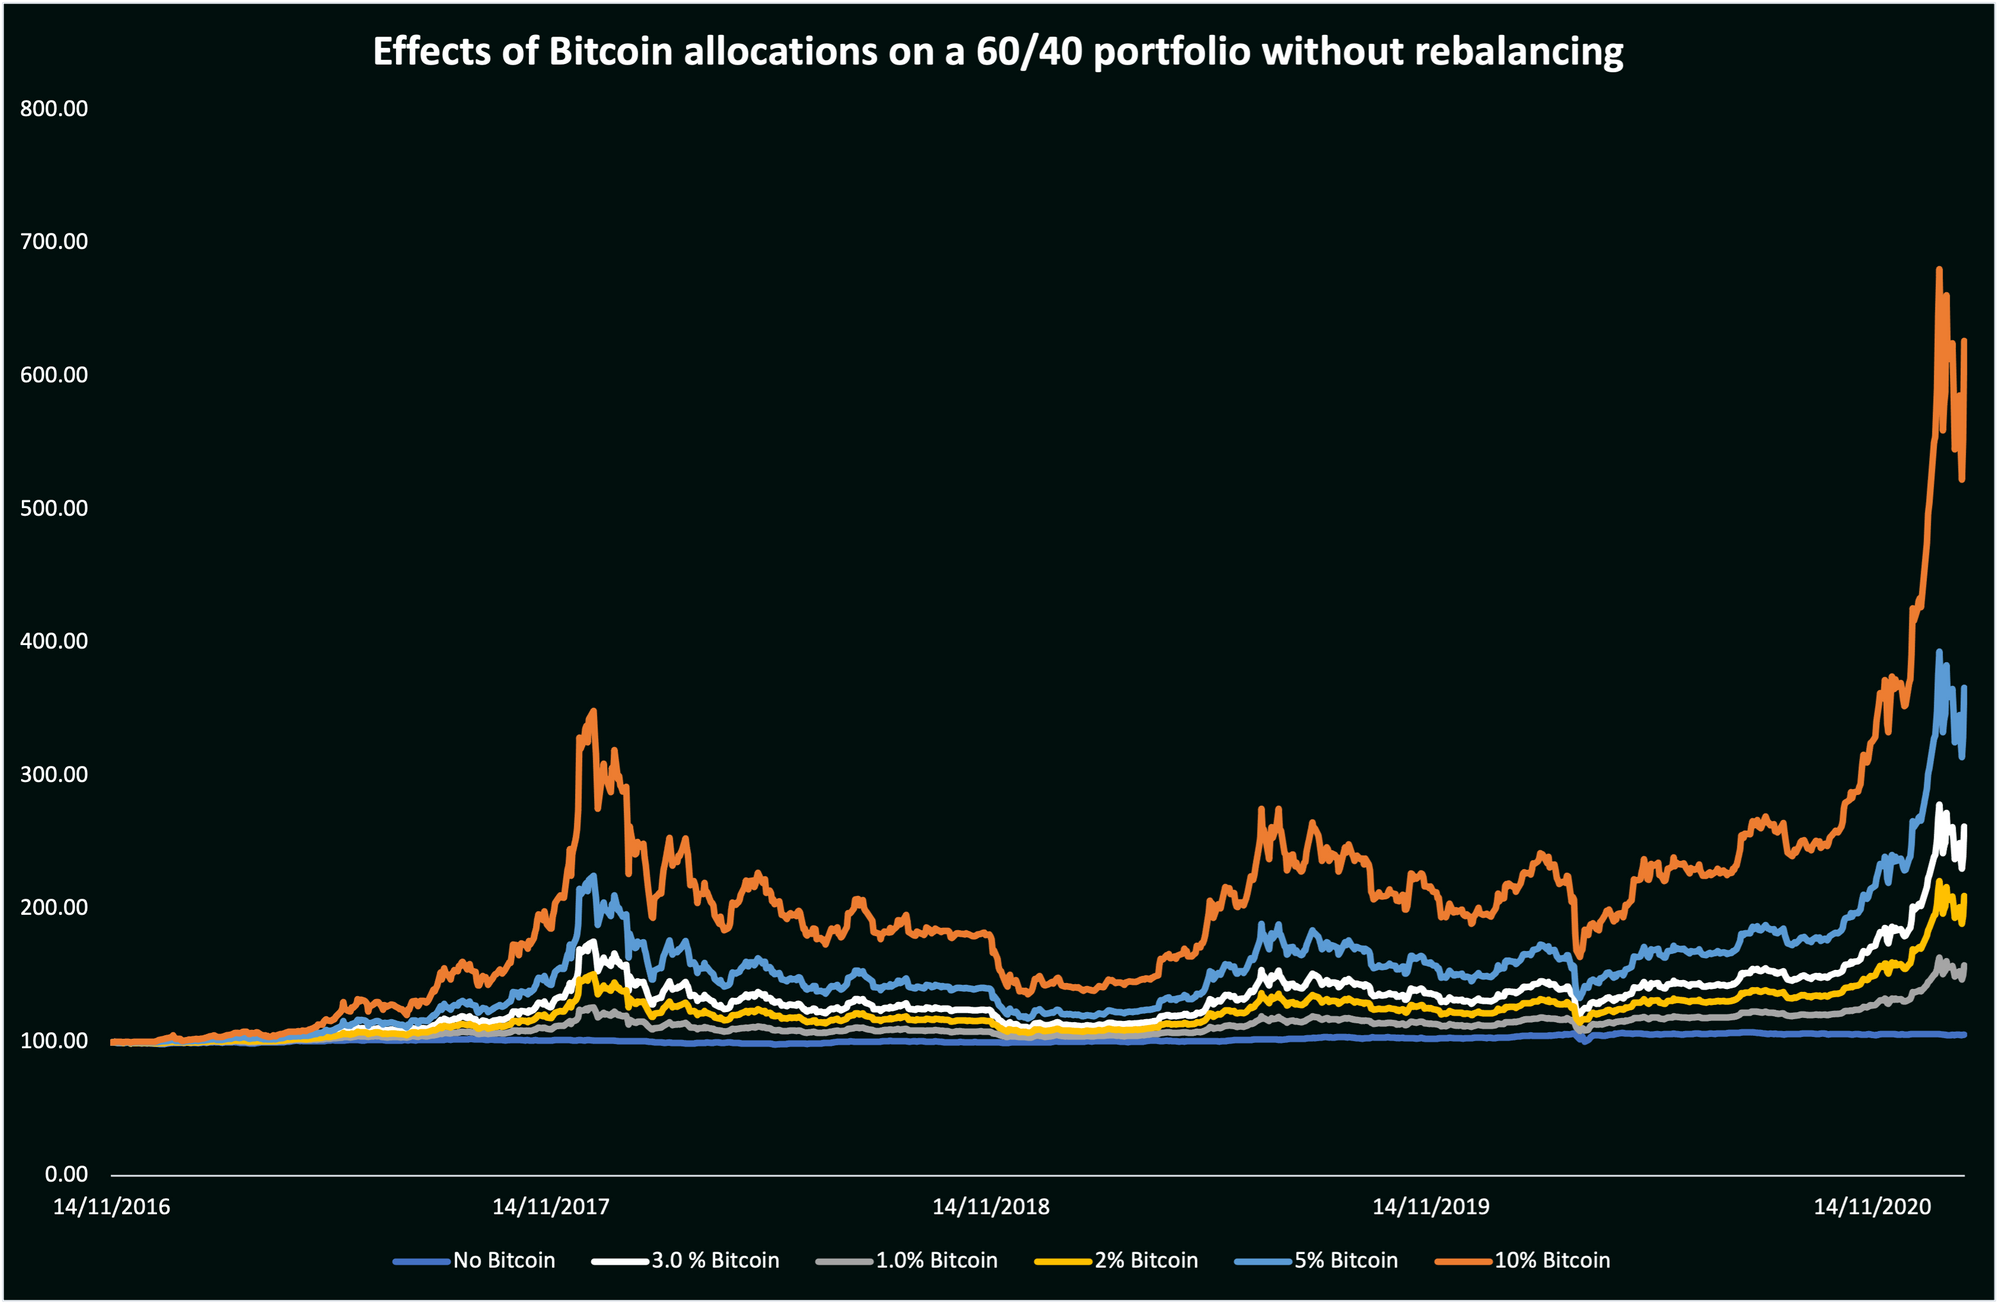 Source: CF Benchmarks
Figure 2 - Impact on a 60/40 portfolio from allocations to Bitcoin at BRR price with annual rebalancing (rebased to 100)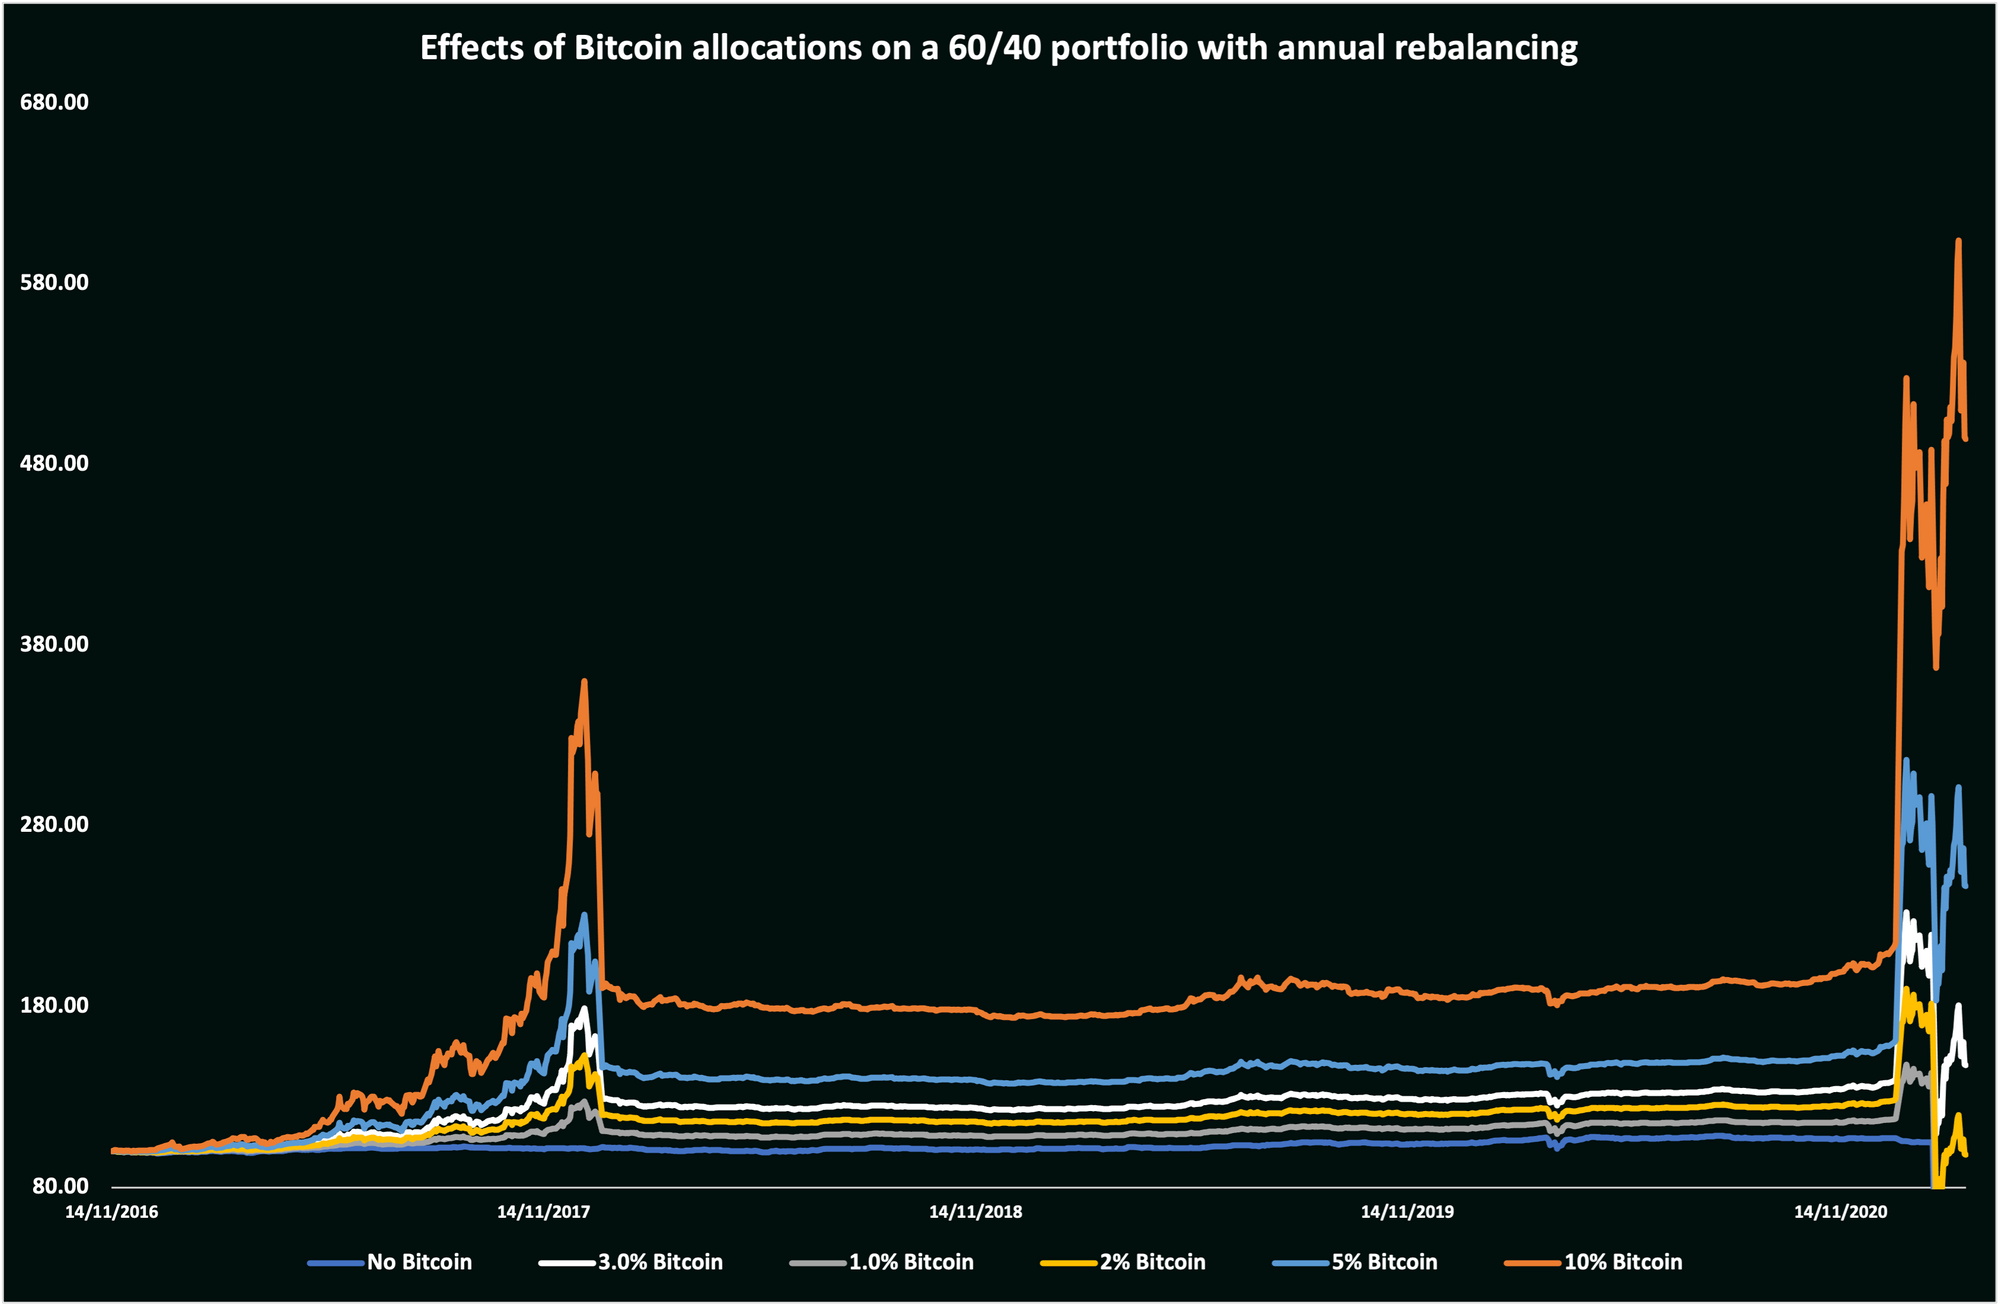 Source: CF Benchmarks
In this case, the 60/40 portfolio was constituted of a 60% allocation to the SPDR S&P 500 ETF Trust (representing the ‘equity’ portion of the traditional basket) and the iShares Core U.S. Aggregate Bond ETF (representing the fixed-income portion). It’s worth noting that prices were rebased on a total returns basis, excluding fees and commissions. Also, that the five-year time span covers the first five years of the BRR’s existence following its inception on 14th November 2016.
In a nutshell, the charts demonstrate that allocations to Bitcoin represented by the regulated Bitcoin Reference Rate have a very similar effect on a 60/40 portfolio as the one evident from previously published research. Relative to no Bitcoin investment within a 60/40 portfolio, scenarios in which respectively 1%, 2%, 3%, 5% and 10% were invested in Bitcoin produced successively higher returns.
Additionally, following the grandiose rally of the digital asset class that spanned roughly from October 2020 to late-January 2021, exposure to Bitcoin within the 60/40 portfolio proved to be advantageous in proportion to those blow-out gains. Predictably, whilst the effect from rebalancing both looks and would, in fact, be ‘smoother’—i.e., less volatile—in principle, the outperformance of scenarios including Bitcoin of those that did not remains even when rebalancing is not undertaken.
Given that Bitcoin was first available to trade no earlier than July 2010, it will be some years yet before the most definitive conclusions about the ‘Bitcoin effect’ can be determined. Even so, observations available to date are unequivocal regarding the benefits to be had by making small tweaks to the traditional portfolio by modest additions of one of the most modern assets.
The next major question will be the extent to which the positive effect is sustained when sufficient data from Bitcoin ETFs is available to substitute underlying Bitcoin price data in a 60/40 portfolio. Tracking error, particularly in those ETFs referencing the most trusted, transparent Bitcoin price, the BRR will be key. Before such data is sufficiently available, the momentum of adoption trends on Main Street, Wall Street and beyond at worst can only be underpinned by what we know about the ‘Bitcoin effect’ so far.
The information contained within is for educational and informational purposes ONLY. It is not intended nor should it be considered an invitation or inducement to buy or sell any of the underlying instruments cited including but not limited to cryptoassets, financial instruments or any instruments that reference any index provided by CF Benchmarks Ltd. This communication is not intended to persuade or incite you to buy or sell security or securities noted within. Any commentary provided is the opinion of the author and should not be considered a personalised recommendation. Please contact your financial adviser or professional before making an investment decision.
Note: Some of the underlying instruments cited within this material may be restricted to certain customer categories in certain jurisdictions.
CFB Talks Digital Assets Episode 58: BlackRock's Matt Kunke on the Launch of ETHB and Staking ETF Mechanics
We're stoked to welcome BlackRock's Matt Kunke, CFA — US iShares Digital Assets ETFs Product Strategist — to the CFB Talks Digital Assets podcast!

Ken Odeluga
Is It Too Late to Launch New US Bitcoin ETFs?
Less than 18 months since its inception, the US Bitcoin ETF market is worth around $100 billion. We examine whether new entrants and major players waiting in the wings have left it too late.
Ken Odeluga
Changes to the Token Market Price Benchmarks Series - Market Prices – 28 April 2026
The Administrator has confirmed changes to the Token Market Price Family for April.
CF Benchmarks
By clicking Accept, you consent to CF Benchmarks's use of cookies.
Visit Cookie Settings to learn how CF Benchmarks uses cookies and to adjust your preferences.