
Jun 02, 2026
Sticky Inflation, a Hawkish Fed, and a Broad Pullback
Key takeaways for the month
Macro and policy crosscurrents reversed in May as inflation re-accelerated and the Federal Reserve's tone hardened, ending April's rebound with a broad pullback across digital assets. April CPI, released May 12, rose 3.8% year over year, the highest reading since May 2023 and above the 3.7% consensus, as the lingering oil shock from the Iran conflict fed into energy and shelter. Minutes from the April 28-29 FOMC meeting, released May 20, showed officials prepared to raise rates if inflation stayed elevated, with the policy rate held at 3.50% to 3.75%. The Senate confirmed Kevin Warsh as the next Fed chair on May 13 by a 54-to-45 margin, the closest such vote in the modern era. Spot Bitcoin ETFs recorded their largest monthly outflow of 2026 at roughly $2.4 billion, even as a 60-day U.S.-Iran ceasefire framework pulled crude down almost 19%. As rate-cut hopes gave way to rate-hike risk, investors turned defensive while the energy premium eased.
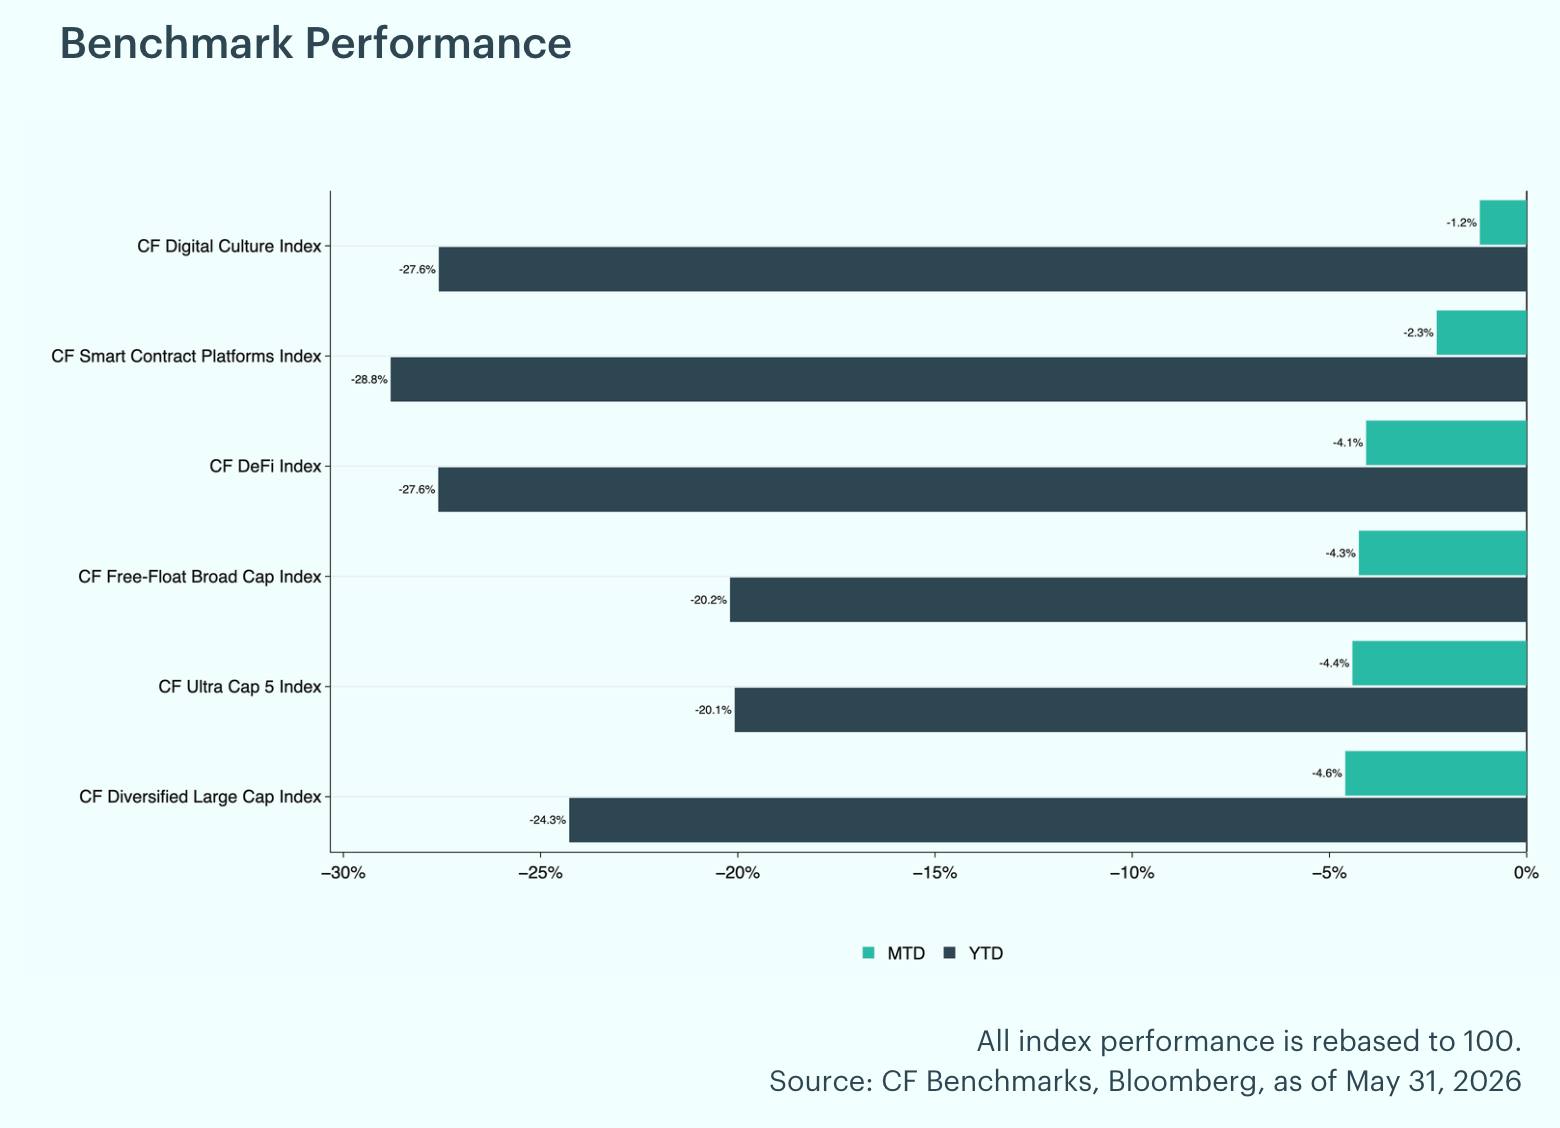
Broad Pullback Across the Market: May reversed April's rebound, with every CF Benchmarks index posting a negative monthly return. The CF Digital Culture Index proved most resilient, off 1.2% month-to-date, followed by the CF Smart Contract Platforms Index at a 2.3% decline. The CF DeFi Index fell 4.1%, the CF Free-Float Broad Cap Index 4.3%, and the CF Ultra Cap 5 Index 4.4%, while the CF Diversified Large Cap Index lagged at 4.6%. On a year-to-date basis, drawdowns deepened to a 20% to 29% range, with the CF Smart Contract Platforms Index down the most at 28.8%.
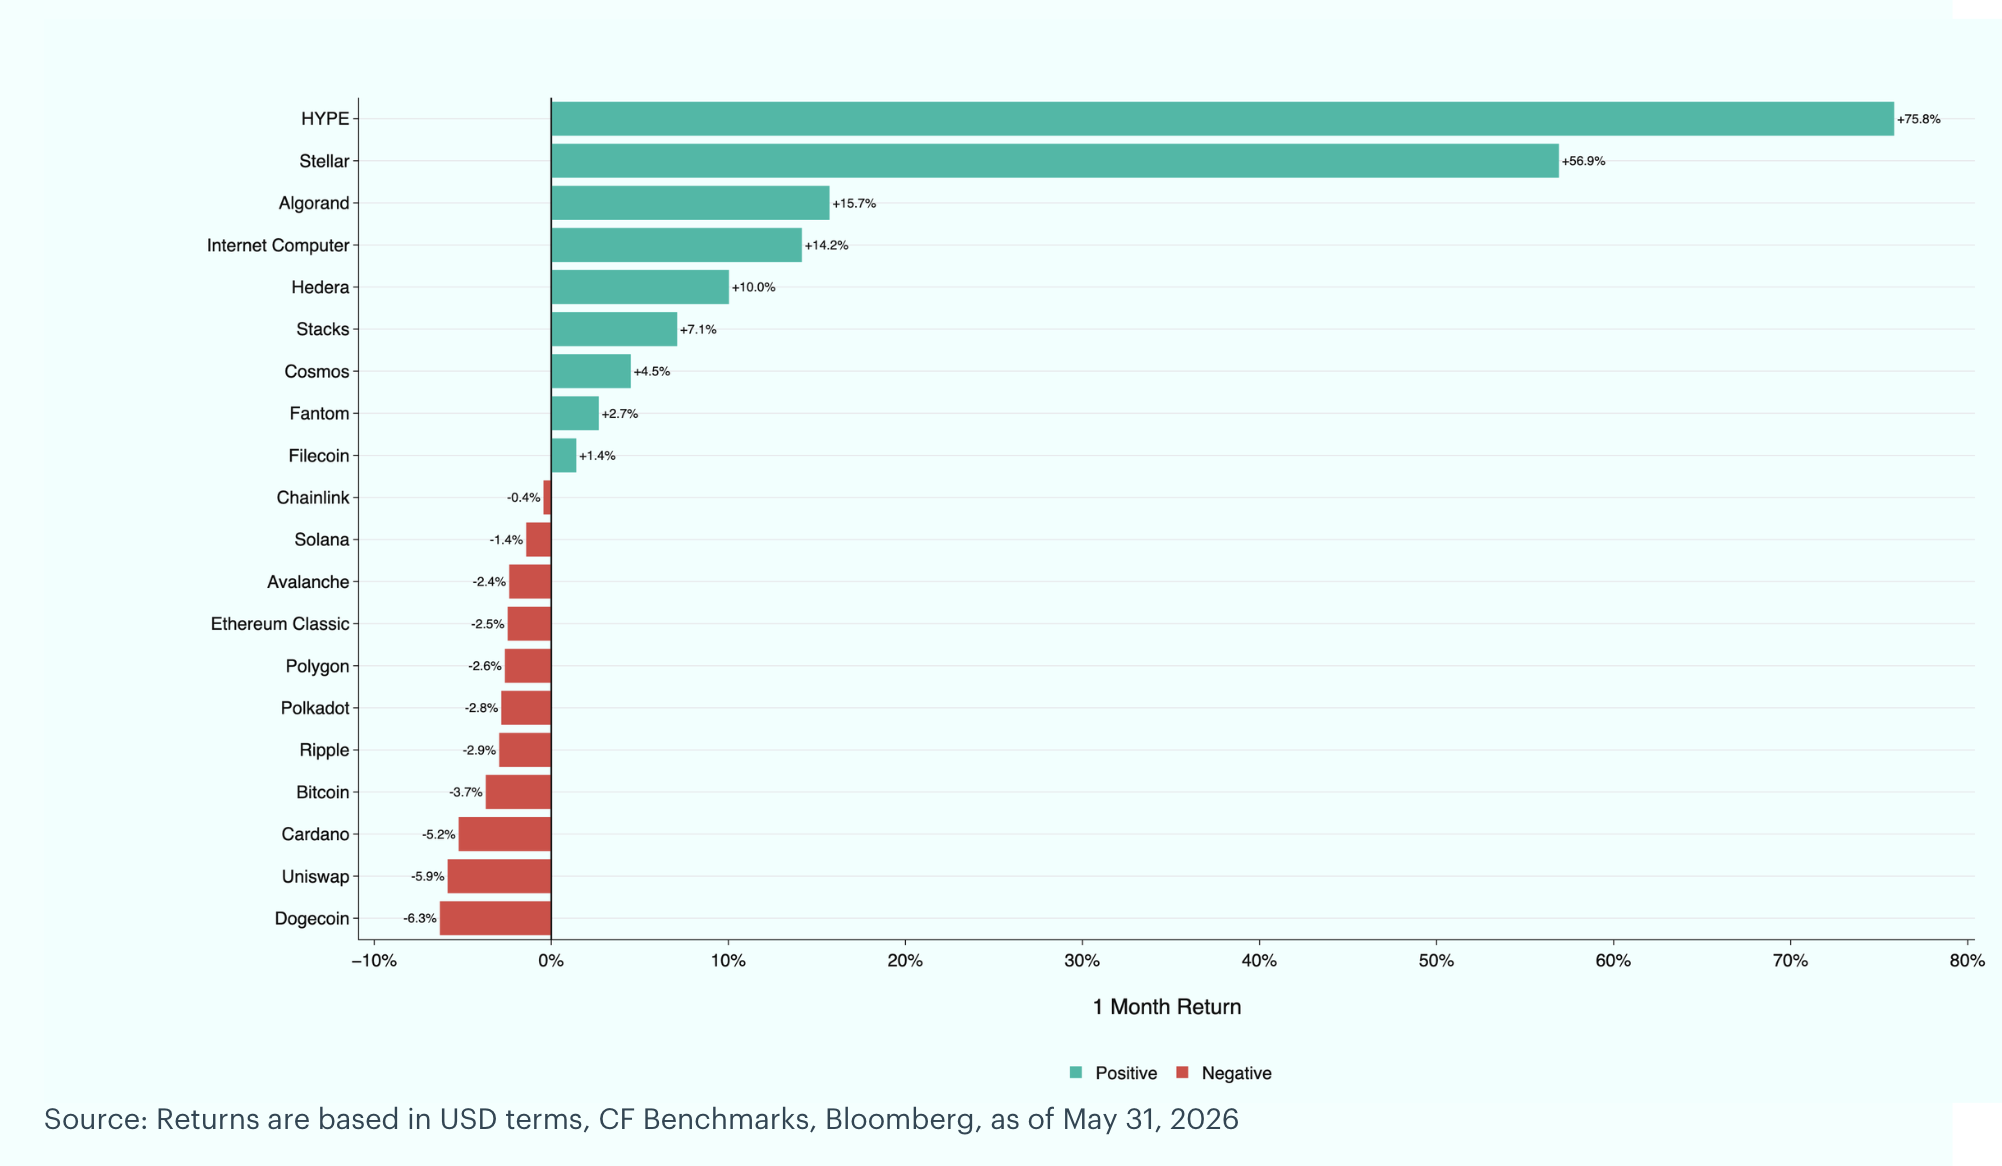
Individual Movers: Hyperliquid (HYPE) led the major crypto-pairs in May with a 75.8% month-over-month gain, the largest in the group, following the mid-month launch of the first U.S. spot HYPE ETFs (21Shares' THYP on May 12 and Bitwise's BHYP on May 15). Stellar (XLM) followed at +56.9%, lifted by a May 27 announcement that DTCC would connect its tokenized securities platform to the Stellar network. Algorand (ALGO) rose 15.7% after listing on Robinhood for U.S. users on May 19. On the downside, Dogecoin (DOGE) was the weakest major in the top 20 at -6.3%, as institutional flows rotated away from large-cap names and its spot ETFs drew effectively no inflows. Uniswap (UNI) fell 5.9% after the U.S. government transferred roughly $1.9 million of UNI to Coinbase on May 27, prompting sell-off speculation. Cardano (ADA) declined 5.2% after a treasury funding proposal for 7.8 million ADA fell short of approval, reaching 65.21% against the 66.67% threshold. Source: Returns are based in USD terms, CF Benchmarks, Bloomberg, as of May 31, 2026.
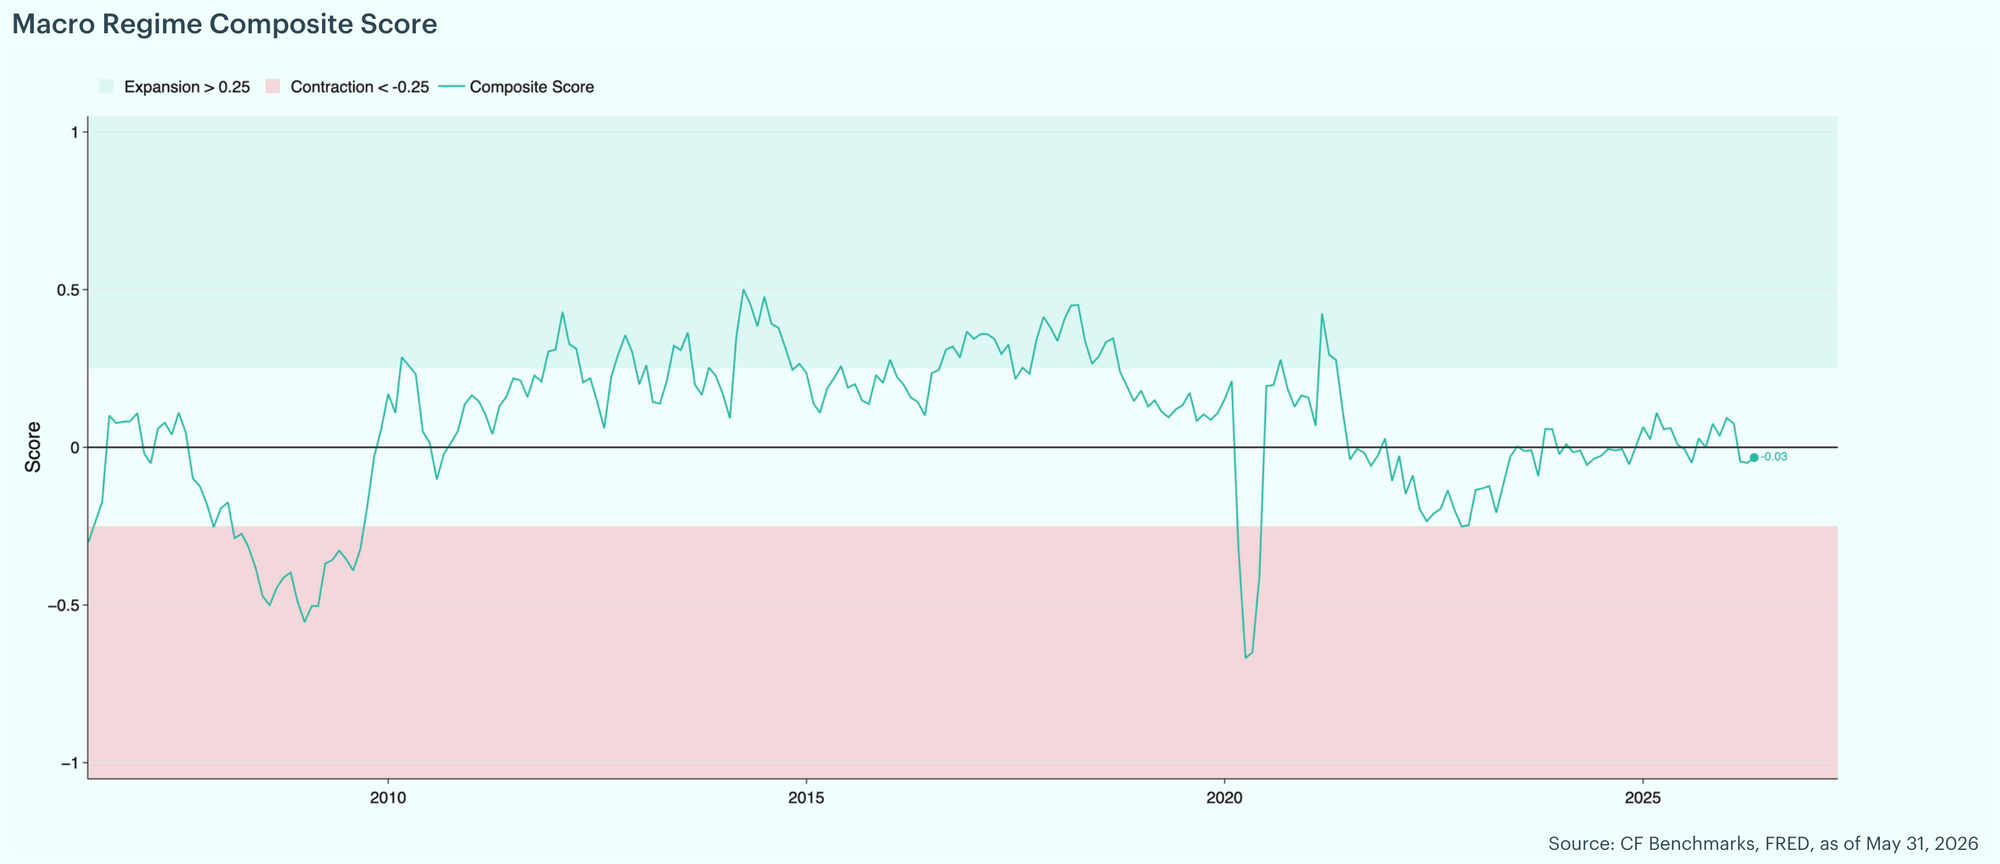
Late-Cycle Macro Holds in Neutral: The CF Benchmarks Macro Regime Composite Score sat essentially at zero, near -0.03, within the neutral zone (expansion above +0.25, contraction below -0.25). The cycle read flat and late stage, with firmer goods activity and accommodative financial conditions on one side, and softening labor breadth, a contractionary reading from the Brave-Butters-Kelley leading index, and a renewed inflation impulse on the other. Price gauges pointed to renewed pressure: the ISM Manufacturing Prices Paid index rose to 84.6 in April from 78.3 in March, its highest reading outside the 2021 to 2022 episode, and University of Michigan one-year inflation expectations climbed to 4.7%, up 0.9 percentage points month-over-month. The labor and financial backdrop held rather than turned, with the unemployment rate unchanged at 4.3%, initial jobless claims steady near 215,000, job openings little changed at roughly 6.9 million, and the 10-year minus 2-year spread positively sloped at +0.47.
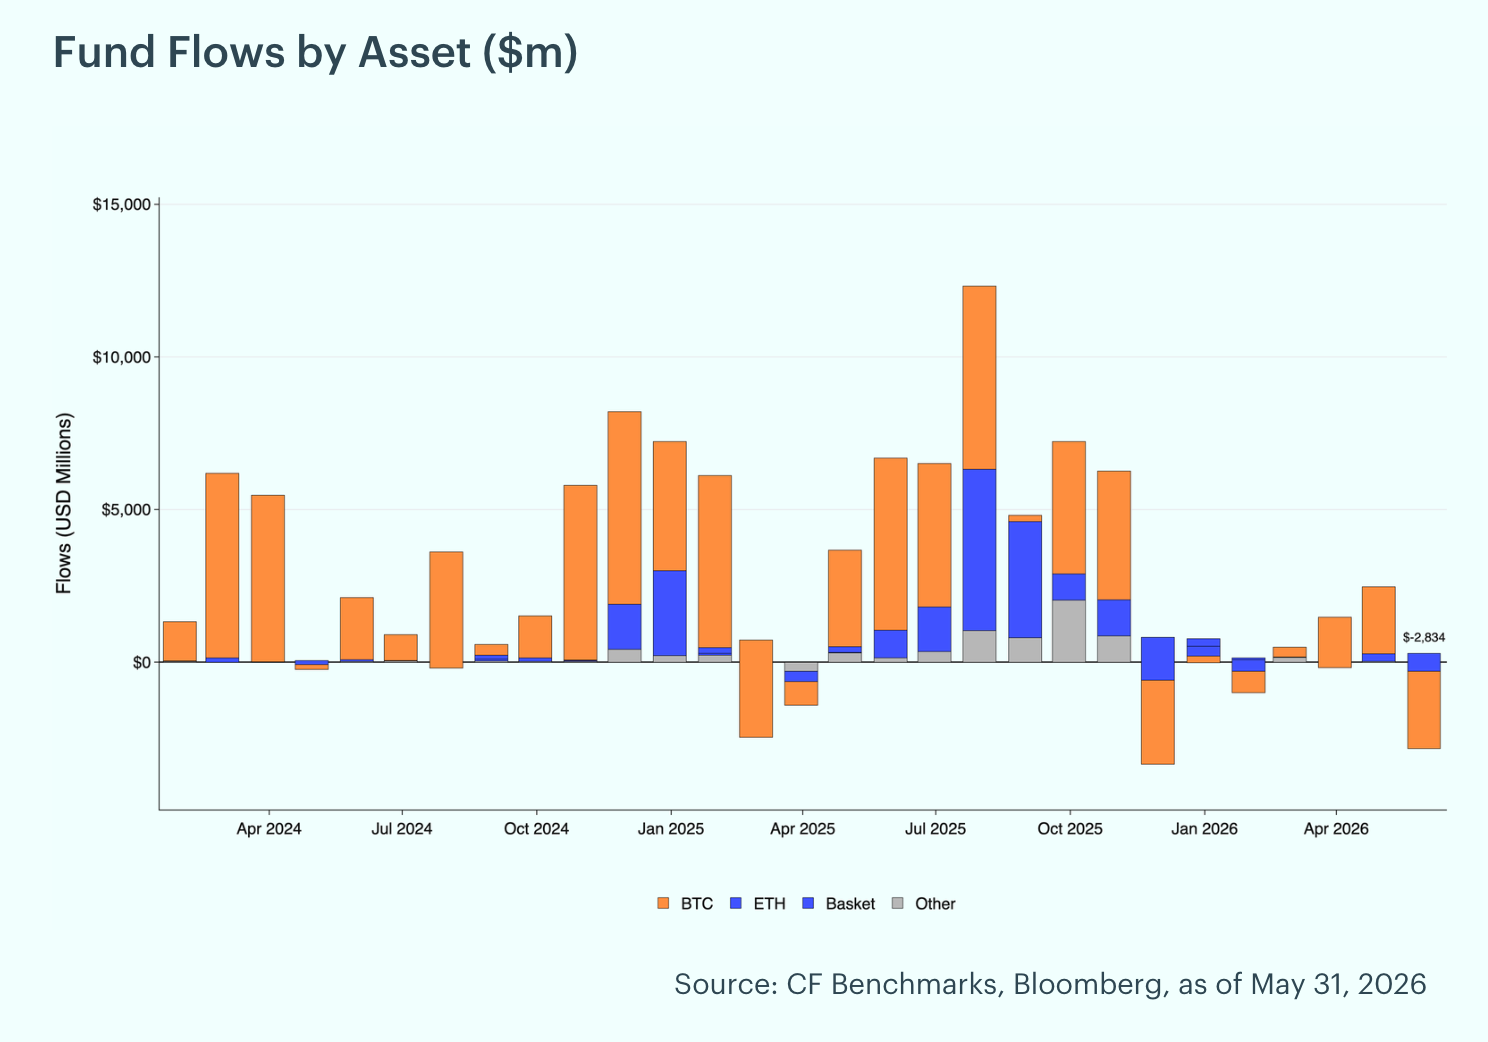
Fund Flows Swing to 2026's Largest Outflow: Digital asset funds swung to net outflows in May, shedding $2,833.9 million after net inflows of $2,469.5 million in April. Bitcoin funds led the reversal with $2,541.8 million of outflows, and Ether funds lost $586.6 million, while Other Single Crypto funds drew $294.2 million and Basket/Index funds were flat at $0.3 million. By region, the selling was concentrated in North America at $4,169.9 million of outflows, partly offset by $50.0 million of inflows into Europe.
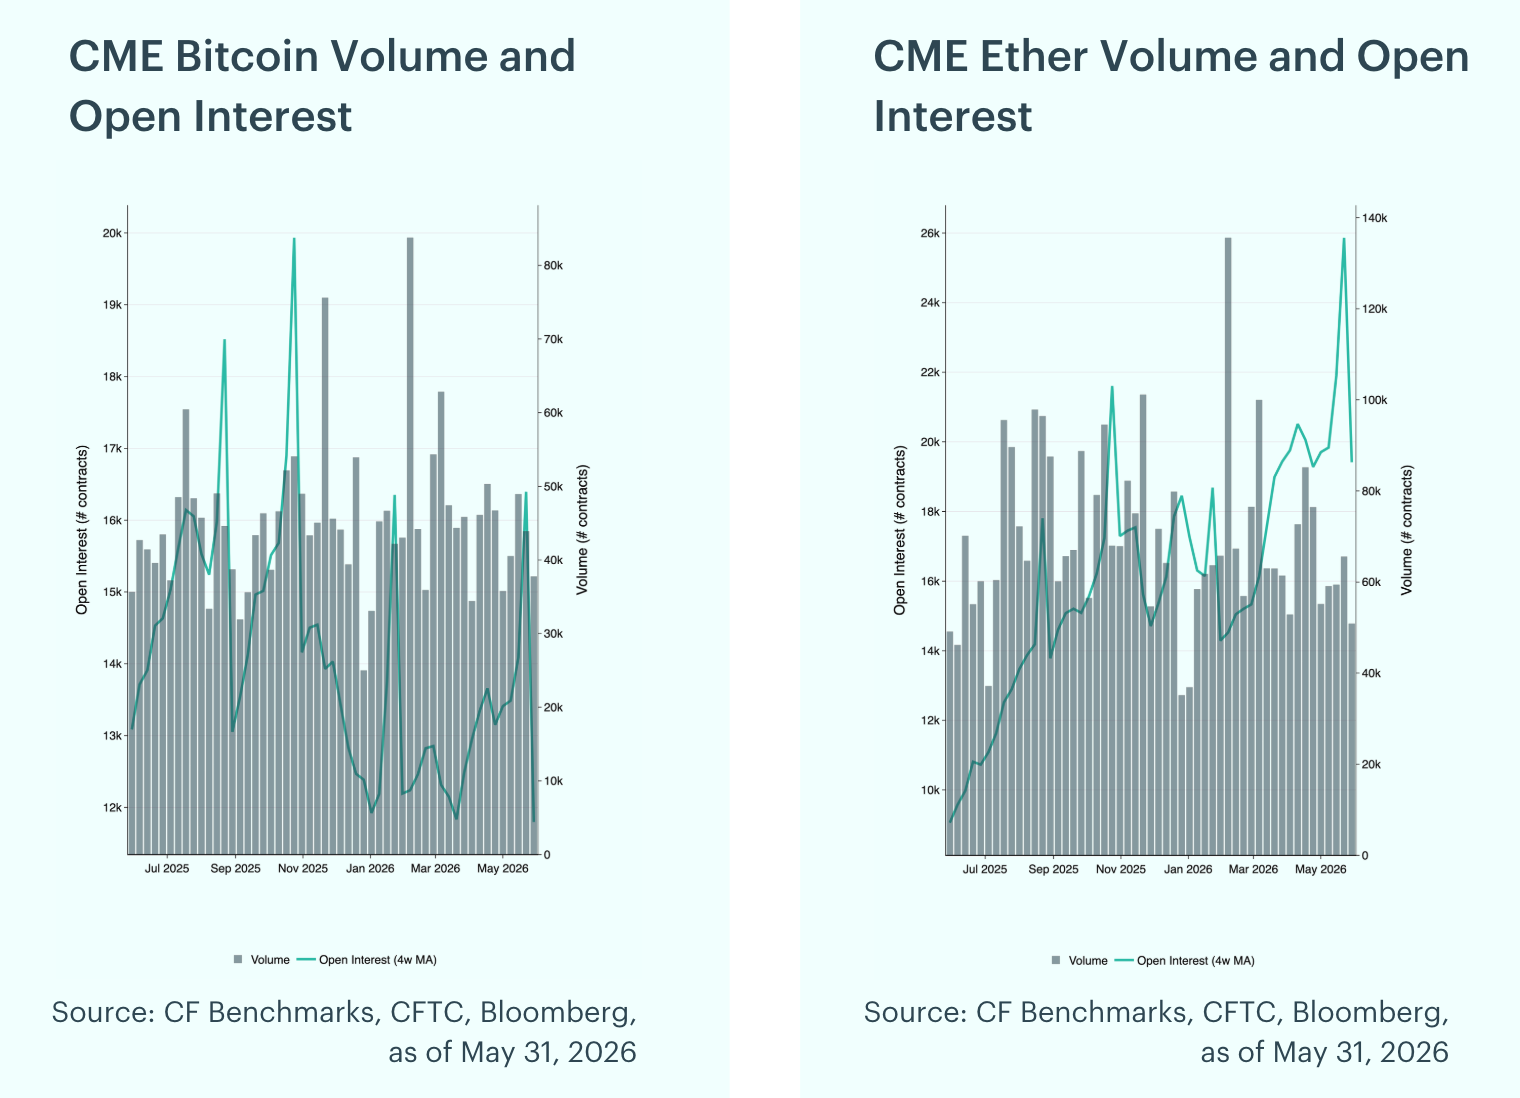
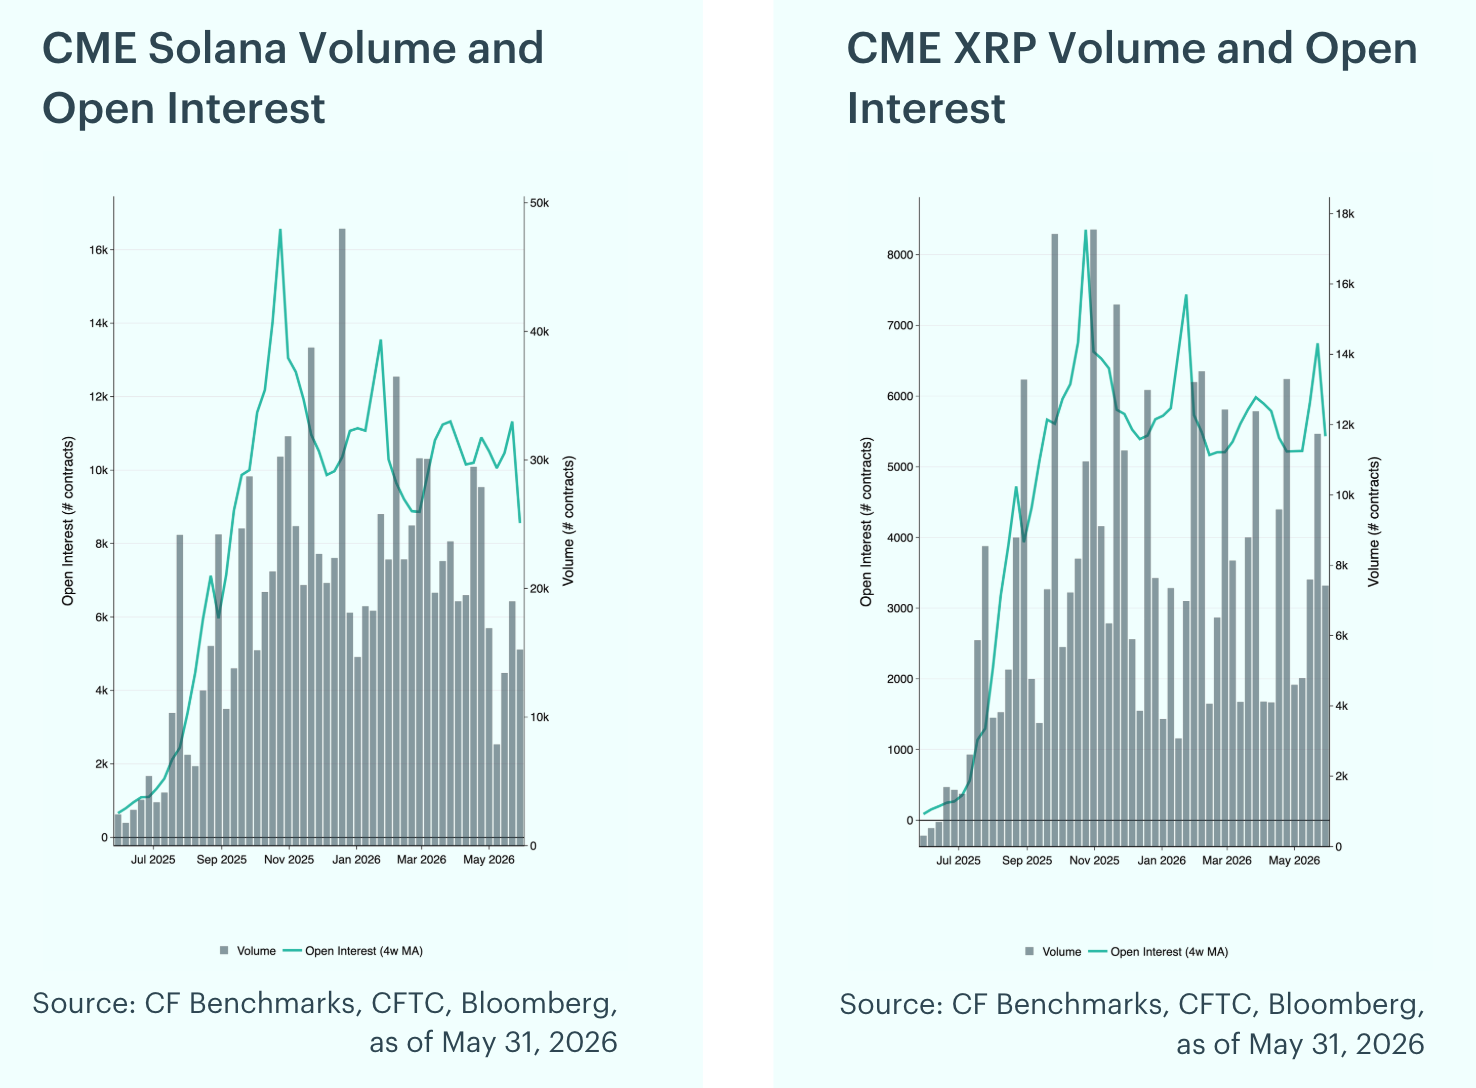
Futures Positioning Cools: CME futures positioning cooled in May. On a four-week moving average basis, CME Bitcoin open interest eased 10.3% month-over-month to roughly 11,799 contracts, and Solana open interest fell 21.4% to about 8,558 contracts, the steepest drop in the group, while Ether held near 19,412 contracts and XRP was little changed at 5,431 contracts. Peak weekly volumes also moderated from April, with Bitcoin at 48,935 contracts, Ether at 65,564, Solana at 18,988, and XRP at 11,737.
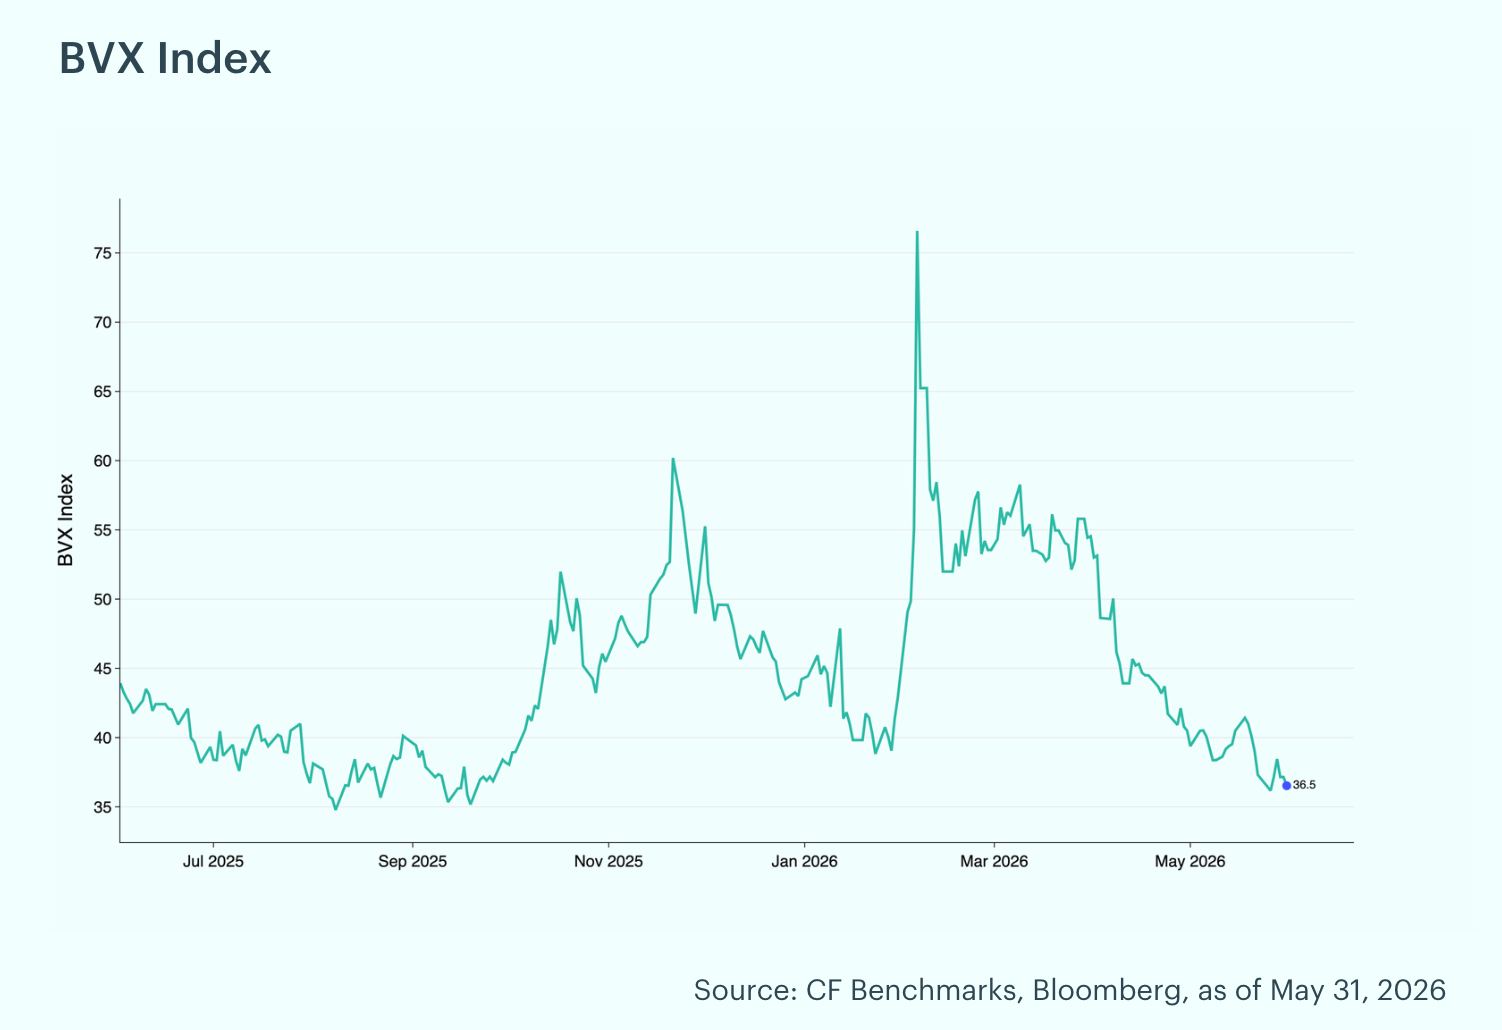
Bitcoin Volatility Eases to Fresh Lows: The CF Bitcoin Volatility Index Settlement Rate (BVXS) is a daily benchmark that provides a forward-looking, 30-day constant-maturity measure of implied volatility, derived from CFTC-regulated Bitcoin option contracts traded on the CME. The BVX reflects the fair strike of a variance swap. The BVX eased further in May, trading in a 36.17 to 41.42 range and closing the month at 36.52, down from 40.50 at the end of April and near the low end of its trailing-year range. The rolling 30-day z-score finished at -1.72 and stayed negative throughout the month, ranging from -2.16 to -0.15, indicating implied volatility held below recent norms.
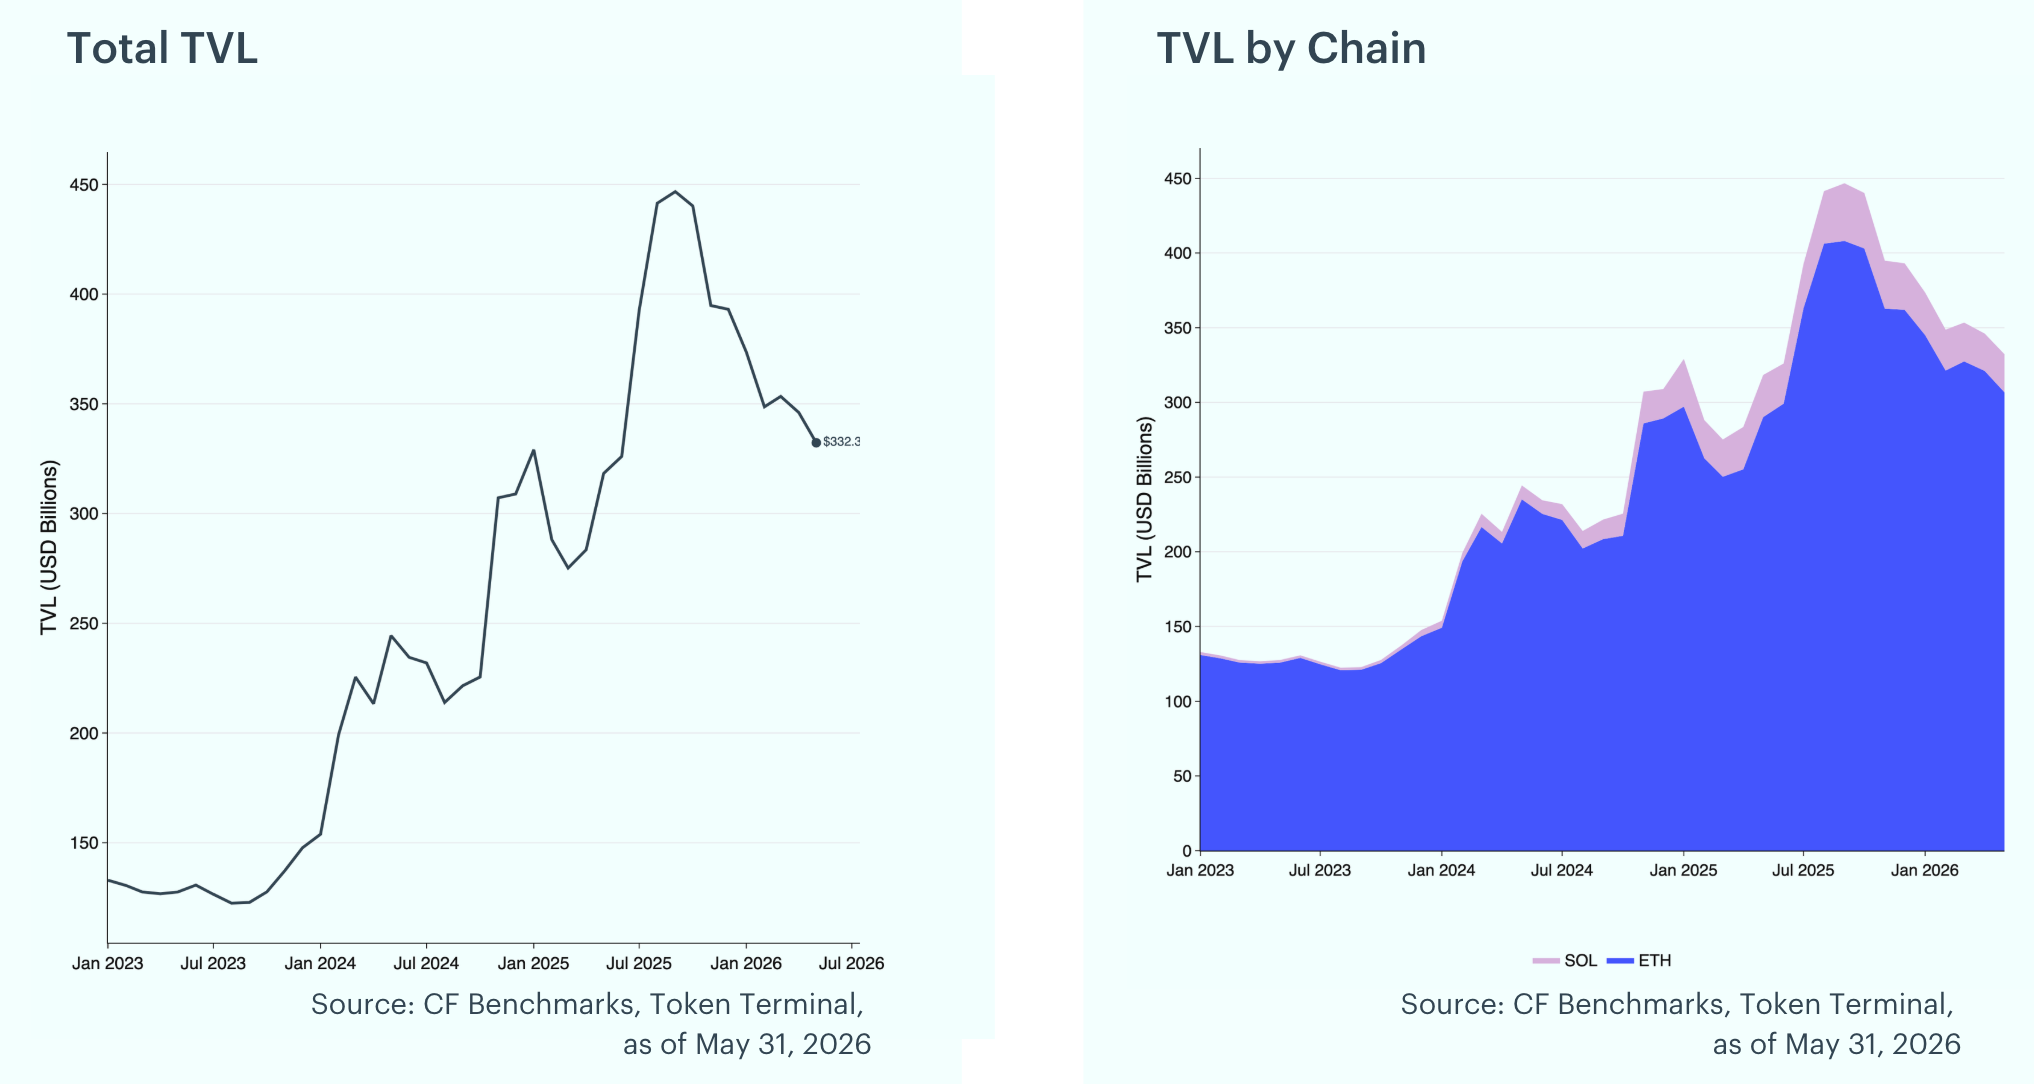
DeFi TVL Slips Further: Total Value Locked declined 4.0% in May to $332.3 billion, down from $346.0 billion in April. Ethereum TVL fell to $306.7 billion (-4.5%) while Solana TVL edged up to $25.5 billion (+2.3%), leaving Ethereum at roughly 92% of the tracked total.
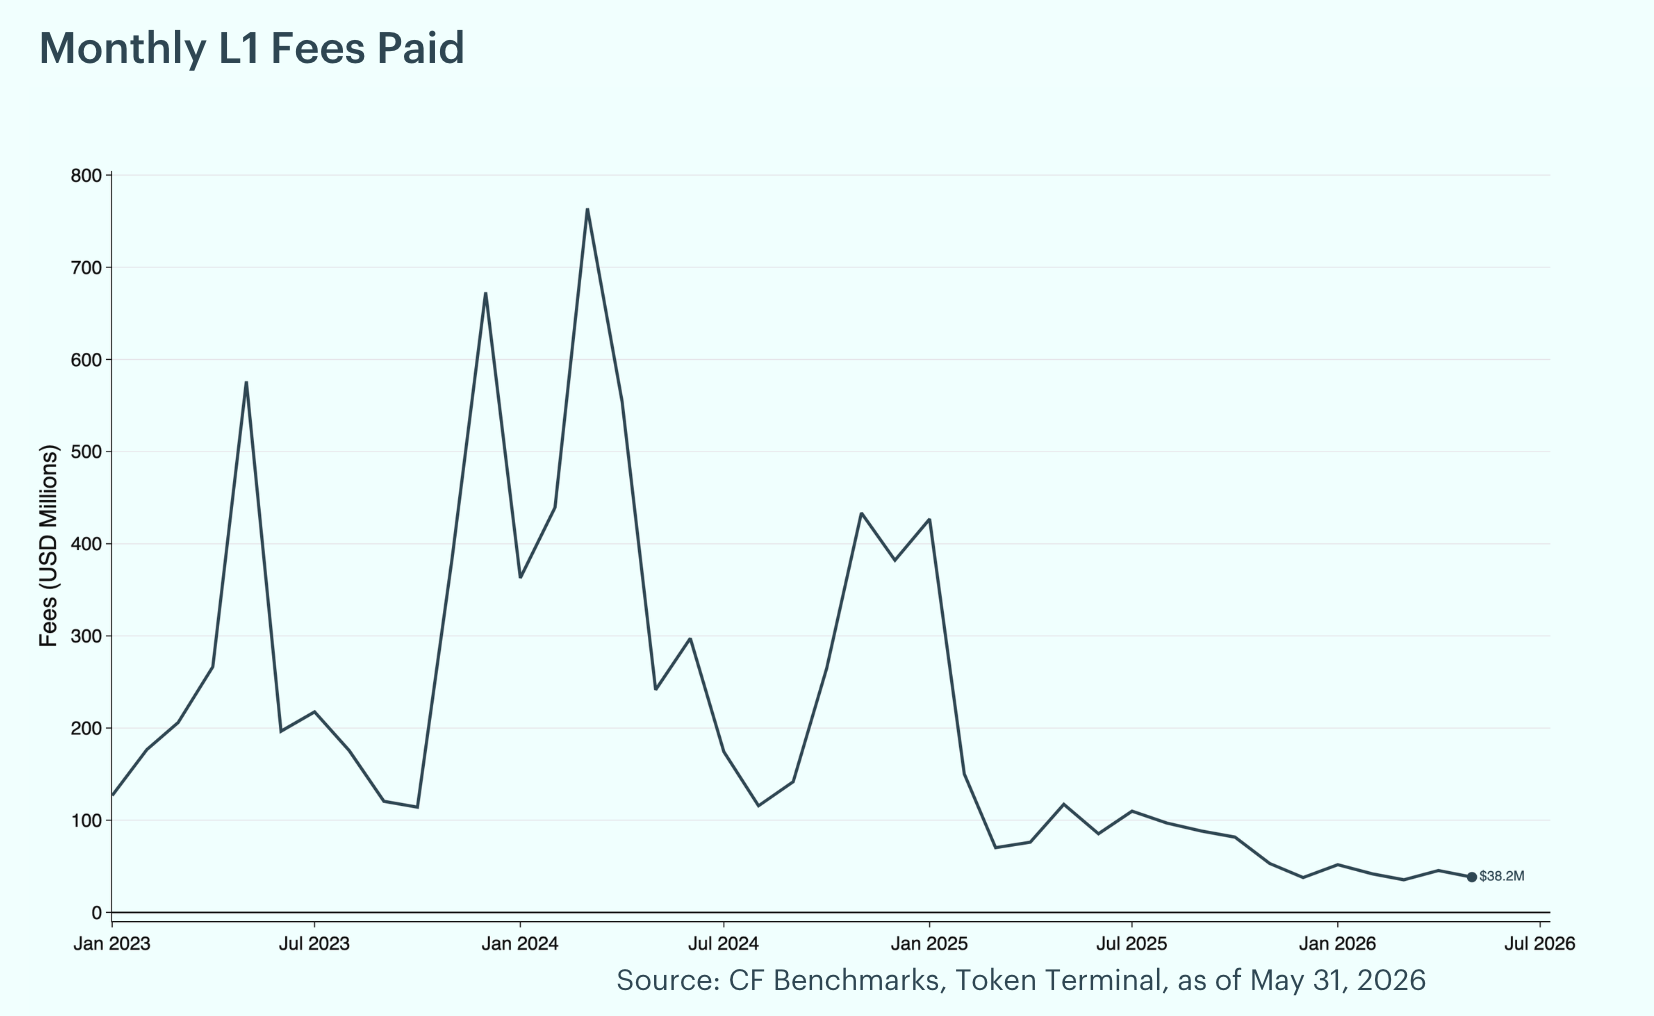
Layer-1 Fees Pull Back, Ethereum Still Leads: Fees are the charges users pay to record transactions and data on a blockchain and act as a gauge for demand to use these networks. They tend to rise when there is an influx of new users on-chain and can fall when activity wanes or scaling upgrades reduce costs. Total Layer-1 fees fell 15.9% month-over-month in May to $38.2 million from $45.5 million in April. Ethereum led with $16.7 million (43.6% of the total) despite a 32.1% drop, followed by Solana at $14.4 million (37.6%, down 5.4%) and Bitcoin at $6.9 million (18.1%, up 27.3%).
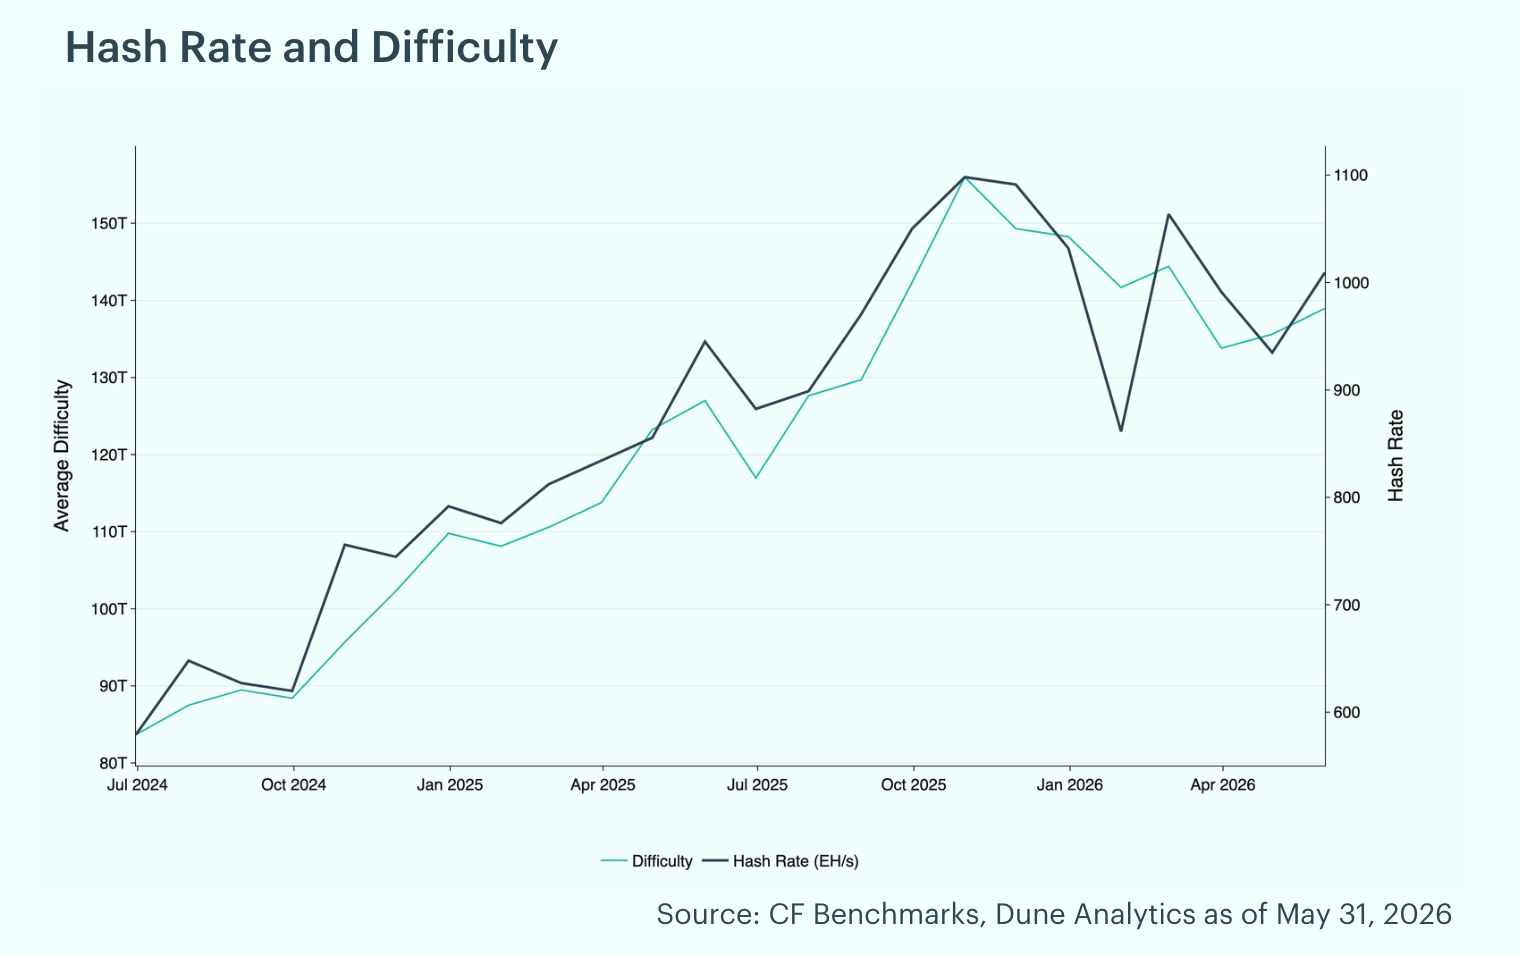
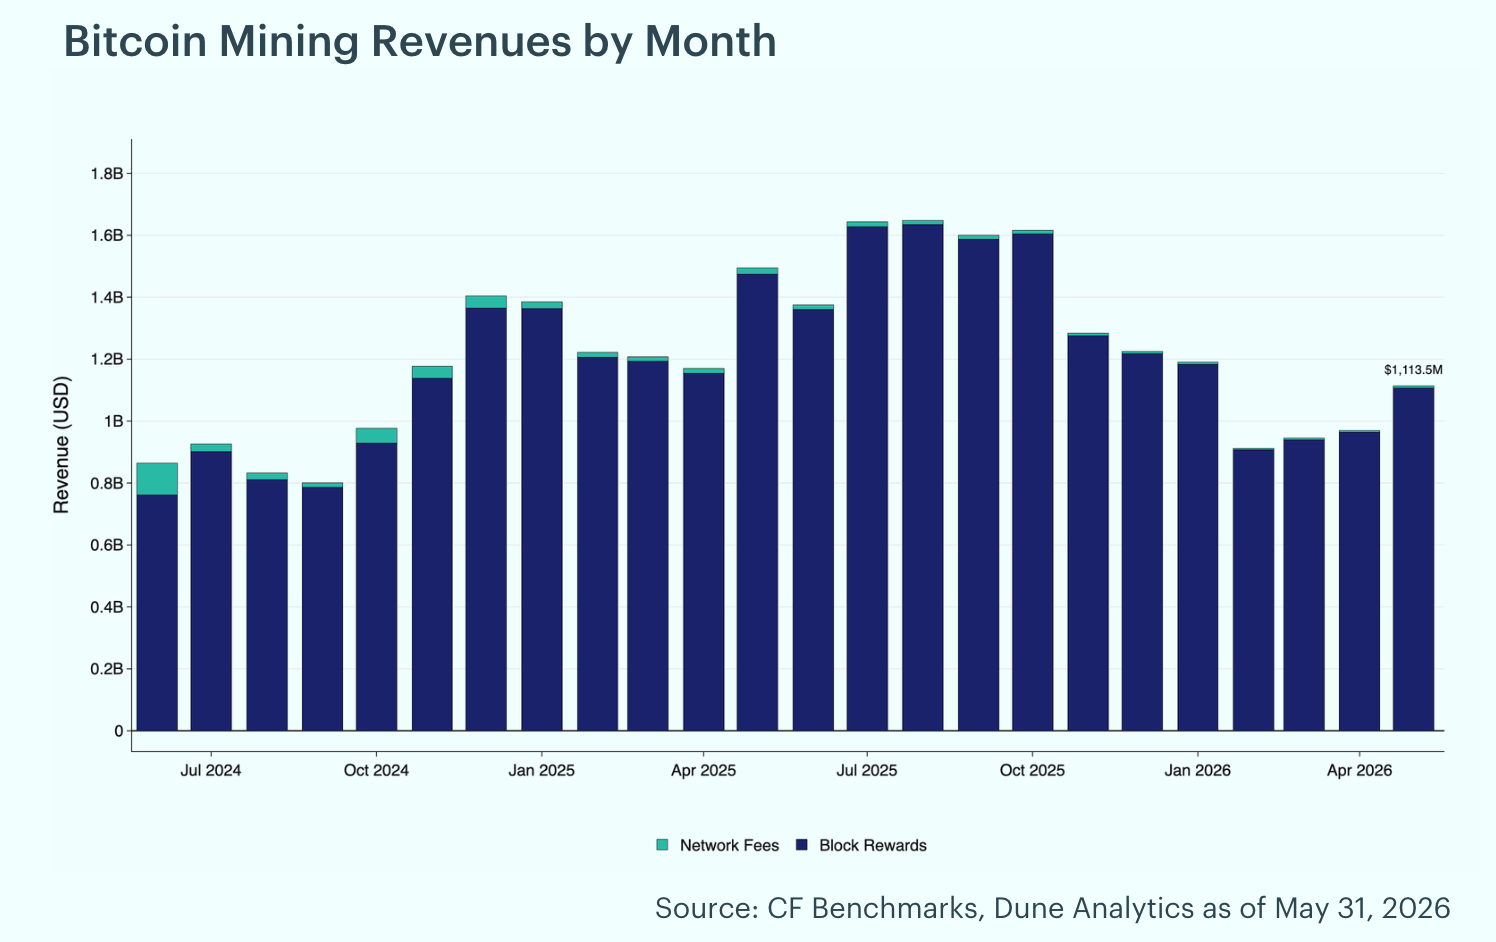
Hash Rate Rebounds, Mining Revenue Climbs: Bitcoin's hash rate rebounded 8.0% in May, rising to 1,009 exahashes per second from 935 EH/s at April's end. Mining difficulty, which measures the computational effort required to mine a new block and adjusts to maintain consistent block times, increased 2.5% to 139.0T as the network tightened to absorb the recovery in hash power. Miners saw a 14.9% increase in revenue, with total mining revenue of $1,113.5 million. Of the total rewards earned during the month, 0.6% came from transaction fees, with block rewards totaling $1,106.5 million and fees contributing $6.9 million. The gain was driven by the rebound in network hash rate alongside firmer Bitcoin prices through the month.
To read the complete report, click here to view a PDF version. Additionally, please do not forget to subscribe to our latest news and research for the most relevant institutional insights on digital assets and the top digital assets by market cap.
The information contained within is for educational and informational purposes ONLY. It is not intended nor should it be considered an invitation or inducement to buy or sell any of the underlying instruments cited including but not limited to cryptoassets, financial instruments or any instruments that reference any index provided by CF Benchmarks Ltd. This communication is not intended to persuade or incite you to buy or sell security or securities noted within. Any commentary provided is the opinion of the author and should not be considered a personalised recommendation. Please contact your financial adviser or professional before making an investment decision.
Note: Some of the underlying instruments cited within this material may be restricted to certain customer categories in certain jurisdictions.
Changes to the Token Market Price Benchmarks Series - Market Prices – 21 July 2026
The Administrator has confirmed changes to the Token Market Price Family for the period 14 July 2026 to 21 July 2026.

CF Benchmarks
Softer CPI Reprices July Hike Risk & Lifts Digital Assets
Digital assets extended their recovery over the past week as cooler US inflation prints repriced Fed expectations; the bid was broad across the large cap indices, growth factor leadership returned, stablecoin funding repriced lower, and stress stayed isolated in names hit by token-specific news.
Mark Pilipczuk
Notice of the Demising of CF Dai-Dollar Settlement Price and Spot Rate
The Administrator announces that it will demise the CF Dai-Dollar Settlement Price (DAIUSD_RR) and CF Dai-Dollar Spot Rate (DAIUSD_RTI) which are members of the CF Digital Asset Index Family.
CF Benchmarks
By clicking Accept, you consent to CF Benchmarks's use of cookies.
Visit Cookie Settings to learn how CF Benchmarks uses cookies and to adjust your preferences.