
Oct 12, 2020
Square’s Bitcoin news was bigger than it looked
Square’s $50m BTC investment was followed by a significant surge in verified volume
$11,000 and chill
Bitcoin sentiment remains fair at the start of the week after definitive strides the week before saw price indisputably trade back above $11,000 for only the second clear occasion since August’s correction.
Still, price progress has continued in its weeks-long vein of slow and steady, undermining the significance of recent major industry news like Square Inc.’s $50m investment.
CF Benchmarks’ regulated CME CF Bitcoin Reference Rate topped out for the year so far at $12,165.74 on 17th August. It then based at 10,048.42 on 7th September.
XBT-USD then hovered at just over $10,000 till early October. As such, the advance to $11k—a round number that technical chart watchers regard as ‘psychological’—has enhanced market significance.
To be sure, the recovery of crypto sentiment over the last month or so can be attributed to several external factors. BTC can no longer be credibly seen as a ‘decorrelated’ asset. S&P 500’s chunky rally since 23rd September is a clear enough corollary. That said, the effect of recent Bitcoin-specific news can’t be discounted.
MicroStrategy’s mega investment
Outside of specialised circles it’s fair to say that business intelligence firm MicroStrategy was fairly obscure till a couple months ago. It made its name in August after filing the biggest direct investment in Bitcoin by a U.S.-listed firm. An initial $250m purchase equated to some 25% of the firm’s total market value. The group went on to reveal in the weeks that followed that it had expanded its BTC holding to $425m.
Square time for Bitcoin
Even so, it’s possible that Square’s acquisition of $50m worth of Bitcoin, revealed last week, eclipsed MicroStrategy’s in terms of importance.
Clearly, having a Silicon Valley notable like Dorsey—a known Bitcoin enthusiast—attached, helped power hyperactive crypto sentiment to the upside.
Square tweeted news of its purchase at 13:05 UTC on 8th October. As the chart of our Bitcoin Real Time Rate for the hours that followed shows, prices were buoyed in the wake of the announcement.
CME CF Bitcoin Real Time Rate – 13.00 – 17.59 UTC, 08-10-2020 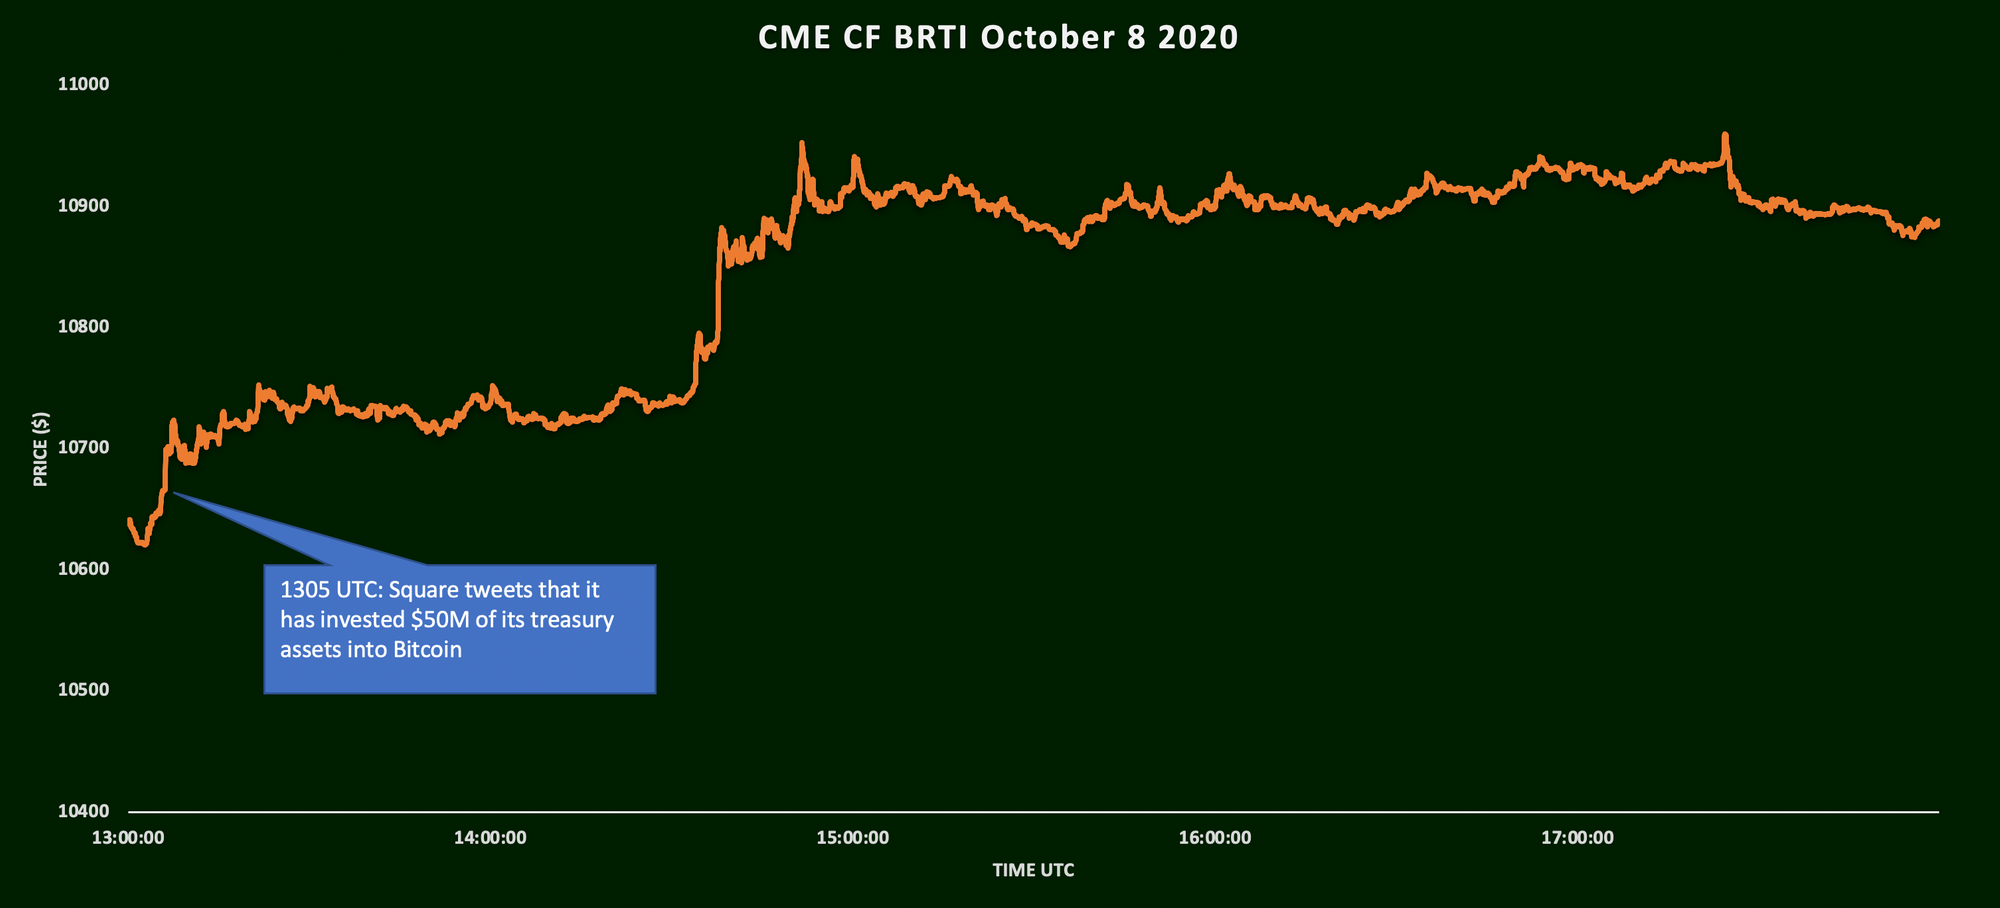
Source: CF Benchmarks
And though Square’s buy was more modest in absolute terms than MicroStrategy’s, with Square purchasing 4,709 Bitcoins, or some 1% of its total assets by end Q2, the significance and commitment behind the outlay was just as weighty.
Volumes pumped
Either way, the importance for Bitcoin price sentiment was underscored by a spike in trading volume. The jump ought to be regarded as just as unequivocal as the price move. There was strong corroboration from CF Benchmarks’ regulated volume data. By definition, all data must cross stringent controls before admission to our indices. 1. Price data are sourced from a regularly-reviewed cohort of bona fide exchanges. 2. These venues must meet strict criteria on each review. With CF Benchmarks’ real-time Bitcoin volume surging by a multiple of more than 2.5 times the 90-day average, there’s little doubt the market saw Square’s move as hyper-bullish.
Bitcoin-USD volume from CME CF BRTI constituent exchanges 12-00 UTC – 19.00 UTC, 08-10-2020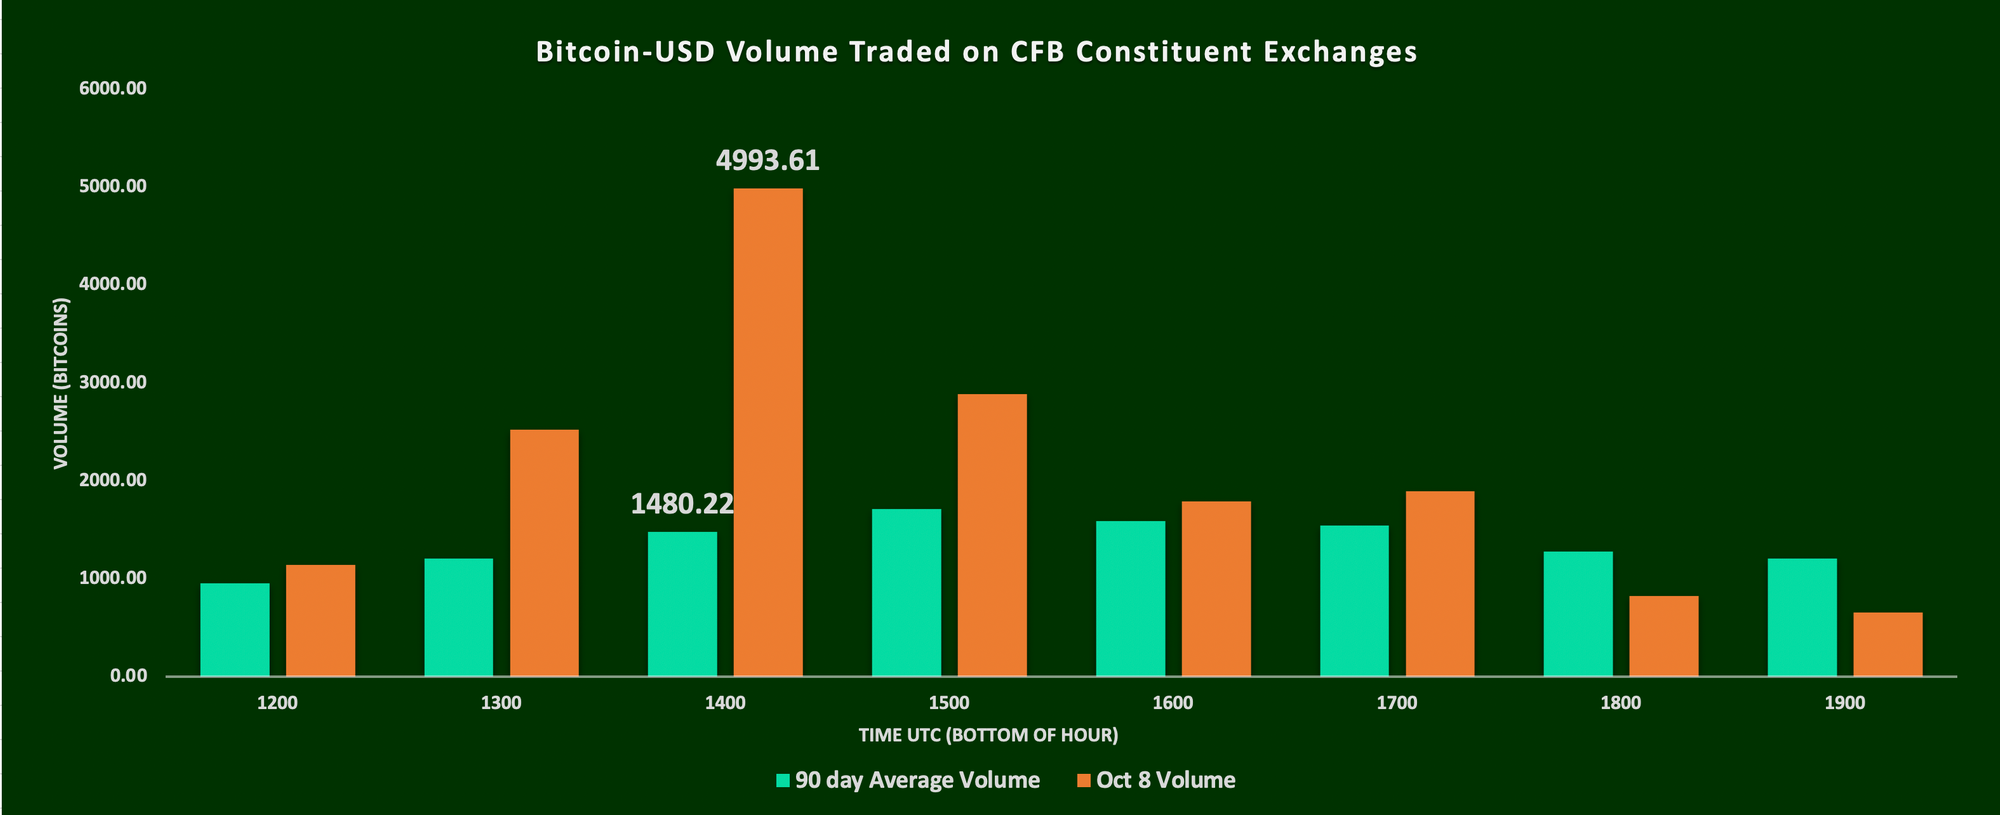
Source: CF Benchmarks
The information contained within is for educational and informational purposes ONLY. It is not intended nor should it be considered an invitation or inducement to buy or sell any of the underlying instruments cited including but not limited to cryptoassets, financial instruments or any instruments that reference any index provided by CF Benchmarks Ltd. This communication is not intended to persuade or incite you to buy or sell security or securities noted within. Any commentary provided is the opinion of the author and should not be considered a personalised recommendation. Please contact your financial adviser or professional before making an investment decision.
Note: Some of the underlying instruments cited within this material may be restricted to certain customer categories in certain jurisdictions.
Factor Friday - July 24, 2026
Beta's four-week grind higher stalled this week as style leadership rotated again: Momentum took the top spot, last week's leader Value fell to the bottom, and Growth stayed July's weakest factor. Size remains the only style factor positive on the year; beta, not style selection, is setting returns.

Mark Pilipczuk
Changes to the Token Market Price Benchmarks Series - Market Prices – 21 July 2026
The Administrator has confirmed changes to the Token Market Price Family for the period 14 July 2026 to 21 July 2026.
CF Benchmarks
Softer CPI Reprices July Hike Risk & Lifts Digital Assets
Digital assets extended their recovery over the past week as cooler US inflation prints repriced Fed expectations; the bid was broad across the large cap indices, growth factor leadership returned, stablecoin funding repriced lower, and stress stayed isolated in names hit by token-specific news.
Mark Pilipczuk
By clicking Accept, you consent to CF Benchmarks's use of cookies.
Visit Cookie Settings to learn how CF Benchmarks uses cookies and to adjust your preferences.