
Jul 20, 2026
Softer CPI Reprices July Hike Risk & Lifts Digital Assets
Weekly Index Highlights, July 20, 2026
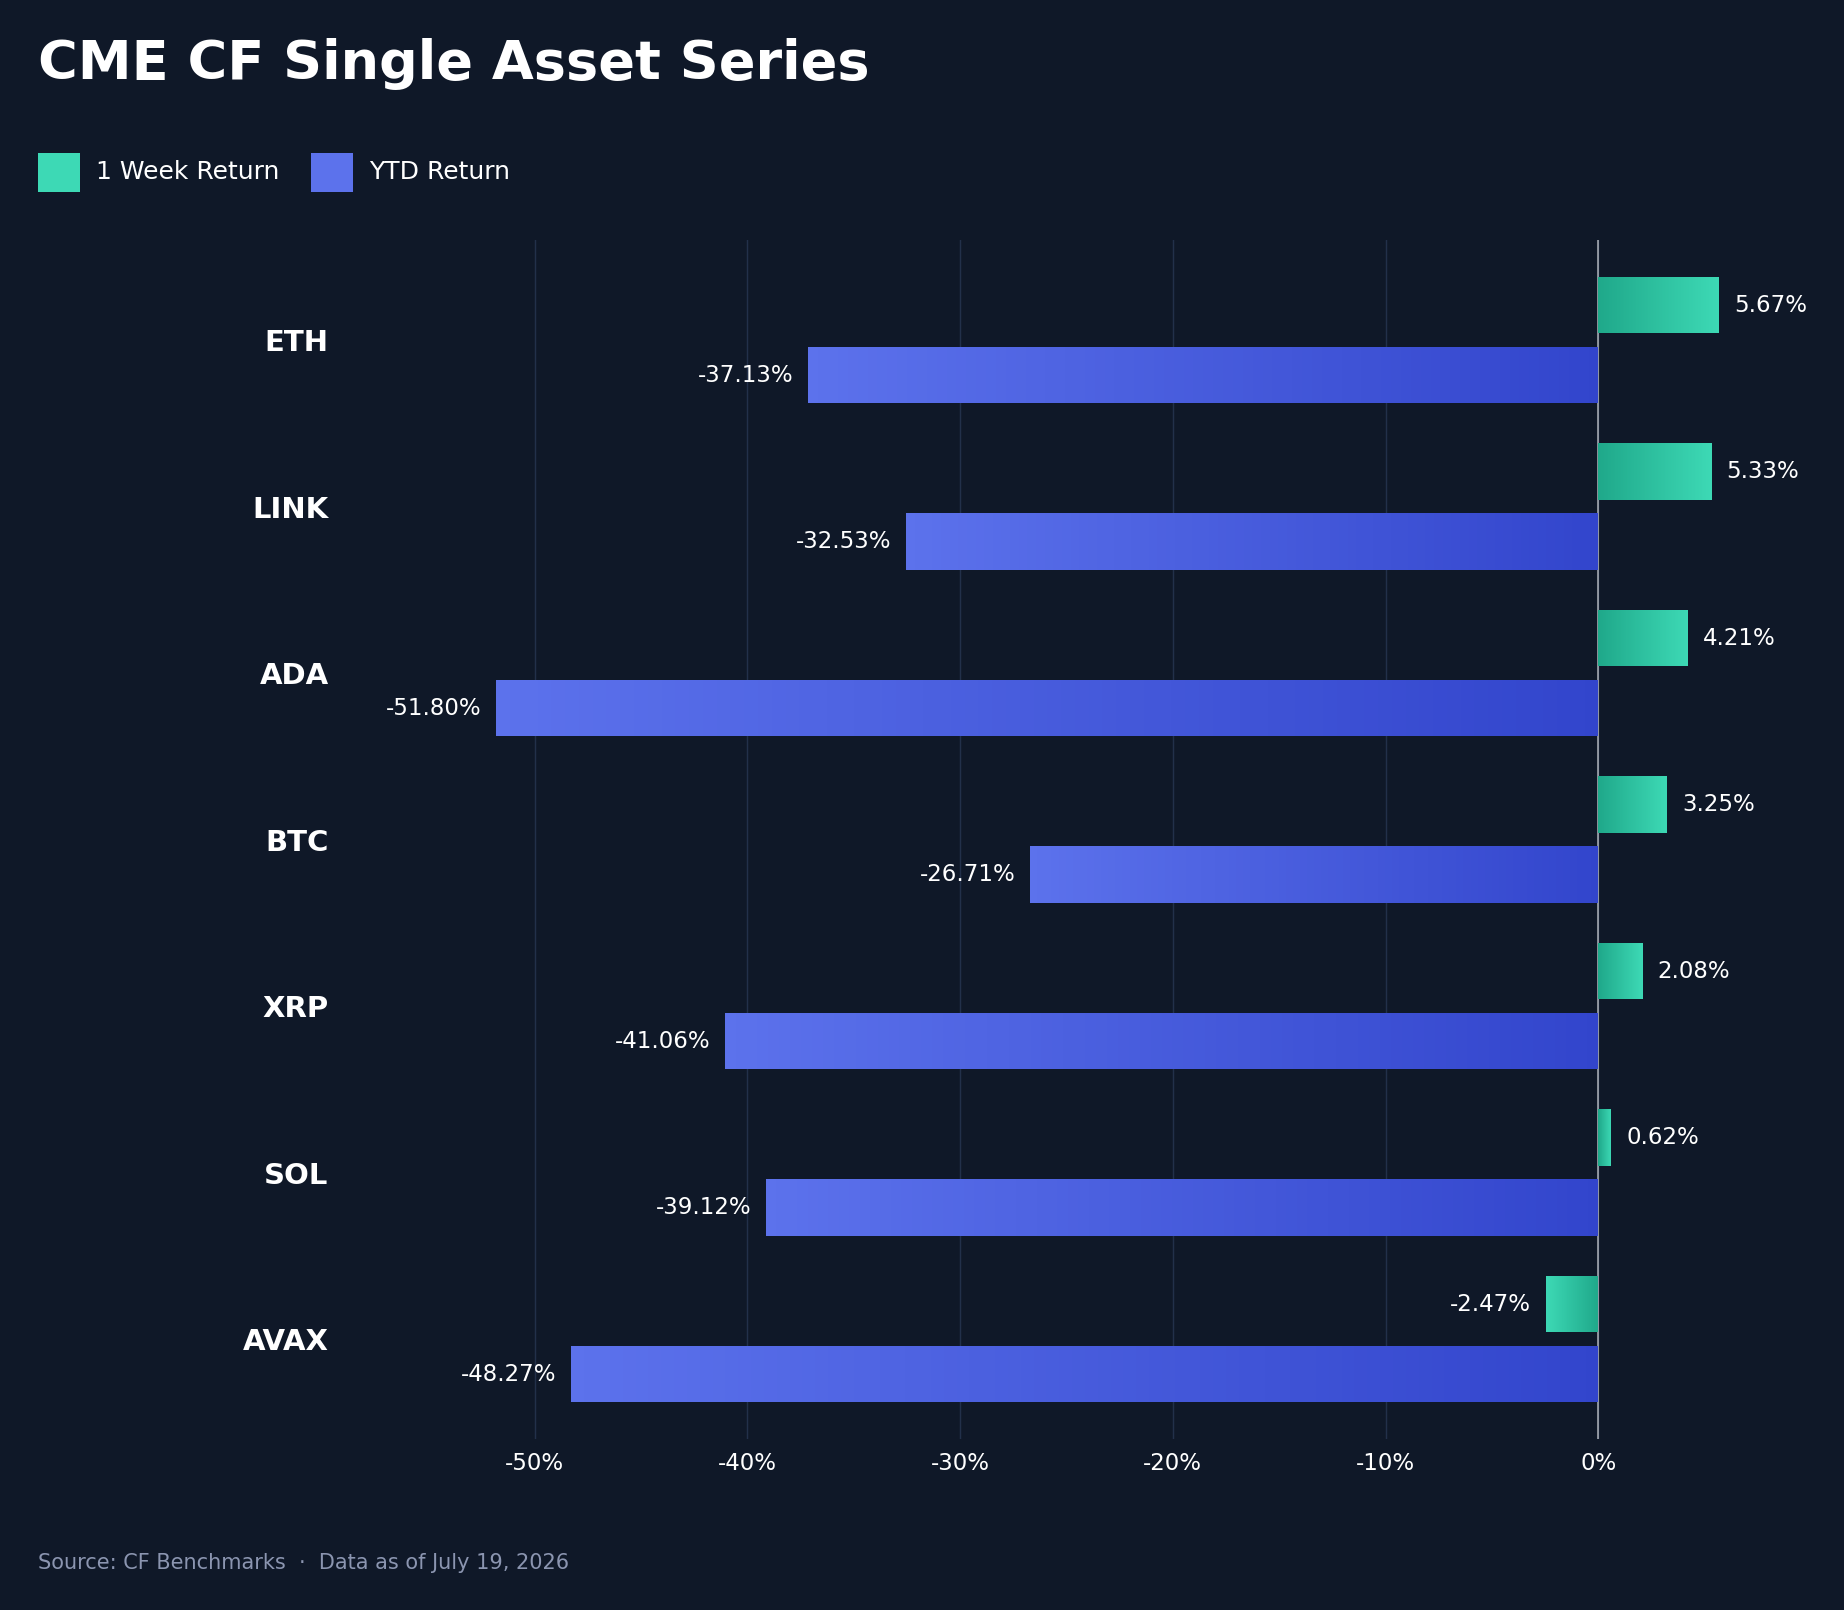
Digital assets closed the week of July 13th to July 19th broadly higher. Six of the seven CF Single Asset Series names posted gains, led by Ether (ETH) at +5.7% with Bitcoin (BTC) up +3.2%, and all six CF Capitalization Series indices rose, with the CF Ultra Cap 5 out front at +3.38%. The driver was a single macro repricing. Coming into Tuesday, interest rate futures had priced roughly even odds of a Fed hike at the July meeting; by Wednesday evening an interest rate hike was largely priced out. June’s Consumer Price Index (CPI) fell 0.4% month over month (MoM) against a 0.2% decline expected, June’s Producer Price Index (PPI) followed at -0.3% MoM, and hike odds slid to 10 to 13%. Digital assets sold off into the first print, rallied out of the second, and spent Friday absorbing a sixth day of US strikes on Iran. The rally was broad but not uniform, and the dispersion across the majors is where the week’s story starts.
Market Performance Update
Six of the seven CF Single Asset Series names closed the week higher. ETH led at +5.7% week-on-week (w/w), leaving it -37.1% year-to-date (YTD), followed by Chainlink (LINK) at +5.3% (YTD -32.5%), Cardano (ADA) at +4.2% (YTD -51.8%), BTC at +3.2% (YTD -26.7%), XRP at +2.1% (YTD -41.1%) and Solana (SOL) at +0.6% (YTD -39.1%); Avalanche (AVAX), at -2.5% (YTD -48.3%), was the only decliner. The catalyst was Tuesday’s CPI release. The majors traded lower into the print, BTC down roughly 2.0% over the prior 24 hours near $62,400 while the hike scenario was still live, and the move reversed once the data undershot. Wednesday’s PPI confirmed the disinflation read, BTC cleared $65,000, and roughly $209m of crypto shorts were forced to cover, a squeeze that did as much as the data itself to power the midweek move. ETH’s leadership had a visible driver in flow: US spot Ether ETFs took in $105.4m for the week against $75.7m for the Bitcoin funds, where a $424.7m Monday redemption was only recovered across the following four sessions. AVAX’s decline had no identifiable in-week catalyst. Breadth improved from three gainers a week earlier to six of seven, with an 8.15 percentage point (pp) spread between ETH and AVAX. The repricing now has to survive the July 28th to 29th FOMC meeting itself, and the daily ETF flows will show whether the ETH-over-BTC demand pattern outlasts a single week.
Volatility Analysis
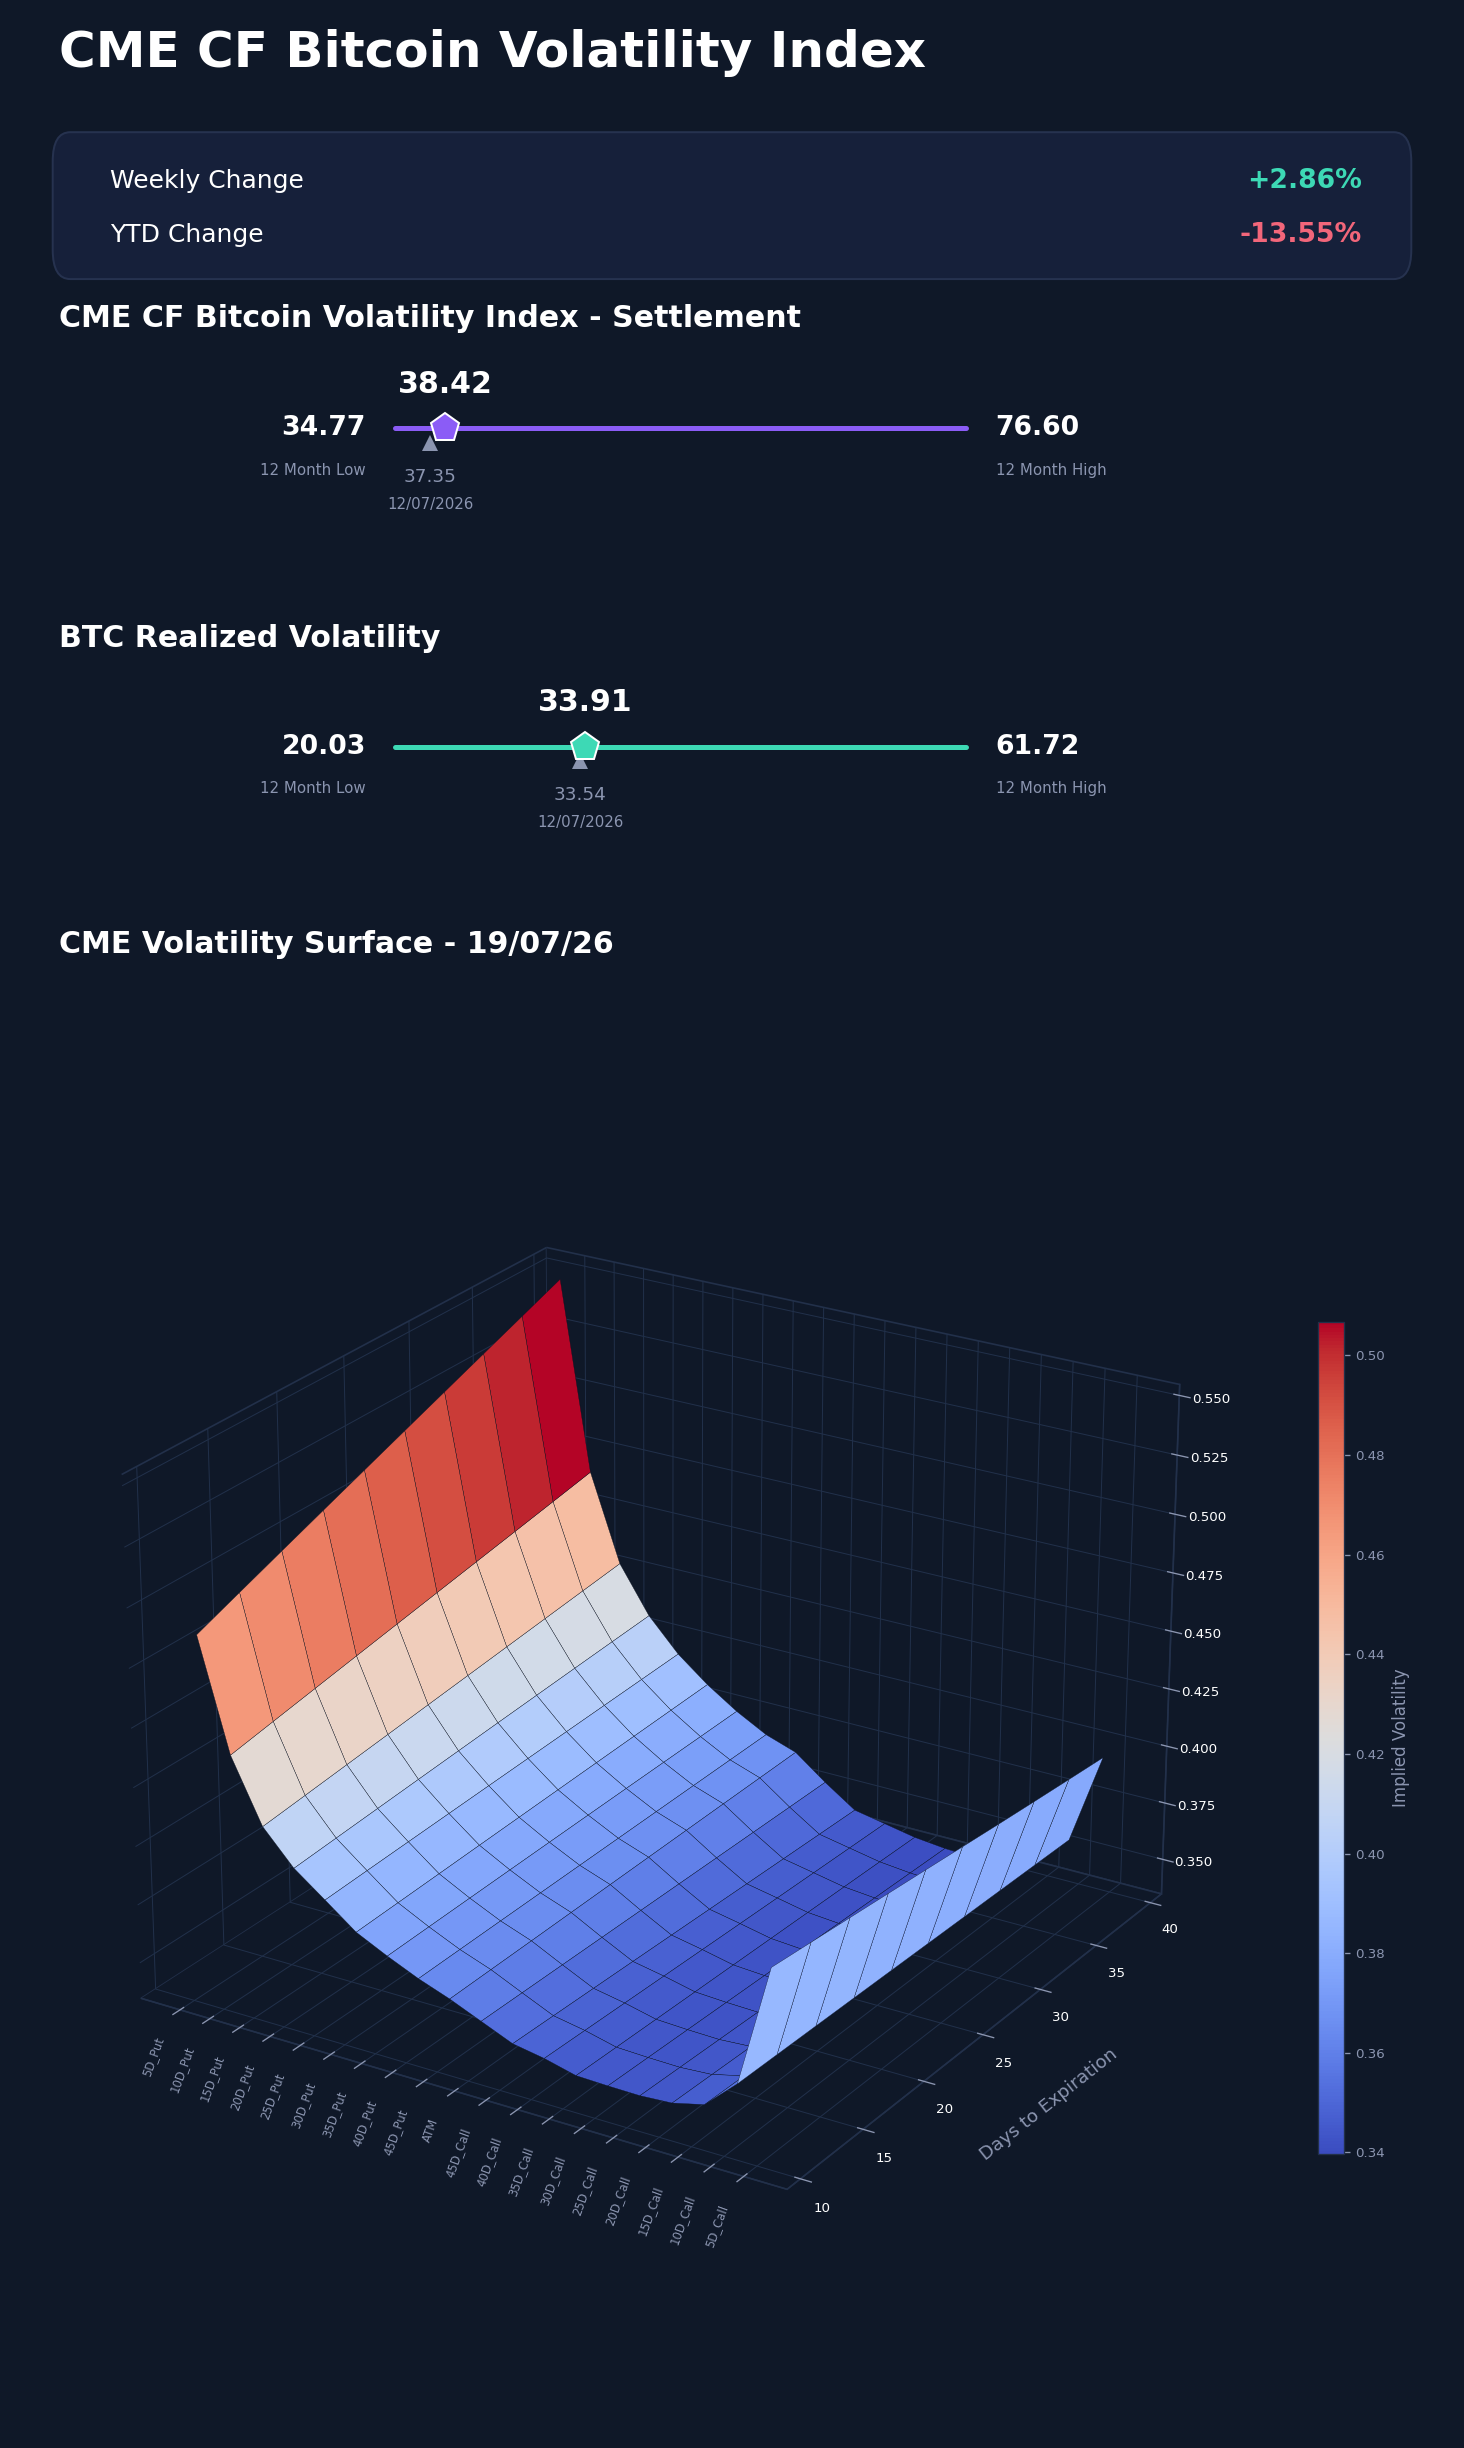
The CME CF Bitcoin Volatility Index Settlement (BVXS) settled Sunday July 19th at 38.42, 1.07 vol. points above the prior Sunday’s 37.35 and 3.65 points above its 34.77 twelve-month low. The path traced the week’s two stories. BVXS entered the week at its high of 39.12 on Monday July 13th, while the CPI outcome was still an open question, then stepped down through the two inflation sessions to a weekly low of 37.54 on Wednesday July 15th as the hike scenario came out of the price of near-term insurance. From Thursday the move reversed as the Iran strikes extended, with BVXS rebuilding to 38.62 on Friday. Realized 30-day volatility barely moved, 33.91 against 33.54 a week earlier, mid-range within its 20.03 to 61.72 twelve-month band, so the implied-realized spread widened to 4.51 vol. points from 3.81: holders are paying up for protection that realized volatility has not yet required, a hedging posture against the geopolitical weekend rather than distress. BVXS remains 13.55% below its 44.44 start-of-year reference. The surface shows the same rotation in cross-section: versus the July 12th snapshot the long end was little changed while the short end firmed, at-the-money up 2.14 vol. points and the 25-delta call up 2.79; the short-end 25-delta put skew narrowed 0.70 points to 3.28; and the extreme short-dated call-wing kink of a week ago, a 5-delta call at 57.92 vol (24.45 points over at-the-money) at the 18-day tenor, has gone, printing 41.27 (5.66 over) at this week’s 11-day tenor, upside crash pricing normalizing once the event passed. The two snapshots’ tenor grids differ, so these are snapshot-versus-snapshot reads. The open question is whether the implied-realized gap closes from above as Iran headlines fade or holds as FOMC hedges go on; a print near the 34.77 twelve-month low would mark a volatility washout.
Market Cap Index Performance
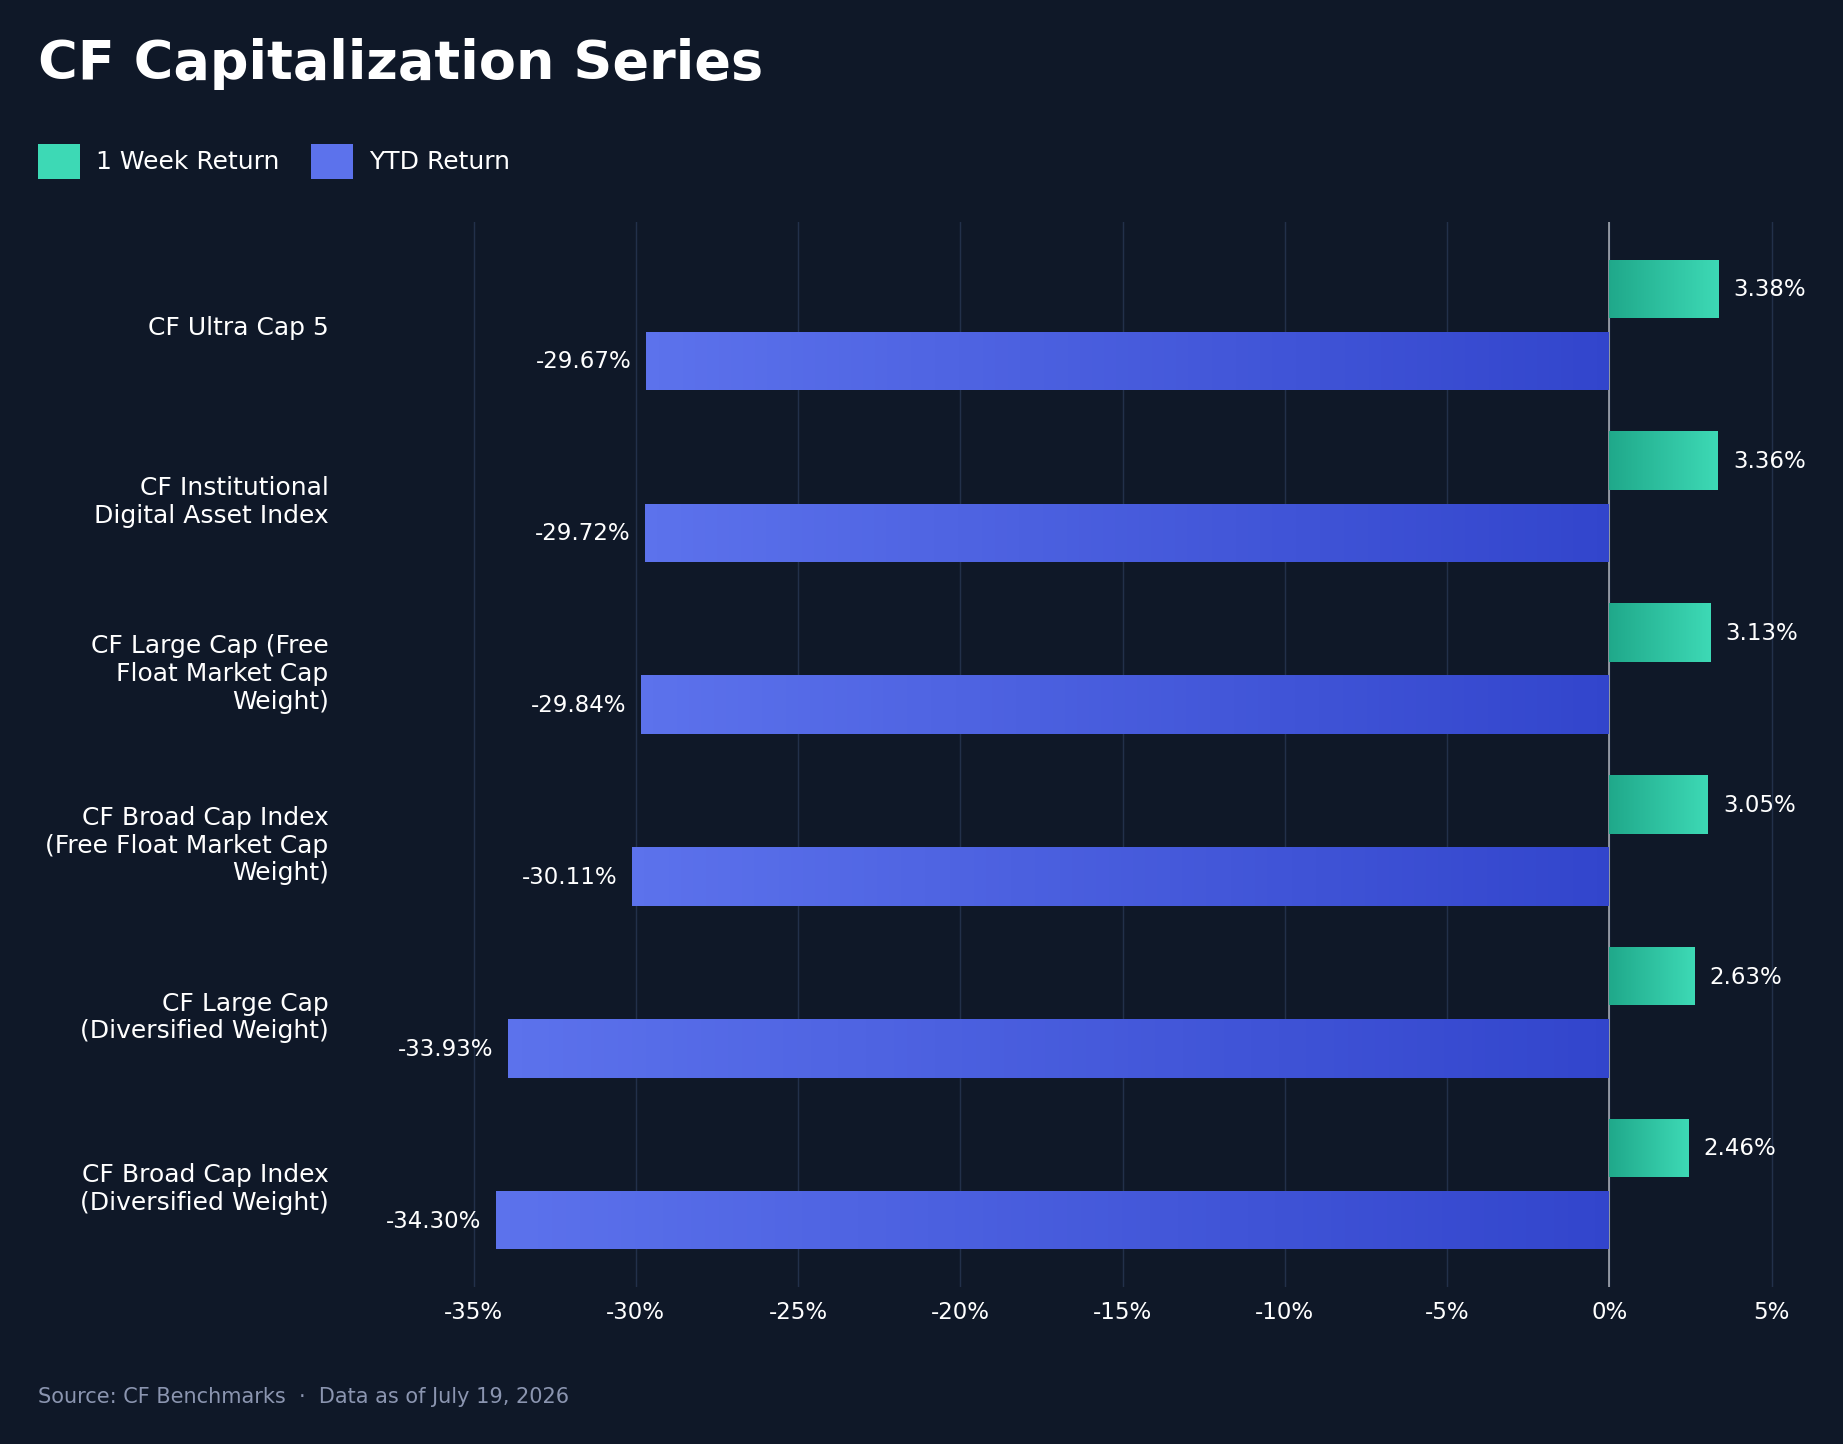
All six CF Capitalization Series indices rose: CF Ultra Cap 5 led at +3.38% w/w (YTD -29.67%), the CF Institutional Digital Asset Index at +3.36% (YTD -29.72%), the CF Large Cap (Free Float Market Cap Weight) at +3.13% (YTD -29.84%), the CF Broad Cap Index (Free Float Market Cap Weight) at +3.05% (YTD -30.11%), the CF Large Cap (Diversified Weight) at +2.63% (YTD -33.93%) and the CF Broad Cap Index (Diversified Weight) at +2.46% (YTD -34.30%), a 0.92 pp top-to-bottom range. The driver was the same disinflation repricing: ETH and XRP had traded off 2% or more alongside BTC into the CPI print and recovered with it. Underneath the levels, free float beat diversified weighting for a second week, but the margin compressed to 0.50 pp at the large-cap pair and 0.59 pp at the broad-cap pair, from 1.56 to 1.63 pp a week earlier; mid-caps such as ADA and LINK kept pace with the mega-caps, so capping BTC and ETH cost the diversified variants less. That compression is consistent with a broadening rally, and the Ether funds out-taking the Bitcoin funds on the week points the same way. The free float to diversified gap remains the cleanest weekly gauge of participation from here: further closing in an advancing market would mean the recovery is deepening beyond the ETF-wrapped majors, and a re-widening would mean leadership is narrowing back to them.
Factors Analysis
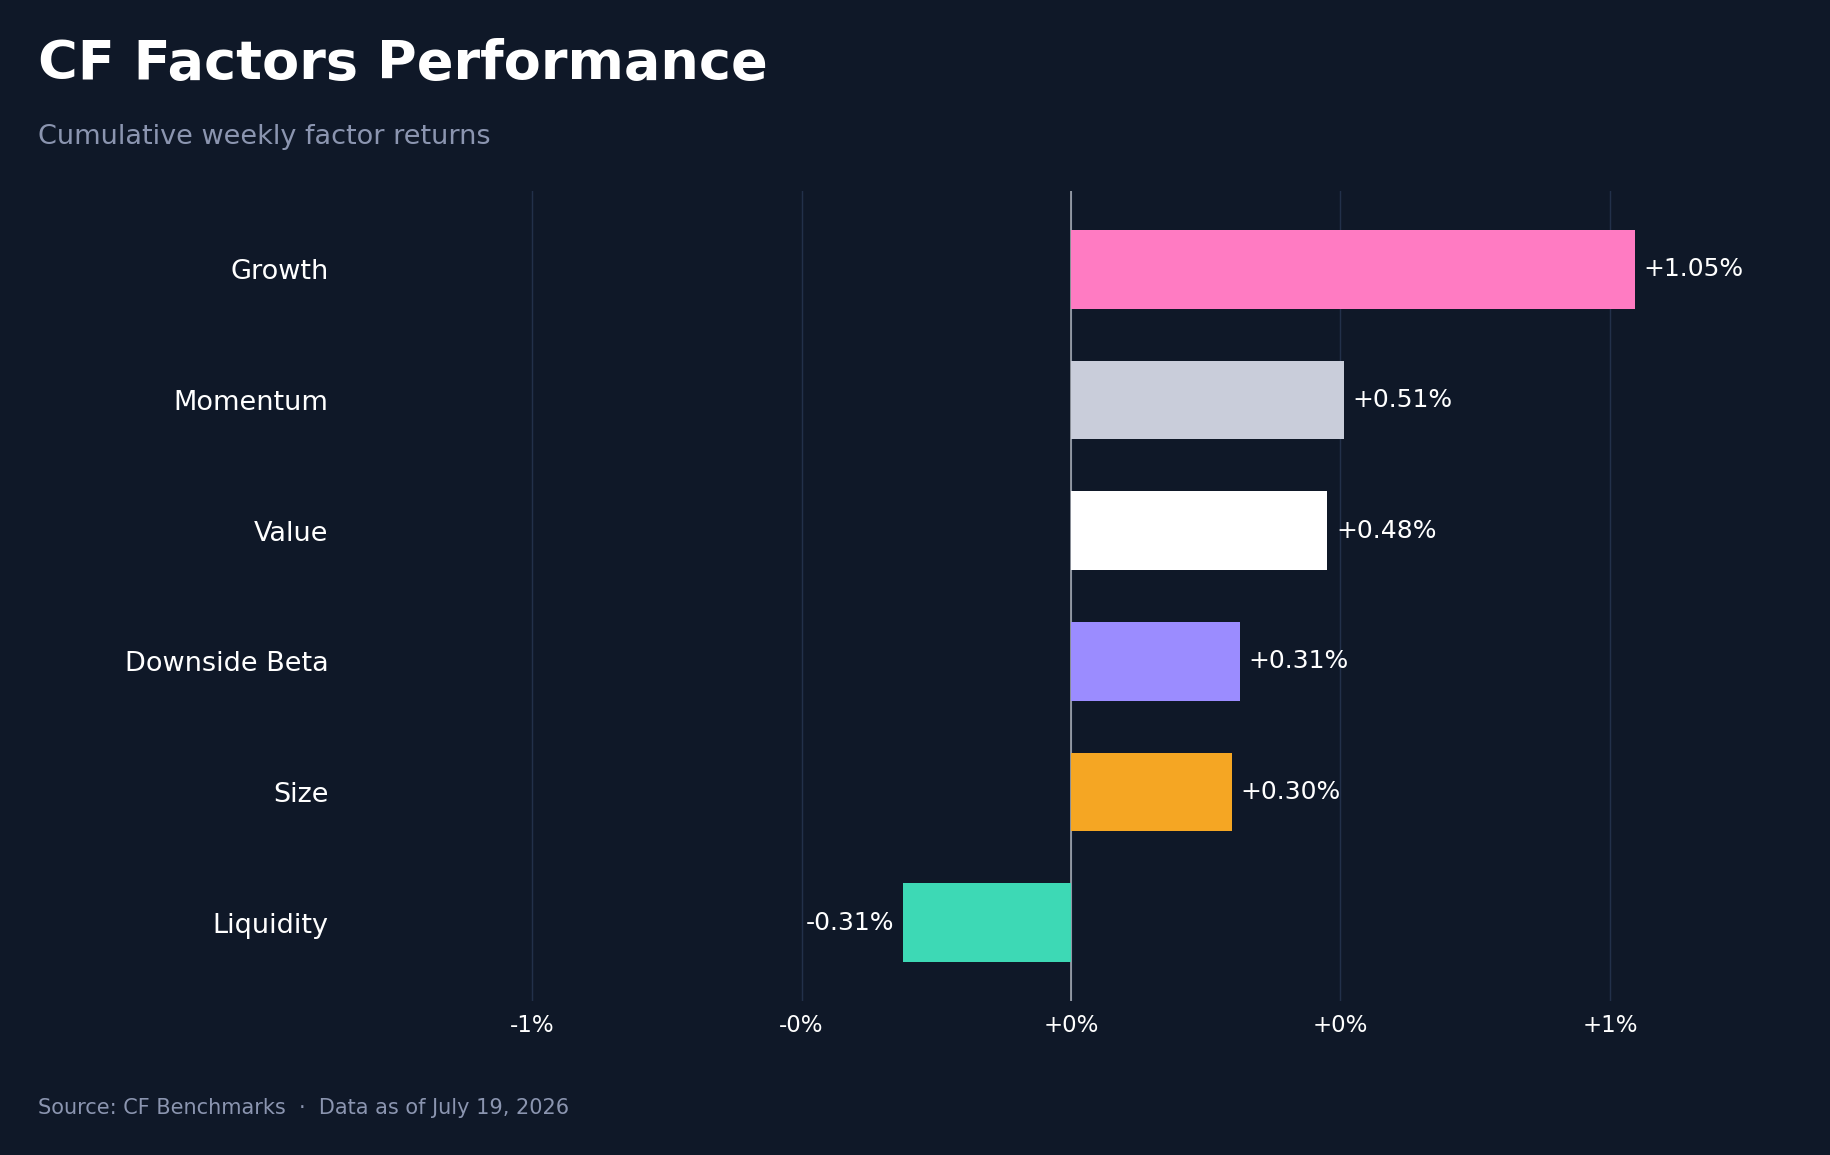
Cumulative weekly factor returns clustered in a 1.36 pp band, from Growth’s +1.0% to Liquidity’s -0.3%, and the tight range hides the week’s largest rotation. Growth swung +3.0 pp from -1.9% a week earlier, and the driver maps to the calendar: growth-tilted names trade like long-duration assets, so the CPI and PPI misses that pulled the discount-rate scare out of the market repriced them hardest. Momentum added +0.5% (from -0.1%) and Downside Beta +0.3% (from -0.2%), while Size, at +0.3%, gave back part of the prior week’s +1.0% leadership as the bid moved back up the cap spectrum. Value repeated at +0.5%, unchanged to within a tenth of a basis point, and Liquidity, at -0.3% from +0.4%, was the only factor to close negative: the market re-risked through the larger liquid growth names rather than reaching down the liquidity spectrum for beta. Factor leadership is tracking events rather than trend: Size led on the payrolls miss a week ago and Growth led on the inflation miss this week. Whether Growth holds the lead through the FOMC is the next test, the first scheduled catalyst in this run that could cut against the disinflation trade rather than for it.
Read our latest weekly crypto factors report: Factor Friday - July 17, 2026
Classification Series Analysis
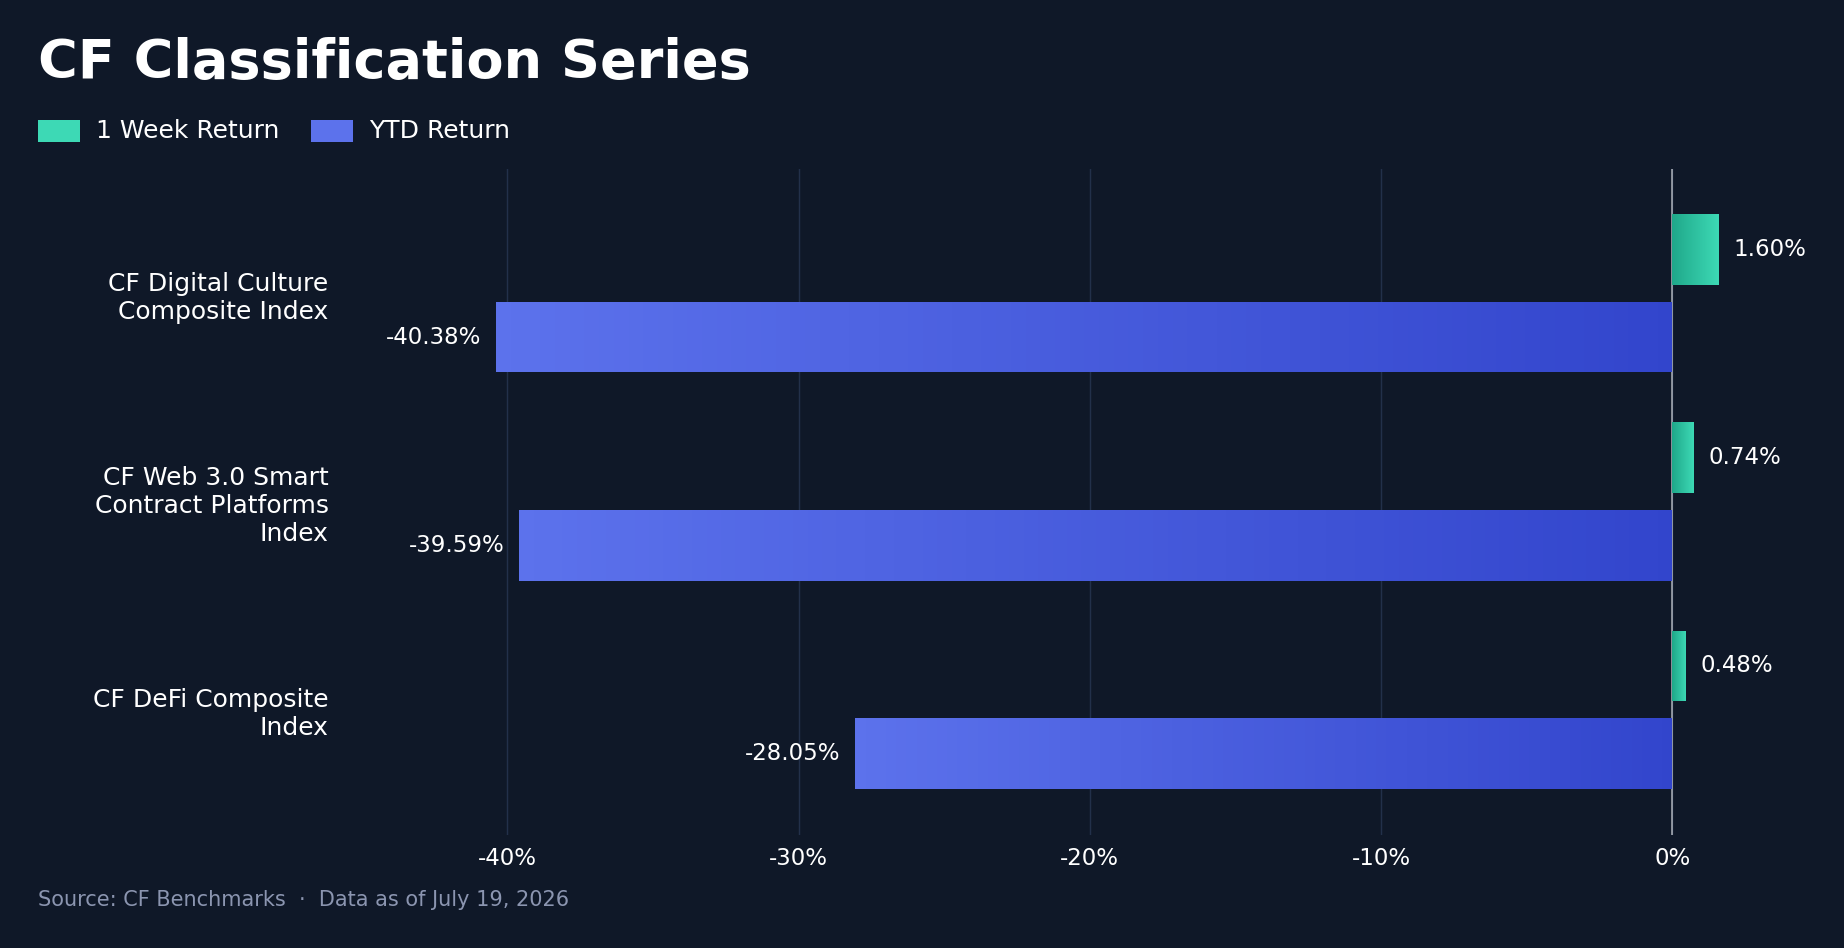
All three CF Classification Series composites rose and the order inverted: the CF Digital Culture Composite Index led at +1.60% w/w (YTD -40.38%), the CF Web 3.0 Smart Contract Platforms Index added +0.74% (YTD -39.59%), and the CF DeFi Composite Index went from first to last at +0.48% (YTD -28.05%), leaving Culture 1.13 pp ahead of DeFi and 0.86 pp ahead of Web 3.0. DeFi’s fade owes mostly to its own prior strength: the composite ran +5.25% a week earlier on named constituent moves, and with that catalyst spent it consolidated while the macro bid rotated through the rest of the market. Culture’s lead comes with a weighting caveat: the composite is capitalization-weighted, so the steep losses in smaller Culture names that dominate the equal-weighted sector read below carried little index weight here. The two disagree because of weighting, not because the data conflict. DeFi keeps the YTD lead among the three at -28.05%. That same spread, cap-weighted composite against equal-weight sector average, is the quickest weekly check on whether memecoin stress is spreading up the cap curve or staying contained in the small names.
Sector Analysis
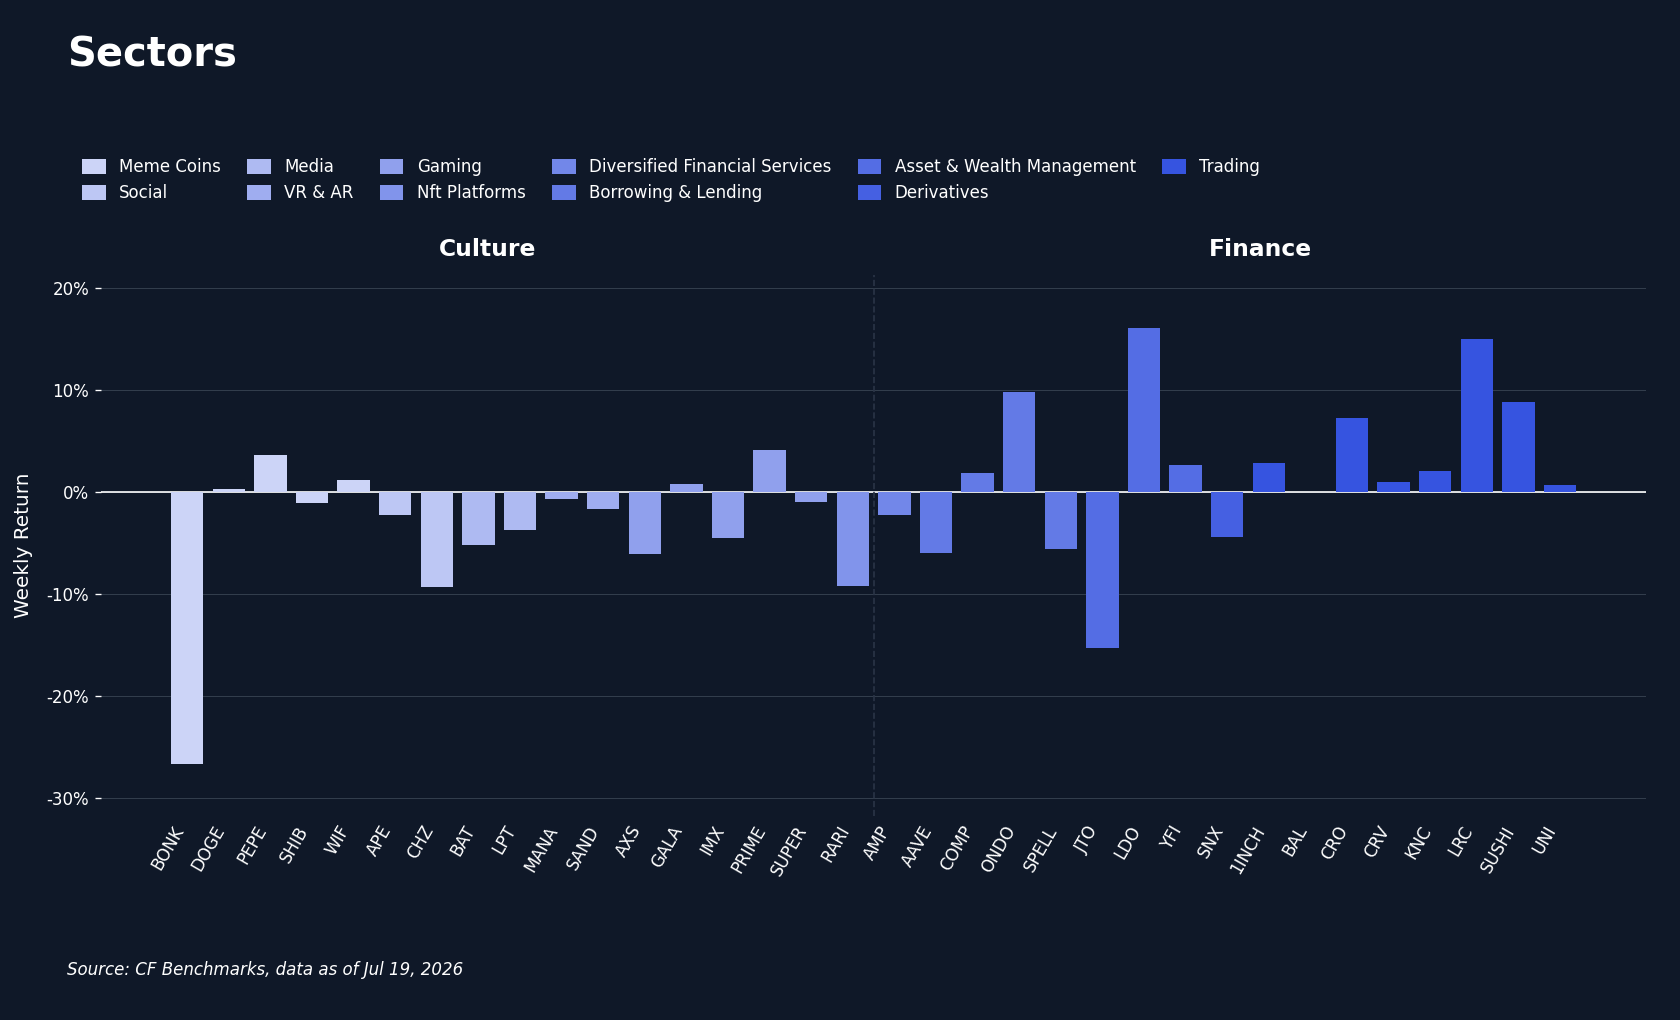
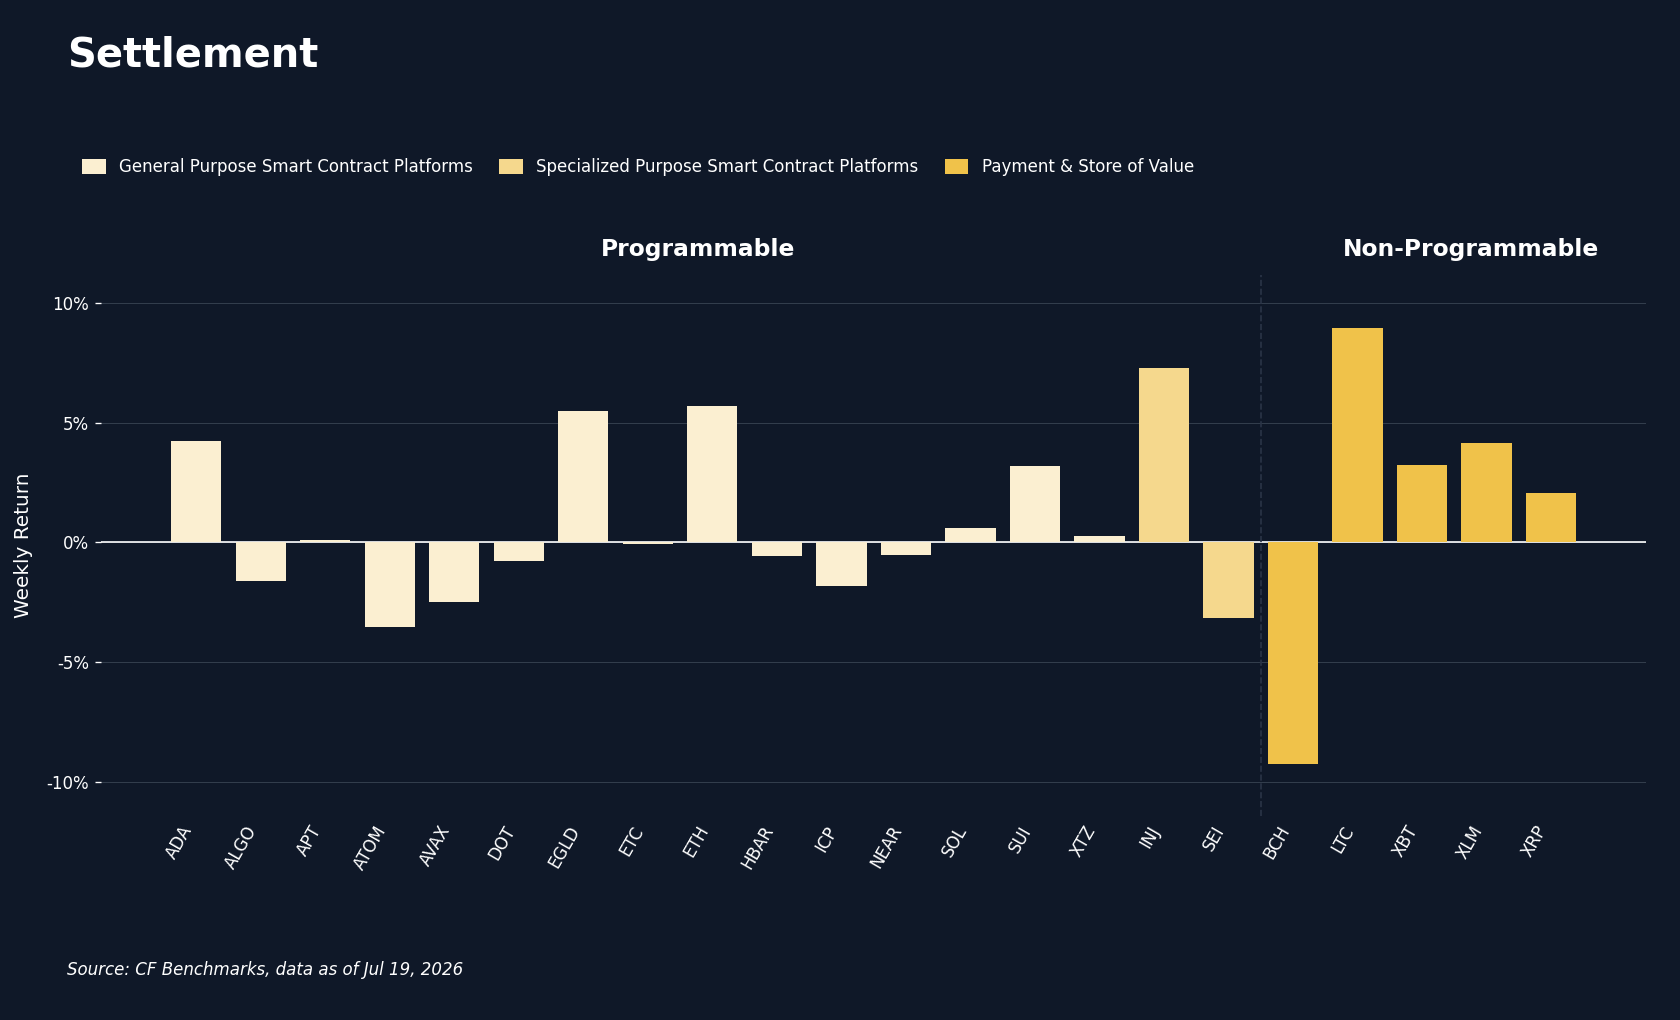
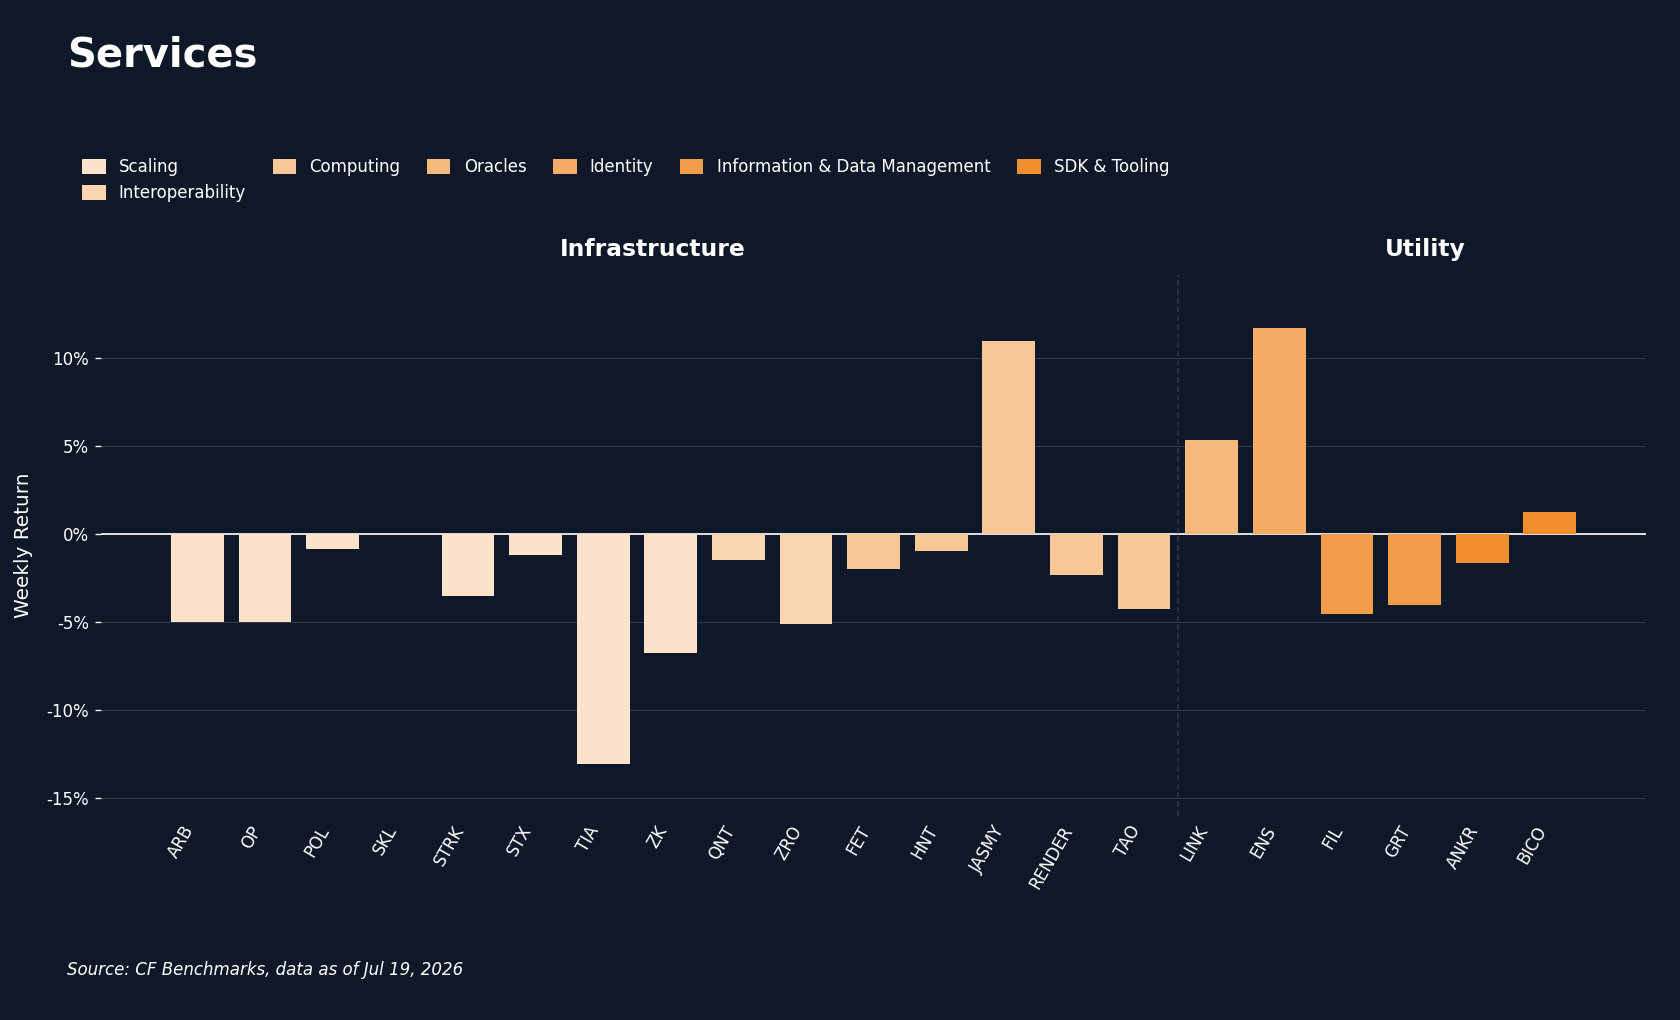
Sub-Category averages across our CF Digital Asset Classification Structure (CF DACS) taxonomy ran from Finance’s +2.03% to Culture’s -3.60%, a 5.63 pp spread, with Non-Programmable at +1.84%, Utility at +1.34%, Programmable at +0.72% and Infrastructure at -2.70%. Unlike the rest of the market, the drivers here were token-specific rather than macro. In Finance, Ondo Finance (ONDO) announced a partnership with SBI Group on July 16th to tokenize Japanese equities with settlement in SBI’s yen-denominated stablecoin; the market repriced ONDO as a named distribution rail for Japanese real-world assets, roughly +15% in the 24 hours after the announcement, and the token finished the week at +9.8% after a Sunday giveback. The sub-category’s lead was broader than the one catalyst: Lido DAO (LDO) topped all 77 tokens at +16.1% and Loopring (LRC) added +15.0%, with no single sourced in-week catalyst behind either. In Culture the mechanism was supply: the wallet behind the July 6th BonkDAO governance exploit sold a further 800 billion BONK (roughly $2.5m) on July 18th, Bonk (BONK) fell 9.8% in the following 24 hours, and the week closed with BONK at -26.6%, the widest laggard of all 77 and the anchor of Culture’s last place. That is an overhang specific to one name, not a de-rating of the Meme Coins segment, and it is measurable: the wallet still holds roughly 2.4 trillion BONK, so any further sales will print directly on Culture’s average. Jito (JTO) at -15.3% and Celestia (TIA) at -13.0%, the latter dragging Infrastructure’s average, filled out the bottom, while ENS (+11.7%) put Utility third. The token-level spread, LDO to BONK, was 42.77 pp against the 5.63 pp Sub-Category spread. On the policy side, the missed July 18th deadline for final GENIUS Act stablecoin rules and the CLARITY Act floor agenda are the next scheduled items with sector-level reach.
CF Staking Series
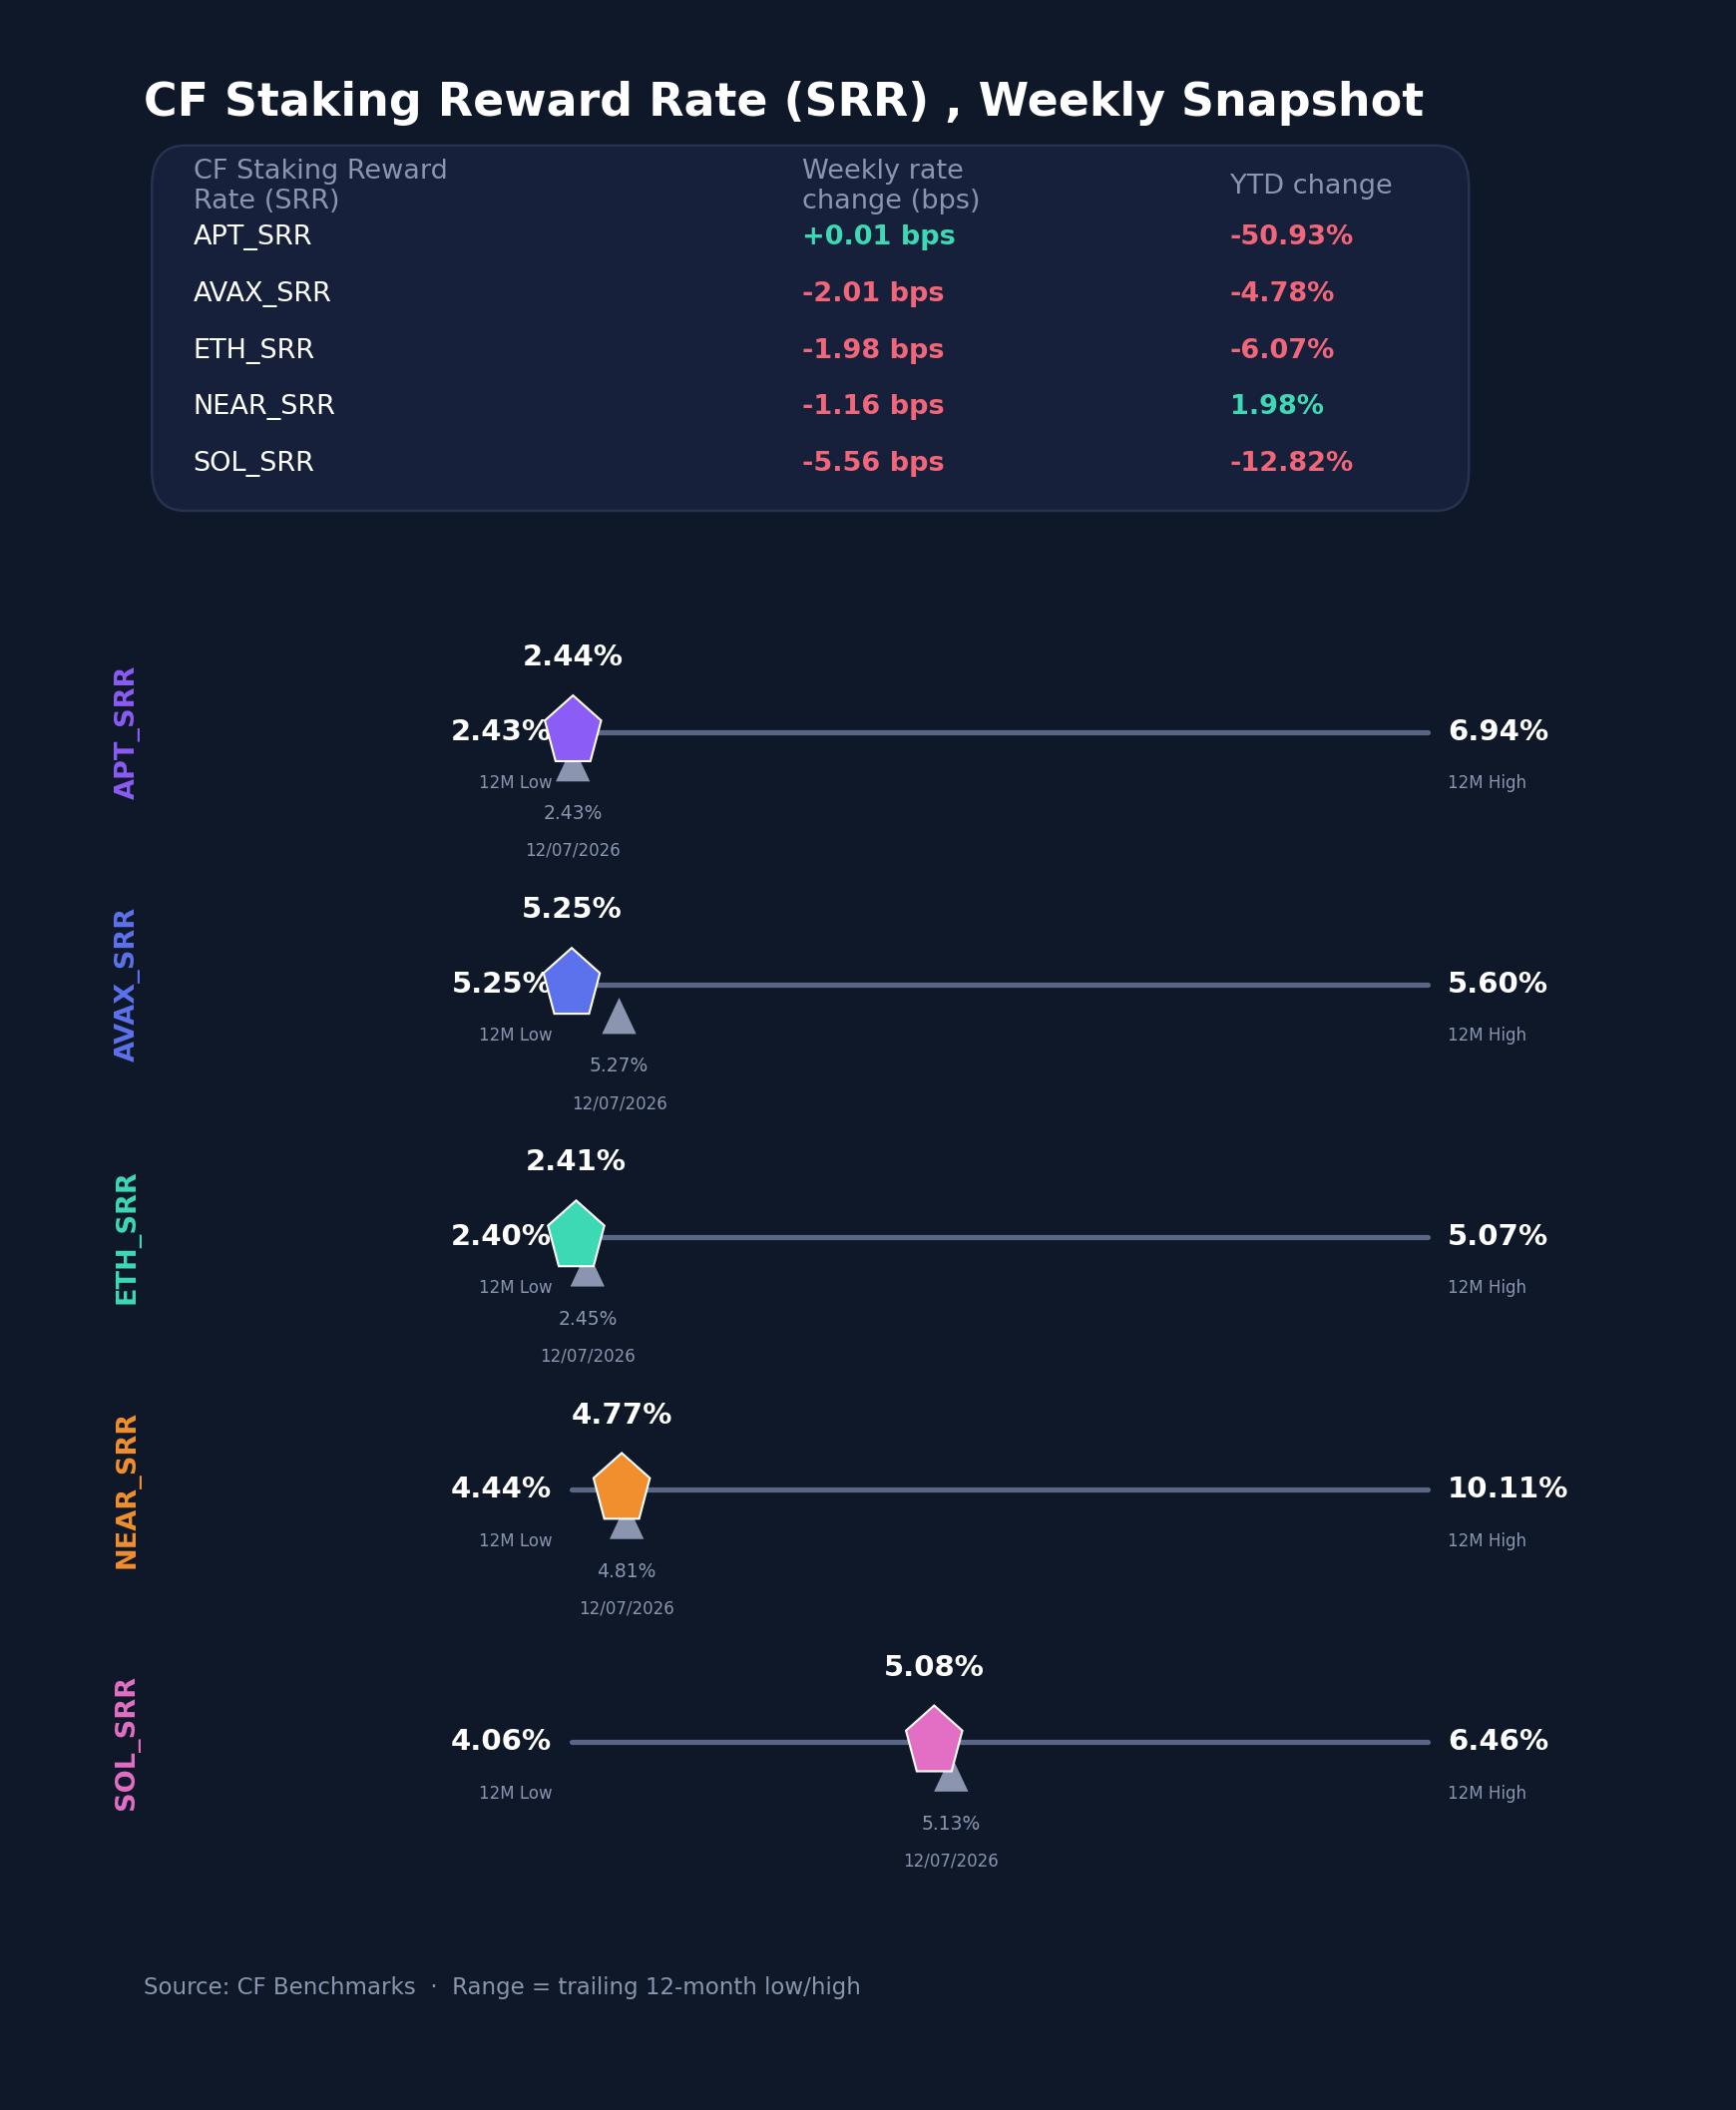
Weekly relative changes across the CF Staking Series ran from SOL Staking’s -1.1% to APT Staking’s flat 0.0%, a quiet set after the prior week’s dispersion. SOL’s reward rate eased from 5.1337% on July 13th to 5.0781% on July 19th, -5.6 basis points (bps) and the largest move in the set. AVAX slipped -2.0 bps from 5.2692% to 5.2491%, a fresh twelve-month low at the floor of its 5.2491% to 5.6045% band; ETH moved -2.0 bps from 2.4325% to 2.4127%, 1.4 bps above its own 2.3987% low; NEAR eased -1.2 bps from 4.7859% to 4.7743%; and APT held at 2.4353%, less than a basis point above its 2.4284% low. No dated in-week catalyst sits behind the drift; the pattern is a slow grind lower across the set, which now spans 2.4127% (ETH) to 5.2491% (AVAX) with three of the five rates at or within two basis points of twelve-month lows. The effect for index users is a carry floor that kept ratcheting lower even in a week when the underlying tokens rallied. Whether AVAX stabilizes at the new low or continues to set fresh ones is the next reading in that grind, and ETH sits closest to a print of the same kind.
Interest Rate Analysis
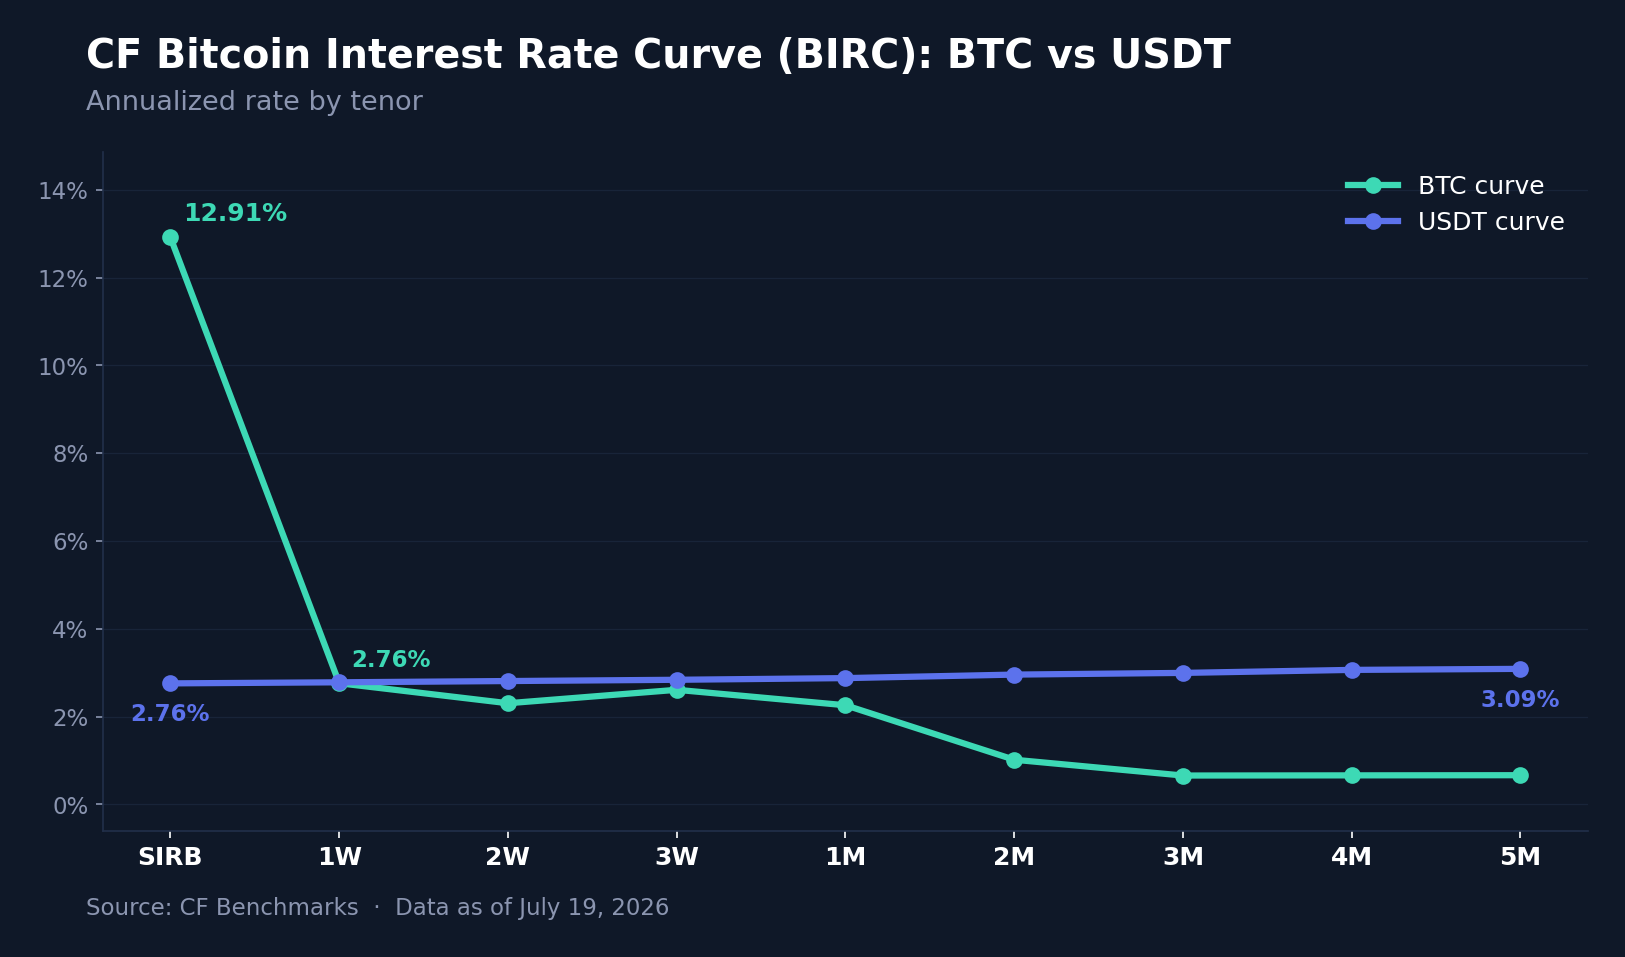
The Bitcoin Session Interest Rate (SIRB) fell from 15.3803% to 12.9127%, a -246.8 bps move, while the USDT curve shifted down in parallel, -63.5 to -68.2 bps at every tenor, to 2.7576% at SIRB and 3.0883% at 5M. The two moves had distinct causes. The SIRB decline reversed most of the prior week’s +280.5 bps jump, a front-end positioning spike normalizing rather than term funding repricing. The USDT shift tracked the macro: a stablecoin curve that moves as one is following its benchmark, and the post-CPI drop in July hike odds is the natural candidate. The BTC term curve went the other way, firming at every tenor, 1W +52.2 bps to 2.7611%, 2W +60.2 bps to 2.3054%, 3W +105.7 bps to 2.6111%, 1M +73.0 bps to 2.2597% and 3M +57.0 bps to 0.6588%, consistent with demand to hold BTC exposure through the recovery bidding up term borrow even as dollar-proxy rates fell. Across both curves, tenor changes ranged from -246.8 bps to +105.7 bps, and the BTC curve remains steeply inverted, a 12.91% session rate against 0.67% at five months; USDT sits above BTC from 1W (+2.1 bps) out to 5M (+242.2 bps). The USDT curve goes into the FOMC having just demonstrated that it prices the Fed, which makes it the series to follow through the decision; the SIRB, after a 527 bps round trip in two weeks, remains the noisiest gauge in the set.
Closing Synthesis
The week reduces to one chain of cause and effect: cooler inflation prints took the July hike trade off the table, the removal of that scenario repriced everything with duration in it, and the bid ran from the ETF-wrapped majors down through the mid-caps, through the Growth factor, and into the USDT funding curve. Geopolitics interrupted the move but did not reverse it. What refused to trade the macro was name-specific: an exploit overhang at the bottom of Culture, a tokenization partnership near the top of Finance. The coming week inverts the setup, with the July FOMC meeting the scheduled event, further Iran headlines the unscheduled one, and hike odds showing the benign outcome already largely priced. Direction came from rates; dispersion came from names.
The information contained within is for educational and informational purposes ONLY. It is not intended nor should it be considered an invitation or inducement to buy or sell any of the underlying instruments cited including but not limited to cryptoassets, financial instruments or any instruments that reference any index provided by CF Benchmarks Ltd. This communication is not intended to persuade or incite you to buy or sell security or securities noted within. Any commentary provided is the opinion of the author and should not be considered a personalised recommendation. Please contact your financial adviser or professional before making an investment decision.
Note: Some of the underlying instruments cited within this material may be restricted to certain customer categories in certain jurisdictions.
Factor Friday - October 9, 2026
Size led CF Benchmarks' factor table for a second week at 2.58% as the Market fell 4.98%. Size held after QNT's reversal, though its cohort spread narrows sharply without three outlier tokens, and Downside Beta and Liquidity gave back part of last week's gains.

Mark Pilipczuk
Small Cap Tokens Outperform in September
The CF Free-Float Broad Cap Index rose 10.28% in September as Bitcoin supplied 59% of the gain while trailing the index. Returns across the Capitalization Series ran from +7.74% for Ultra Cap 5 to +14.01% for Emerging Crypto, which holds no Bitcoin, as altcoins outpaced Bitcoin.
Mark Pilipczuk
CF Digital Asset Index Family Multi Asset Series – Extraordinary Rebalance Announcement
CF Digital Asset Index Family Multi Asset Series - Extraordinary Rebalance Announcement
CF Benchmarks
By clicking Accept, you consent to CF Benchmarks's use of cookies.
Visit Cookie Settings to learn how CF Benchmarks uses cookies and to adjust your preferences.