
Jan 13, 2026
Size and Growth Lag in Market-Wide Selloff
Key takeaways:
Risk off Rotation Was a Key Theme in Q4
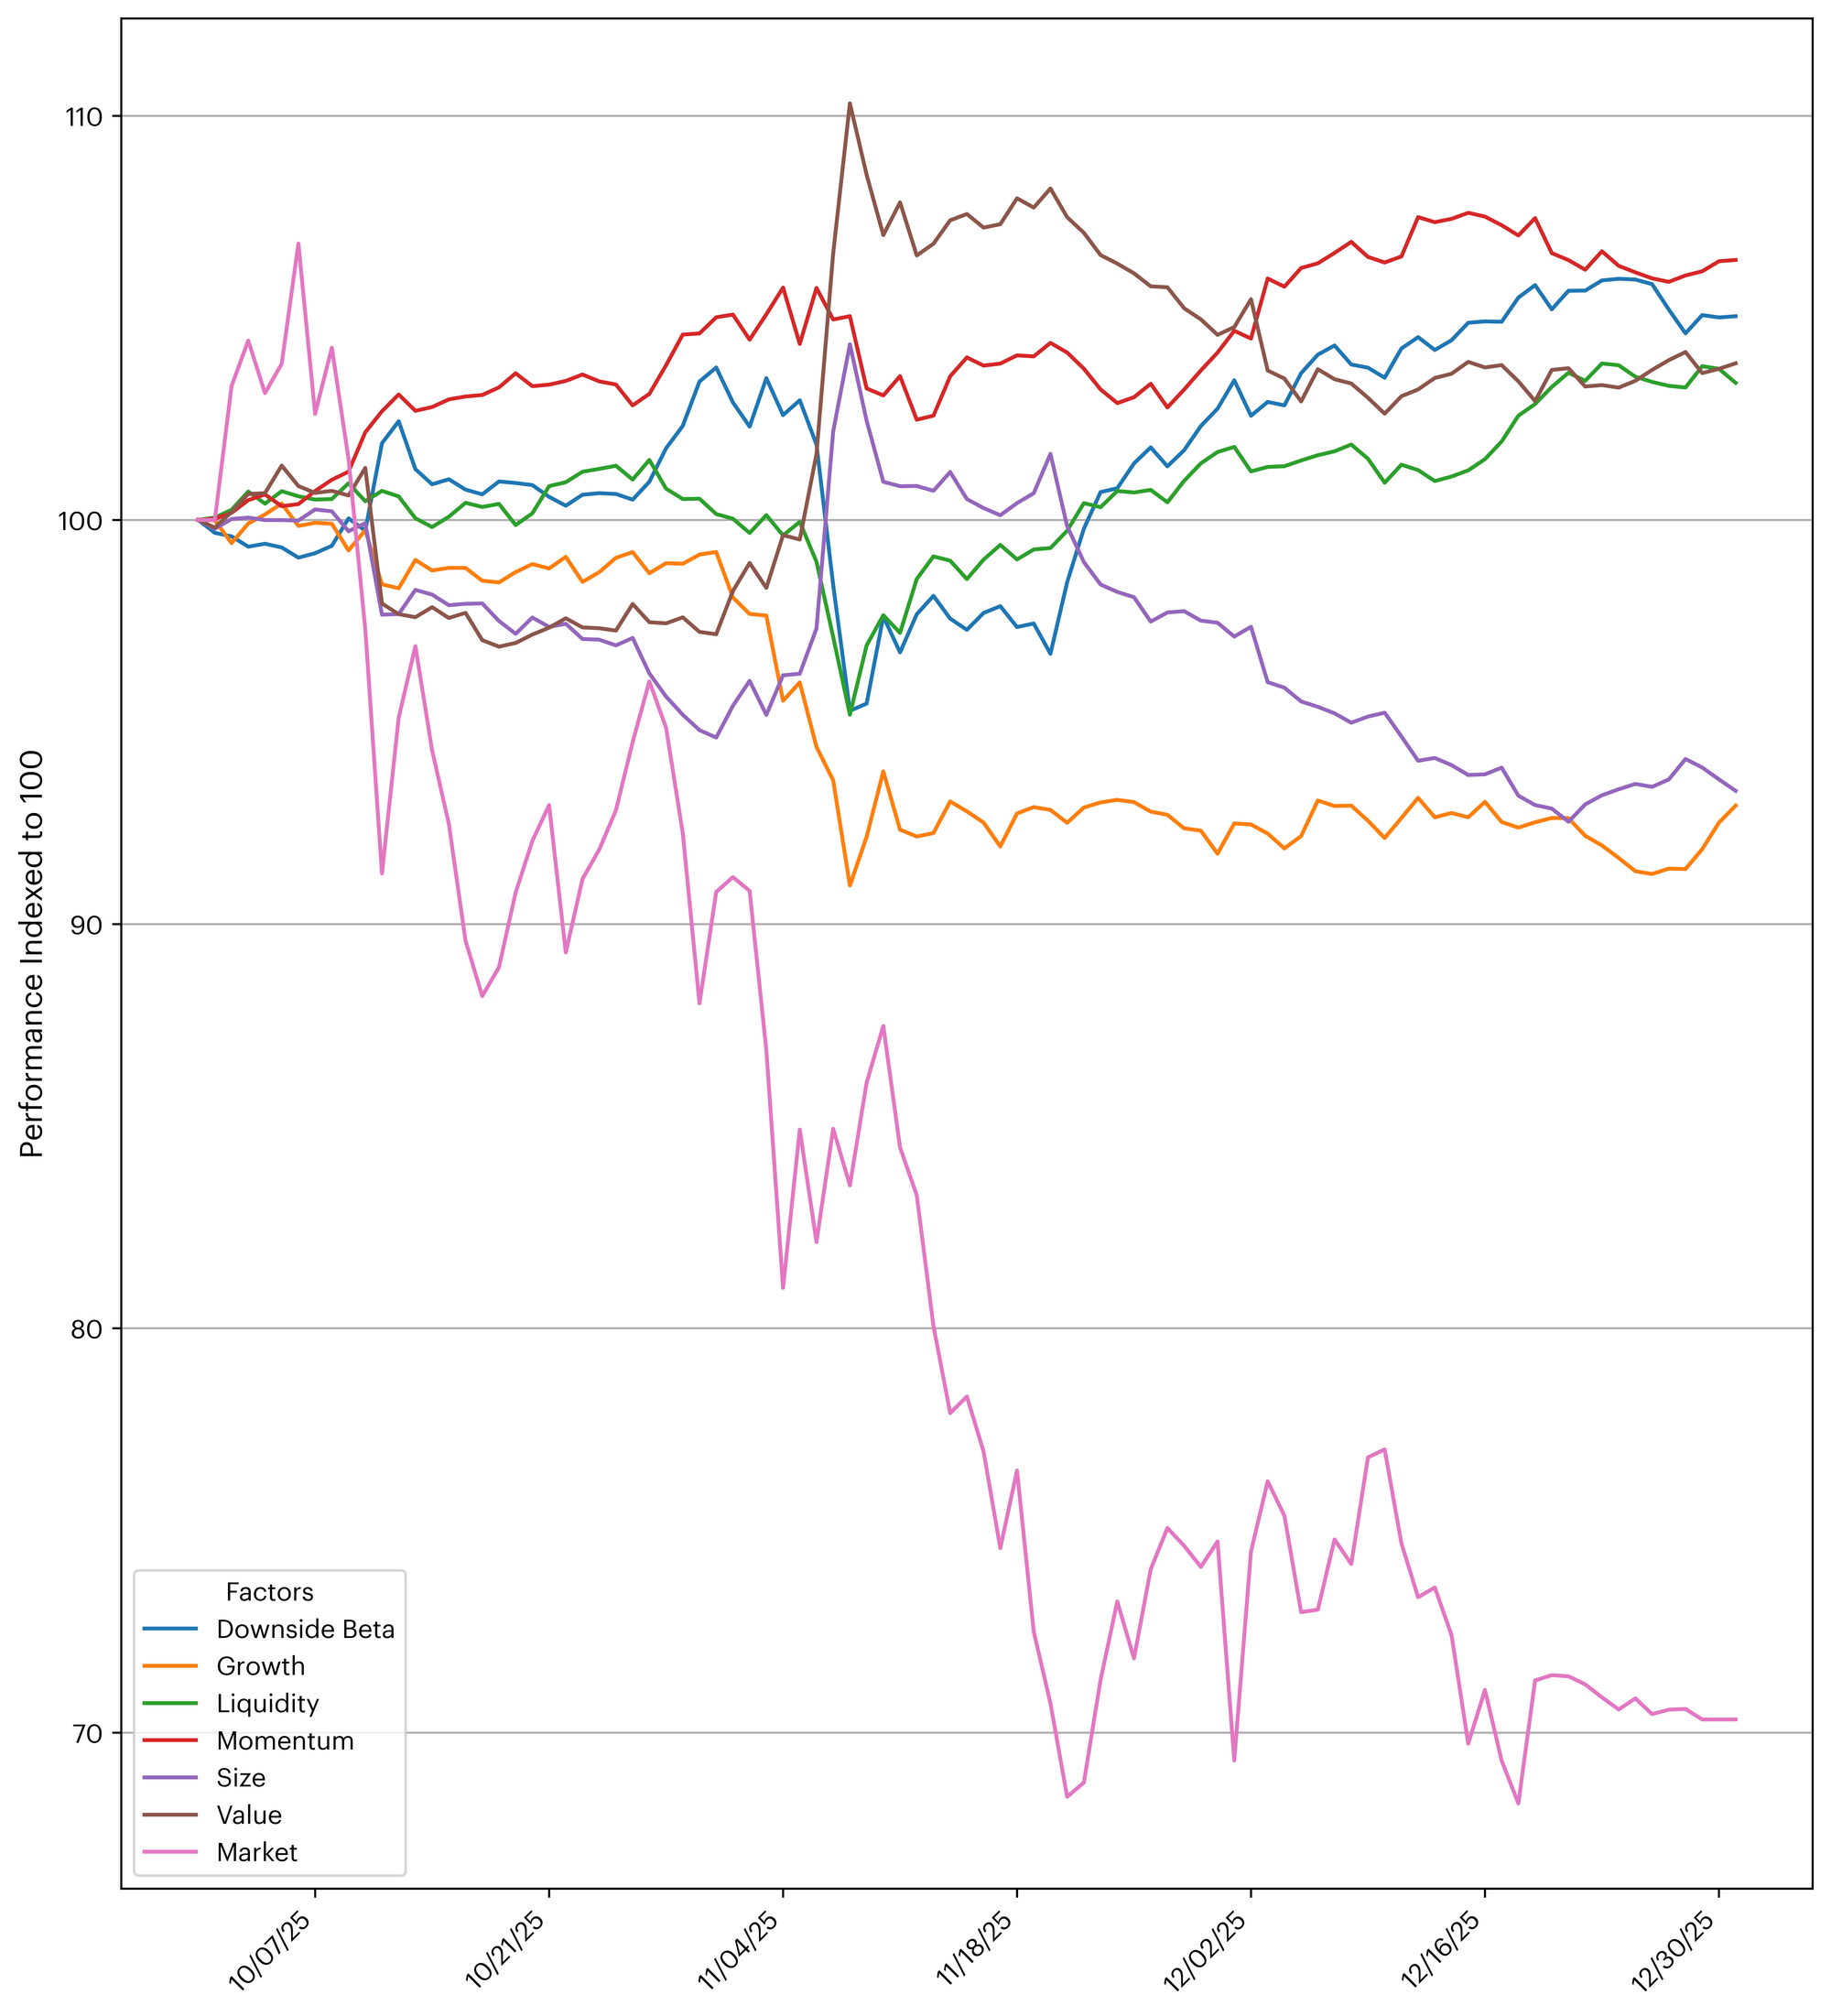
Q4 2025 marked a sharp reversal and a more defensive factor backdrop. The CF Broad Cap Index fell 29.0% during the quarter, erasing the year's gains and widening dispersion across factors. Momentum led with a 6.4% gain, showing that recent price persistence held up as the market sold off. Downside Beta advanced 5.0%, indicating that lower downside sensitivity was rewarded. Liquidity rose 3.4%, with less liquid tokens outperforming more liquid peers. Value increased 3.9%, reflecting relative strength in assets with stronger fee generation relative to total value locked and higher user engagement. In contrast, Growth declined 7.1% and Size fell 6.7%, signaling weakness in higher-growth and smaller-cap tokens. Overall, investors appeared materially more risk-averse, favoring momentum and defensive exposures over growth and size.
Momentum, Downside Beta, and Value Drive Short-Side Gains in Q4
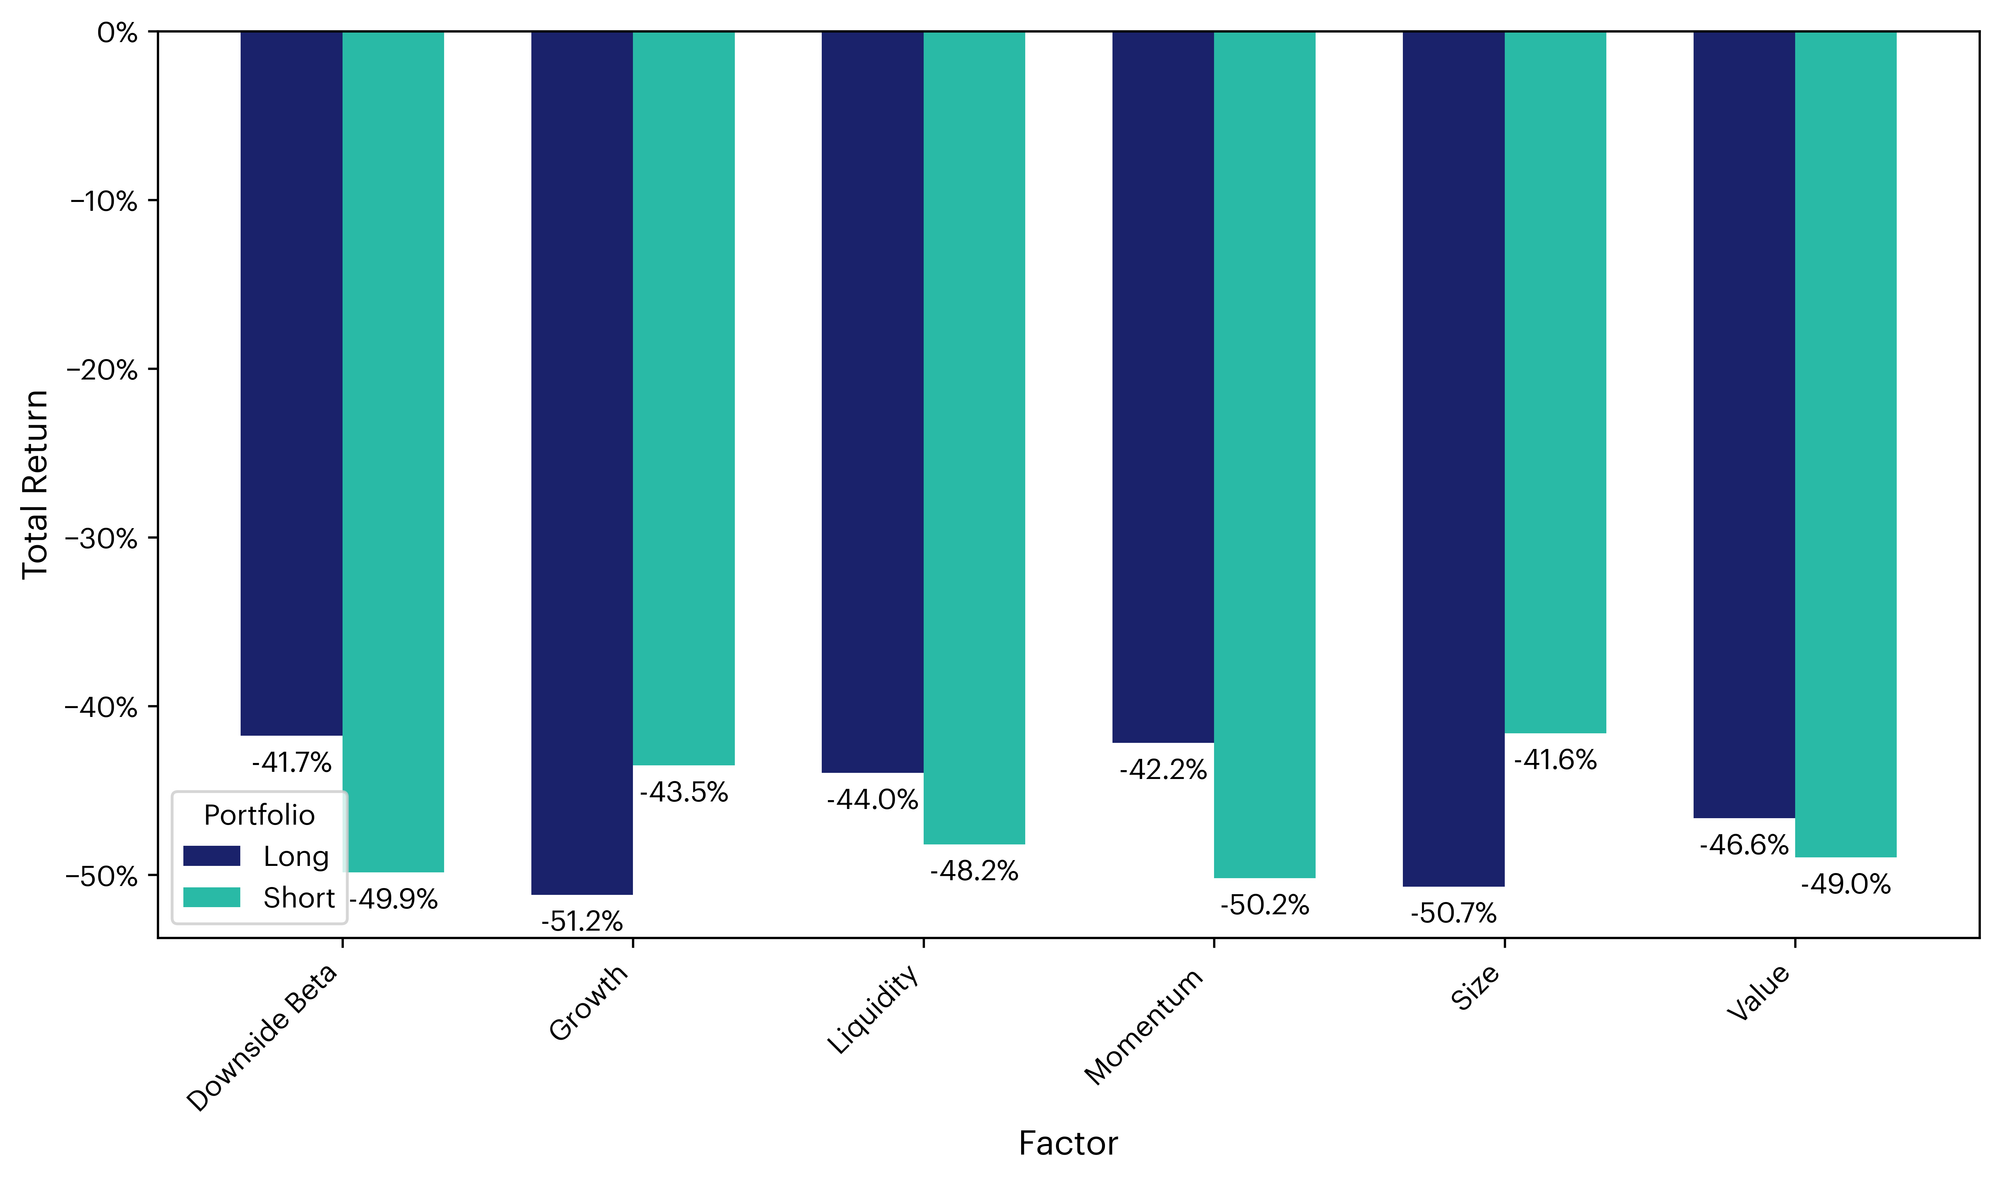
In the fourth quarter of 2025, Downside Beta stood out as the most resilient factor on the long side, followed by Momentum and Liquidity. On the short side, Size and Growth delivered the strongest results, with Liquidity ranking third. The Q4 factor profile points to a decisively risk-off environment: investors were rewarded for defensive positioning and trend persistence, while exposures to smaller-cap and higher-growth tokens detracted as drawdowns concentrated in the market's higher-beta segments.
The CF Settlement Category Index Has a Slight Growth Tilt
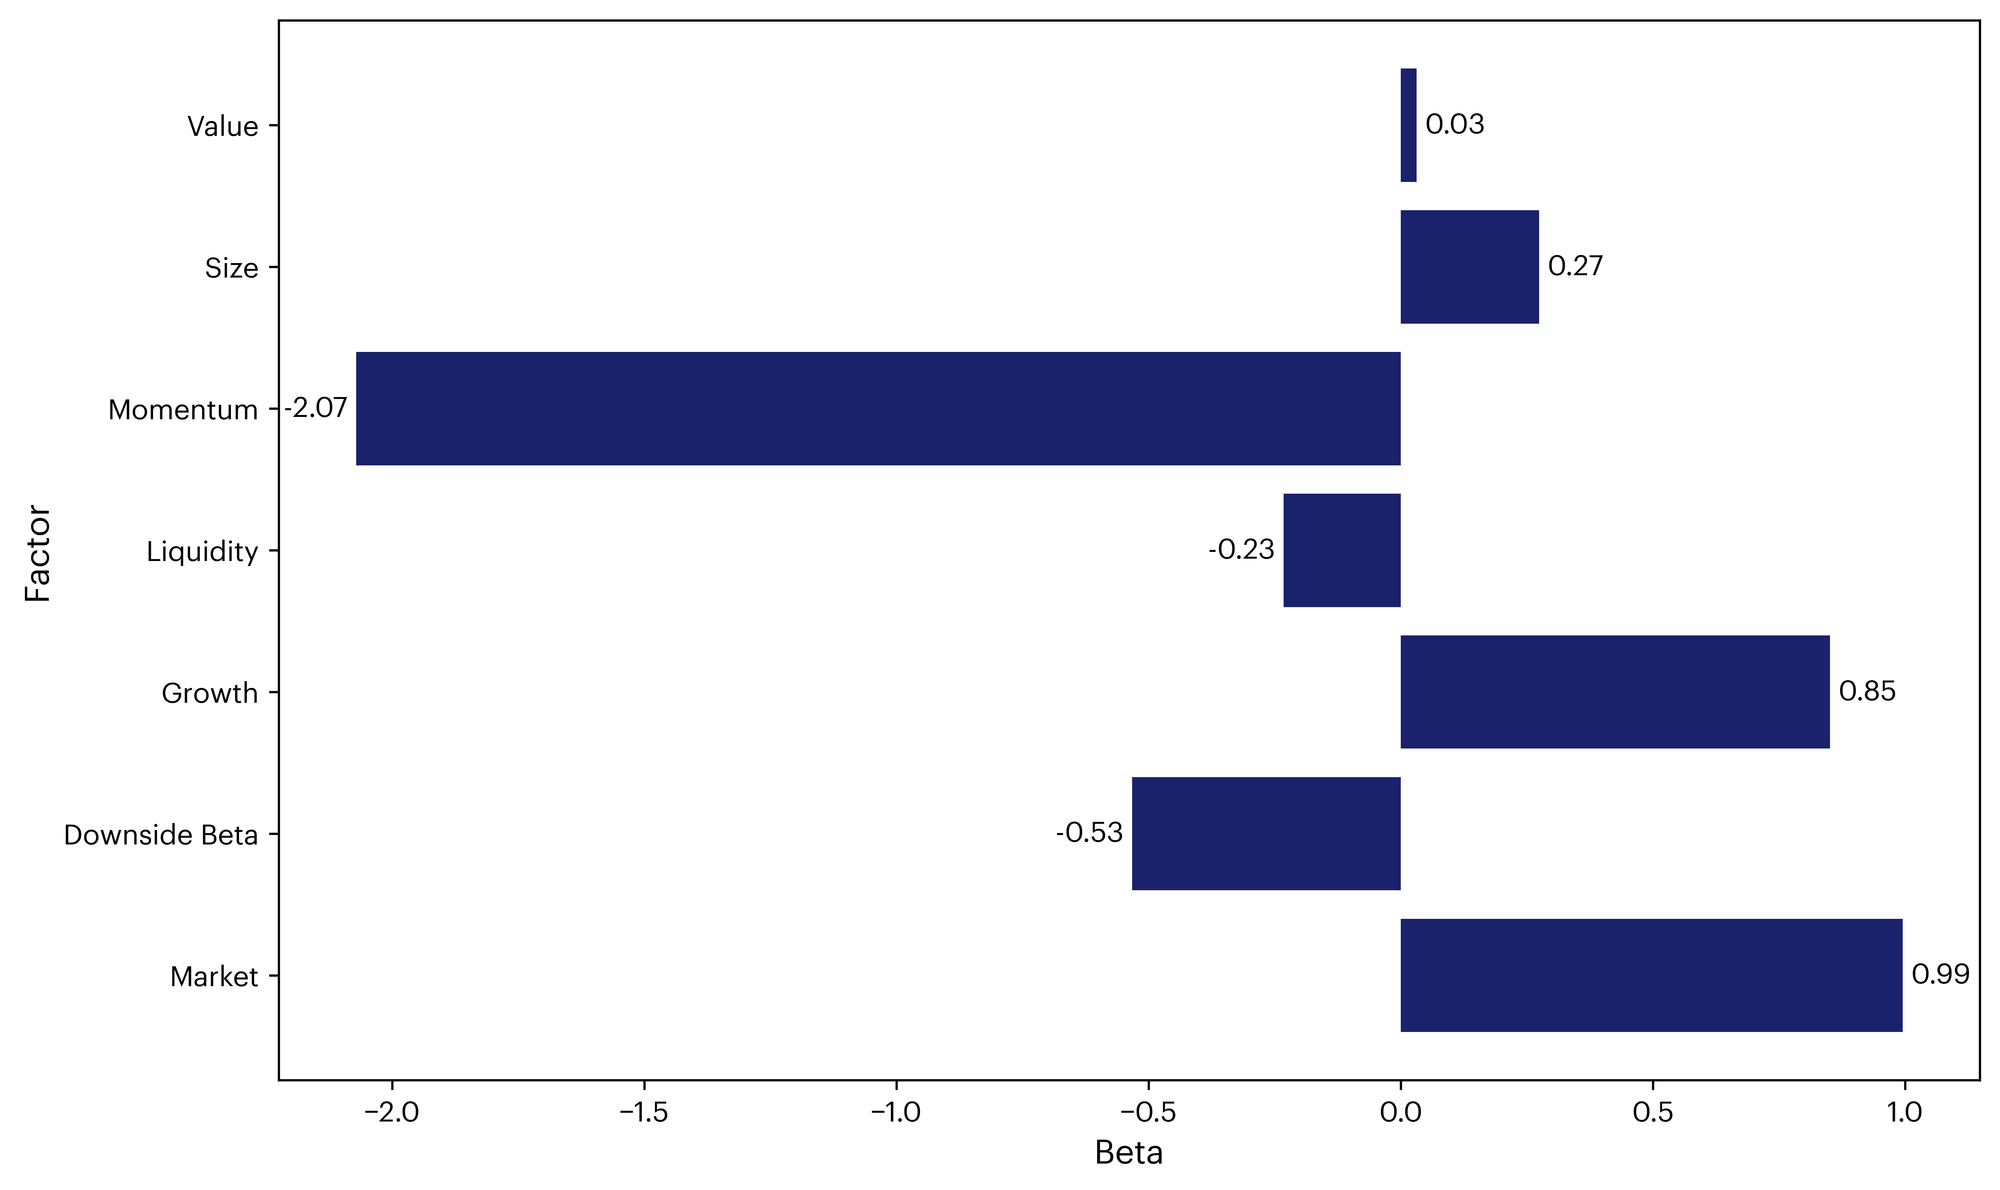
The CF Settlement Category Index's factor beta profile shows meaningful tilts beyond pure market exposure. Market beta is essentially one-to-one (+0.99), but the index exhibits strong negative sensitivity to Momentum (–2.07) and a moderately negative tilt to Downside Beta (–0.53), indicating it tends to move against trend-following exposure and displays more risk-on characteristics. Liquidity is slightly negative (–0.23), consistent with a modest bias toward more liquid tokens. Conversely, Growth shows a sizeable positive tilt (+0.85), while Size is modestly positive (+0.27), reflecting exposure to higher-growth and smaller-cap assets. Value is near neutral (+0.03), suggesting limited linkage to network activity metrics. Overall, the Settlement Category Index remains market-like in its core exposure, with a pronounced anti-momentum profile and a meaningful growth overlay.
The CF Services Category Index Has a Liquid, Small-Cap Tilt
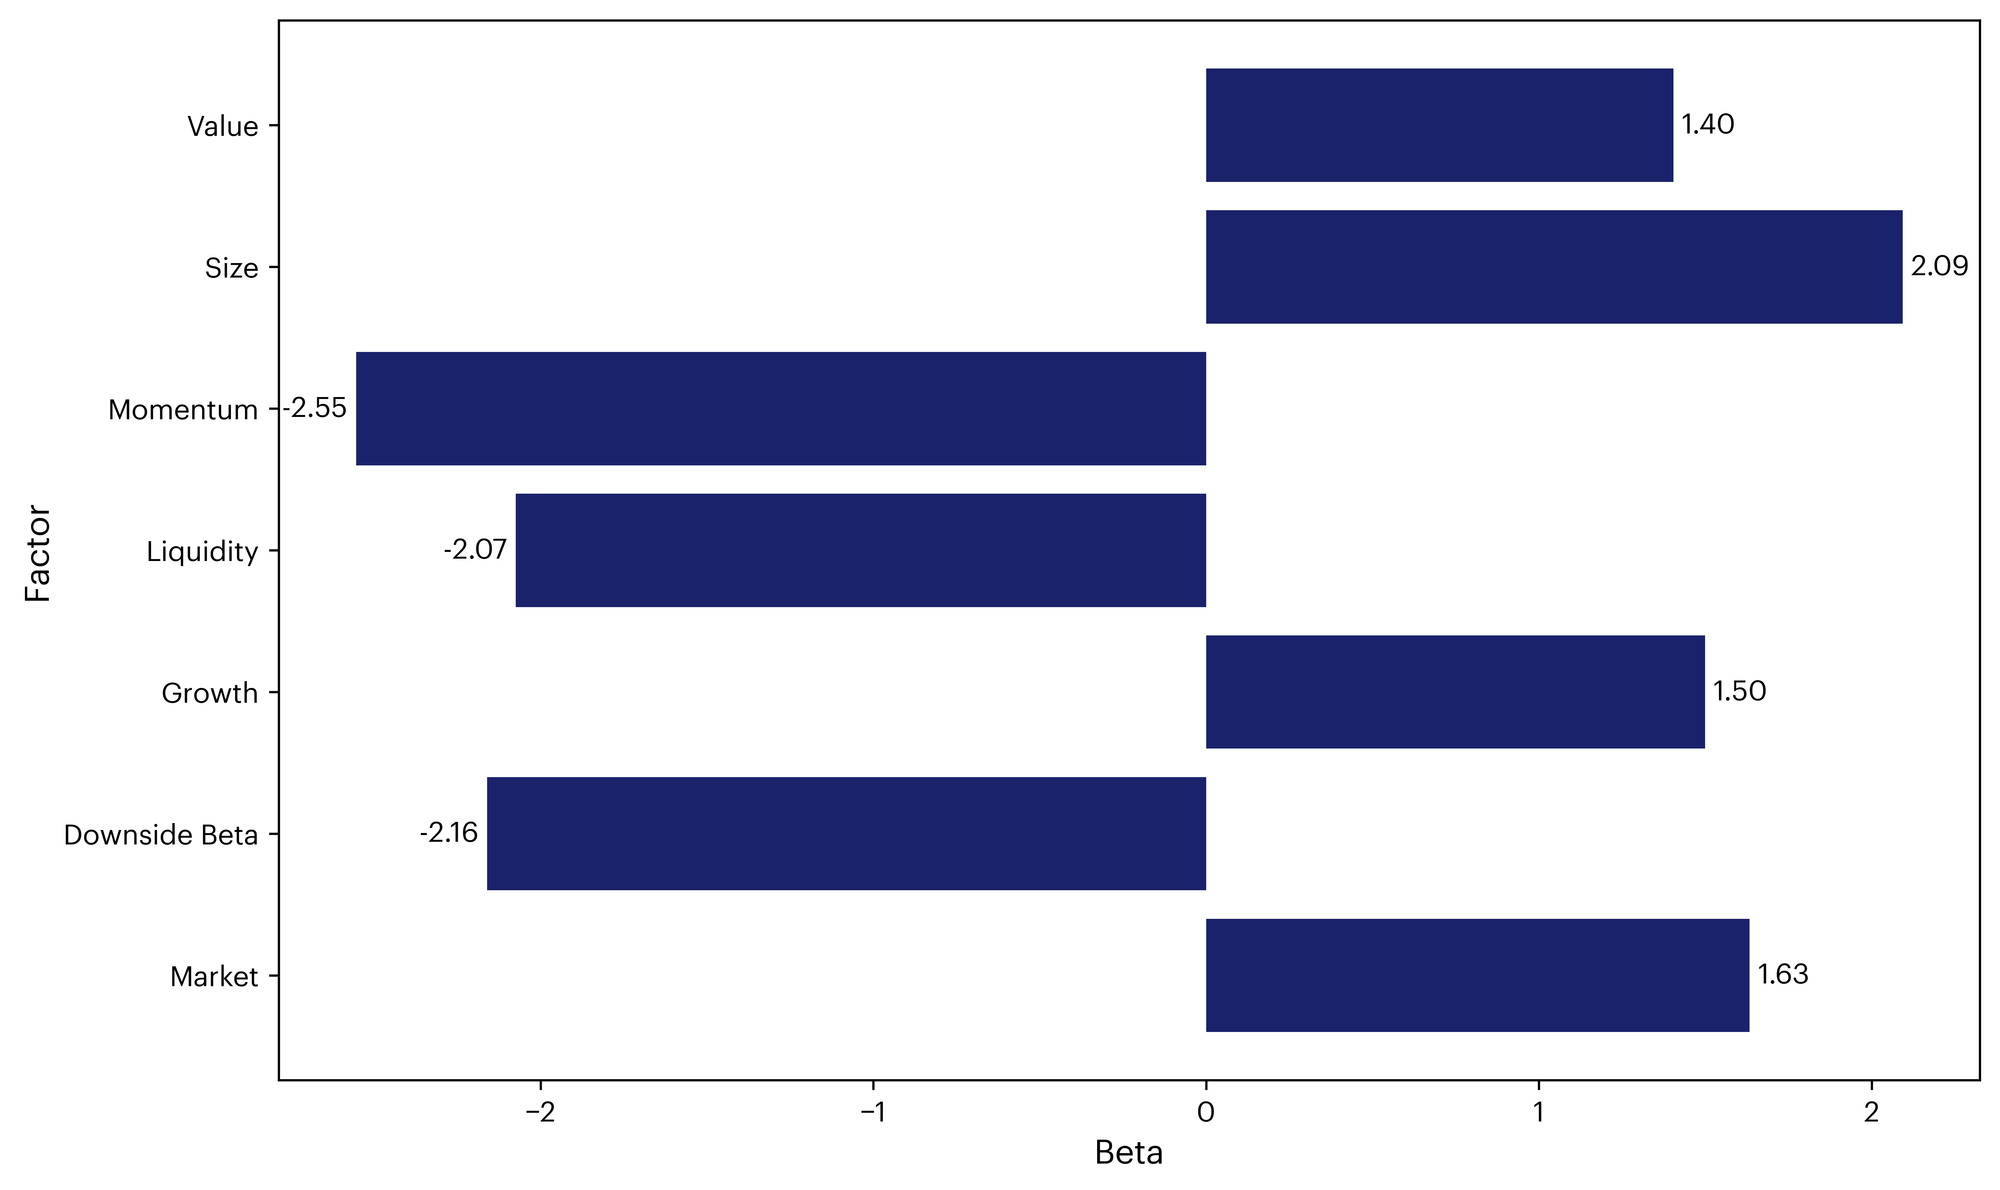
The CF Services Category Index exhibits a nuanced factor beta footprint. The profile is dominated by very negative Momentum (–2.55), alongside negative Downside Beta (–2.16) and Liquidity (–2.07), indicating a tilt away from trend exposure, with a preference for more liquid names and a risk-on orientation. Offsetting this, the index shows a strong positive Size beta (+2.09) and a meaningful Value tilt (+1.40), suggesting performance has been driven by smaller-cap tokens and those with more efficient on-chain metrics. Growth is also materially positive (+1.50), while Market beta is elevated (+1.63), implying higher sensitivity to broad market moves. Overall, the Services Category Index is characterized by liquid, smaller-cap exposures with clear value and growth tilts, a combination that can enhance upside in constructive markets but raises vulnerability during risk-off periods.
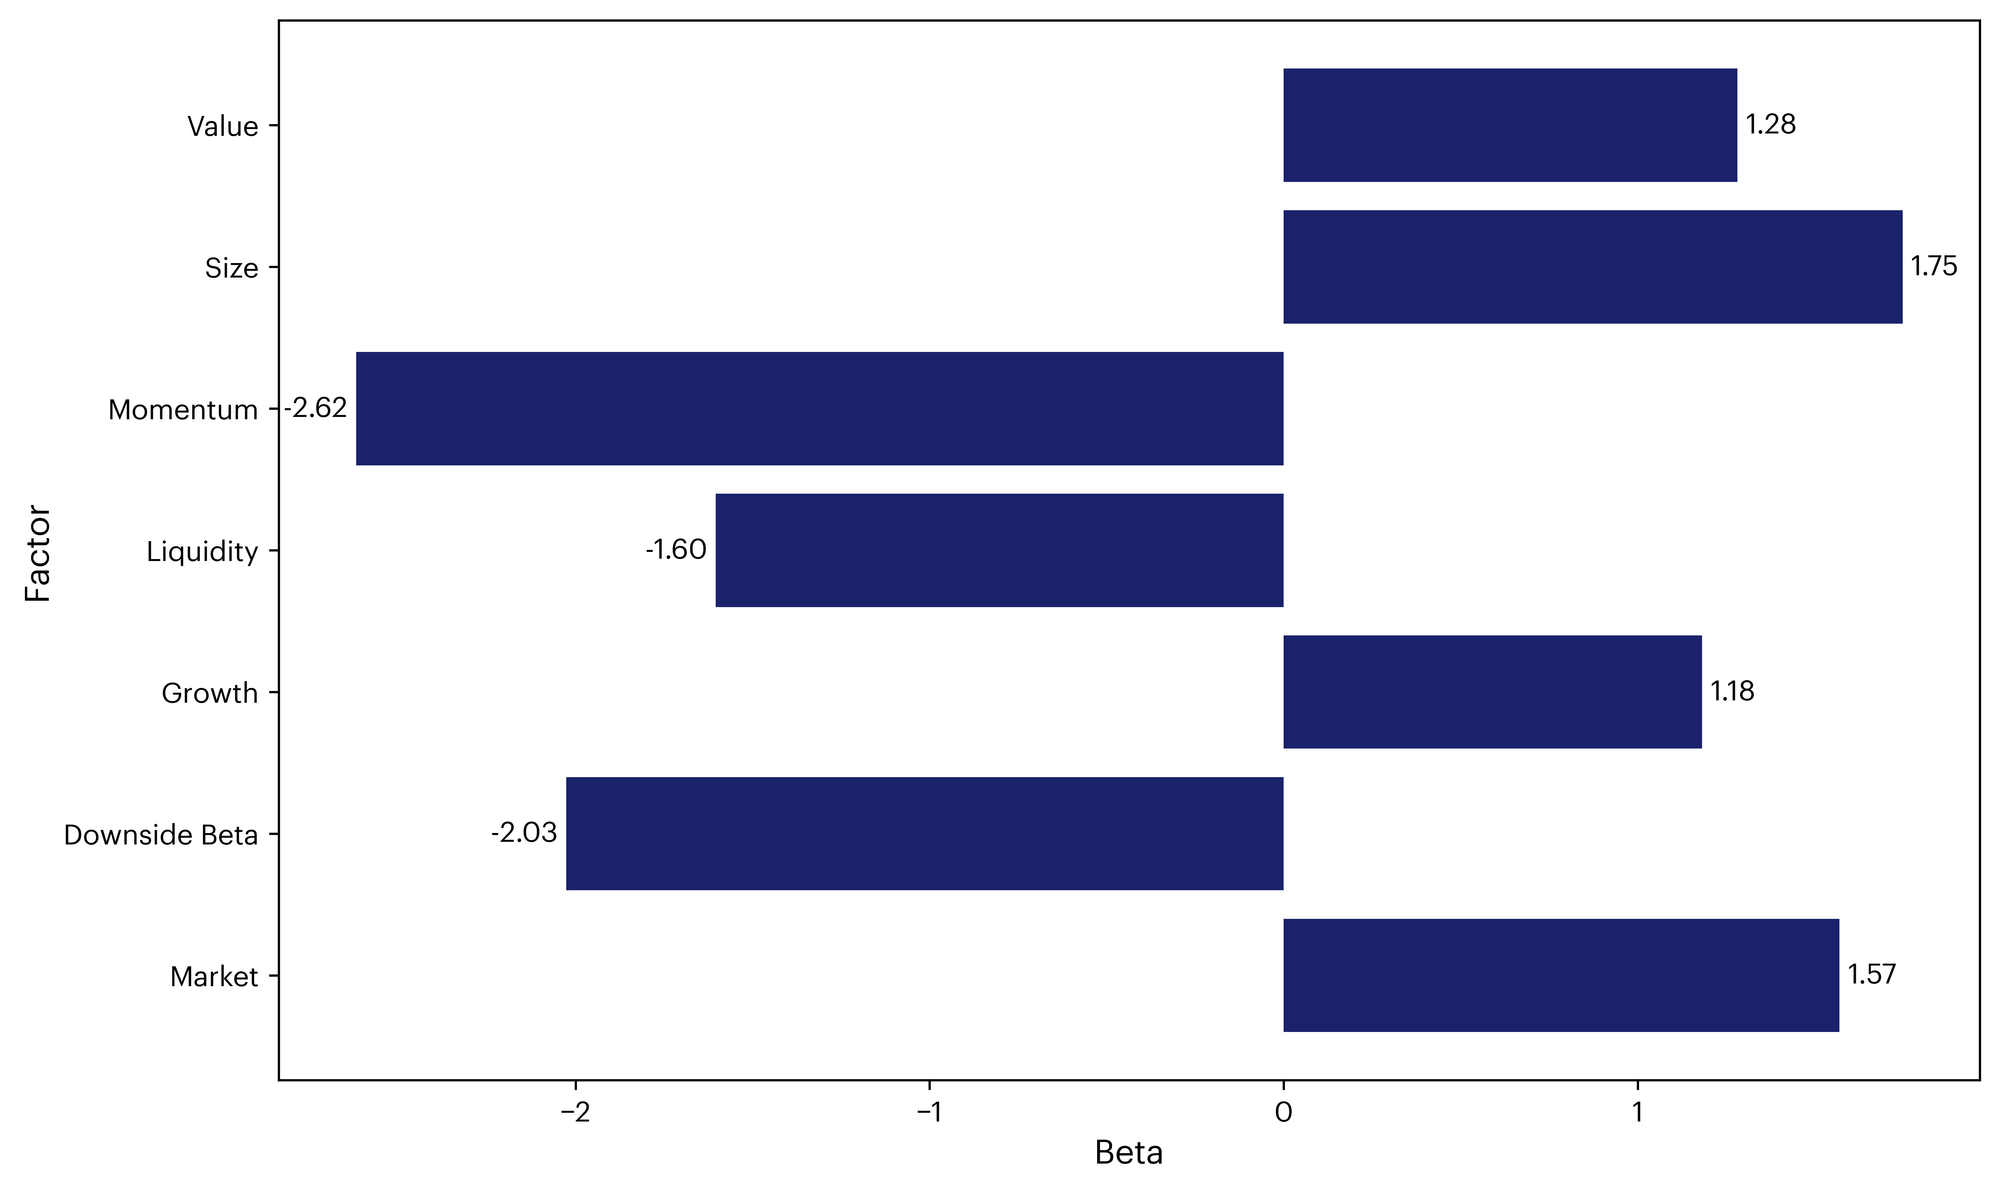
CF Sector Index Exhibits Similar Factor Tilts to the Services Index
The CF Sectors Category Index displays a factor beta profile similar to the CF Services Category Index. The footprint is dominated by very negative Momentum (–2.62) and negative Downside Beta (–2.03), alongside a negative Liquidity beta (–1.60), indicating a tilt away from trend exposure, elevated vulnerability in risk-off episodes, and a preference for more liquid names. Offsetting this, the index shows a strong positive Size beta (+1.75) and a meaningful Value tilt (+1.28), suggesting exposure to smaller-cap tokens with more efficient network fundamentals. Growth is also positively tilted (+1.18), reflecting meaningful exposure to tokens with higher network activity growth. Overall, the Sectors Category Index leans toward liquid, smaller-cap value and growth exposures with pronounced anti-momentum and downside sensitivity, a combination that can amplify upside participation in favorable markets but increases vulnerability during periods of risk aversion.
To read the complete report, kindly click on the provided link (or click here to view a PDF version). Additionally, please do not forget to subscribe to our latest news and research for the most relevant institutional insights on digital assets and the top digital assets by market cap.
The information contained within is for educational and informational purposes ONLY. It is not intended nor should it be considered an invitation or inducement to buy or sell any of the underlying instruments cited including but not limited to cryptoassets, financial instruments or any instruments that reference any index provided by CF Benchmarks Ltd. This communication is not intended to persuade or incite you to buy or sell security or securities noted within. Any commentary provided is the opinion of the author and should not be considered a personalised recommendation. Please contact your financial adviser or professional before making an investment decision.
Note: Some of the underlying instruments cited within this material may be restricted to certain customer categories in certain jurisdictions.
Changes to the Token Market Price Benchmarks Series - Market Prices – 14 July 2026
Changes to the Token Market Price Benchmarks Series - Market Prices – 14 July 2026

CF Benchmarks
Bitcoin ETF Outflow Streak Ends as BVX Falls to a 12-Month Low
Digital assets traded mixed over the week: ETF inflows returned and the mega caps carried our headline indices, while high-beta names and diversified breadth lagged. DeFi led the themes, meme coins absorbed a governance attack, implied volatility kept compressing.
Gabriel Selby
Factor Friday - July 10, 2026
The relief rally extended for a second week with Market +2.27%, but the real story is risk appetite: Liquidity led styles at +1.51% as thinner, less liquid names caught a bid. Value paused at -0.79% yet still leads over four weeks. Defensive tilts kept unwinding into the bounce.
Mark Pilipczuk
By clicking Accept, you consent to CF Benchmarks's use of cookies.
Visit Cookie Settings to learn how CF Benchmarks uses cookies and to adjust your preferences.