
Mar 16, 2026
Weekly Index Highlights, March 16, 2026
Market Performance Update
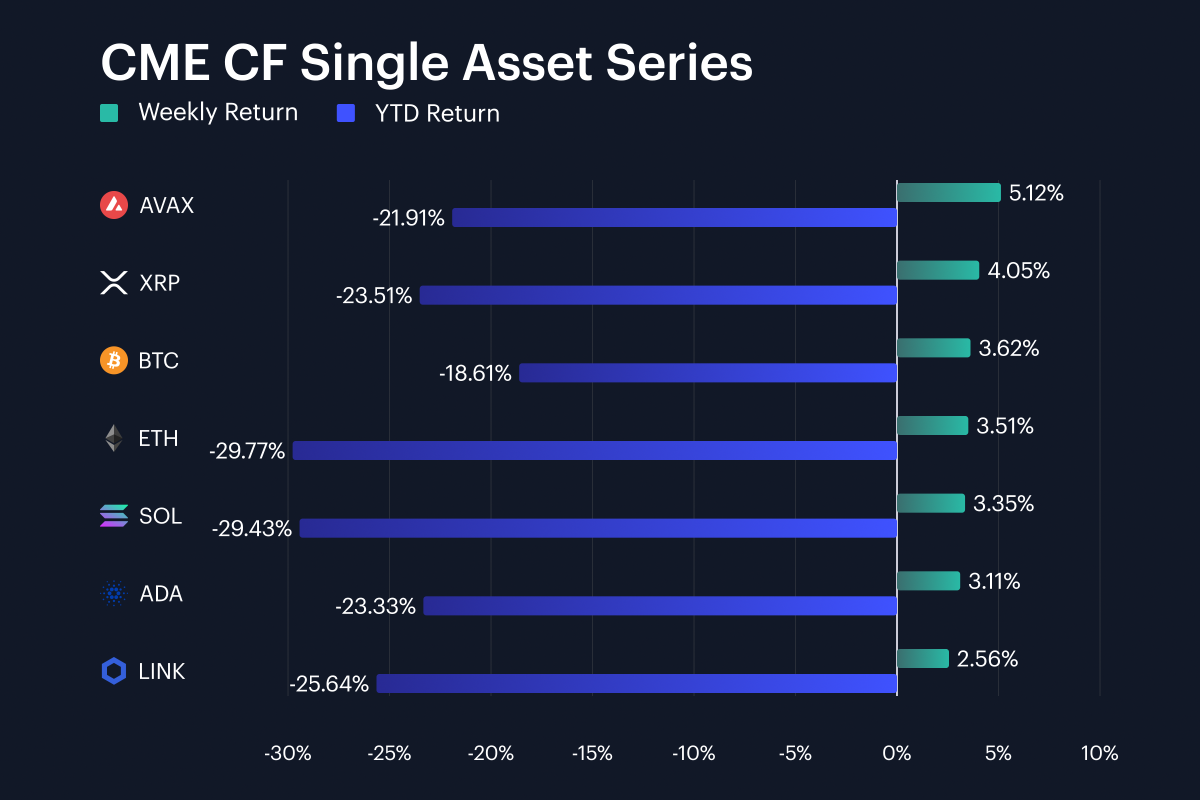
Digital assets rebounded week-on-week (w/w), but any revival has a long way to go before it repairs already significant year-to-date losses halfway through just the third month of the year. Bitcoin gained 3.62% w/w and Ether rose 3.51%, while Avalanche led the single-asset set at +5.12% and Chainlink trailed at +2.56%. XRP, Solana and Cardano added 4.05%, 3.35% and 3.11%. That left the basket in a relatively tight 2.57 percentage point (pp) weekly band, even though year-to-date returns still run from Bitcoin’s -18.61% to Ether’s -29.77%. That said, the 1.50 w/w pp gap between Avalanche and Bitcoin and the 2.57-point gap between Avalanche and Chainlink do show that leadership tilted toward higher-beta names over the most recent week. And the same 2.57 pp band across the whole basket still reads more like a broad relief rally than a highly selective rotation. Every listed asset posted a positive weekly return, yet every listed asset also remains underwater for 2026. That combination, with weekly gains of 2.56% to 5.12% sitting beside year-to-date losses of -29.77% to -18.61%, suggests the market has regained a modicum of direction faster than it has regained balance-sheet confidence, for now.
Volatility Analysis
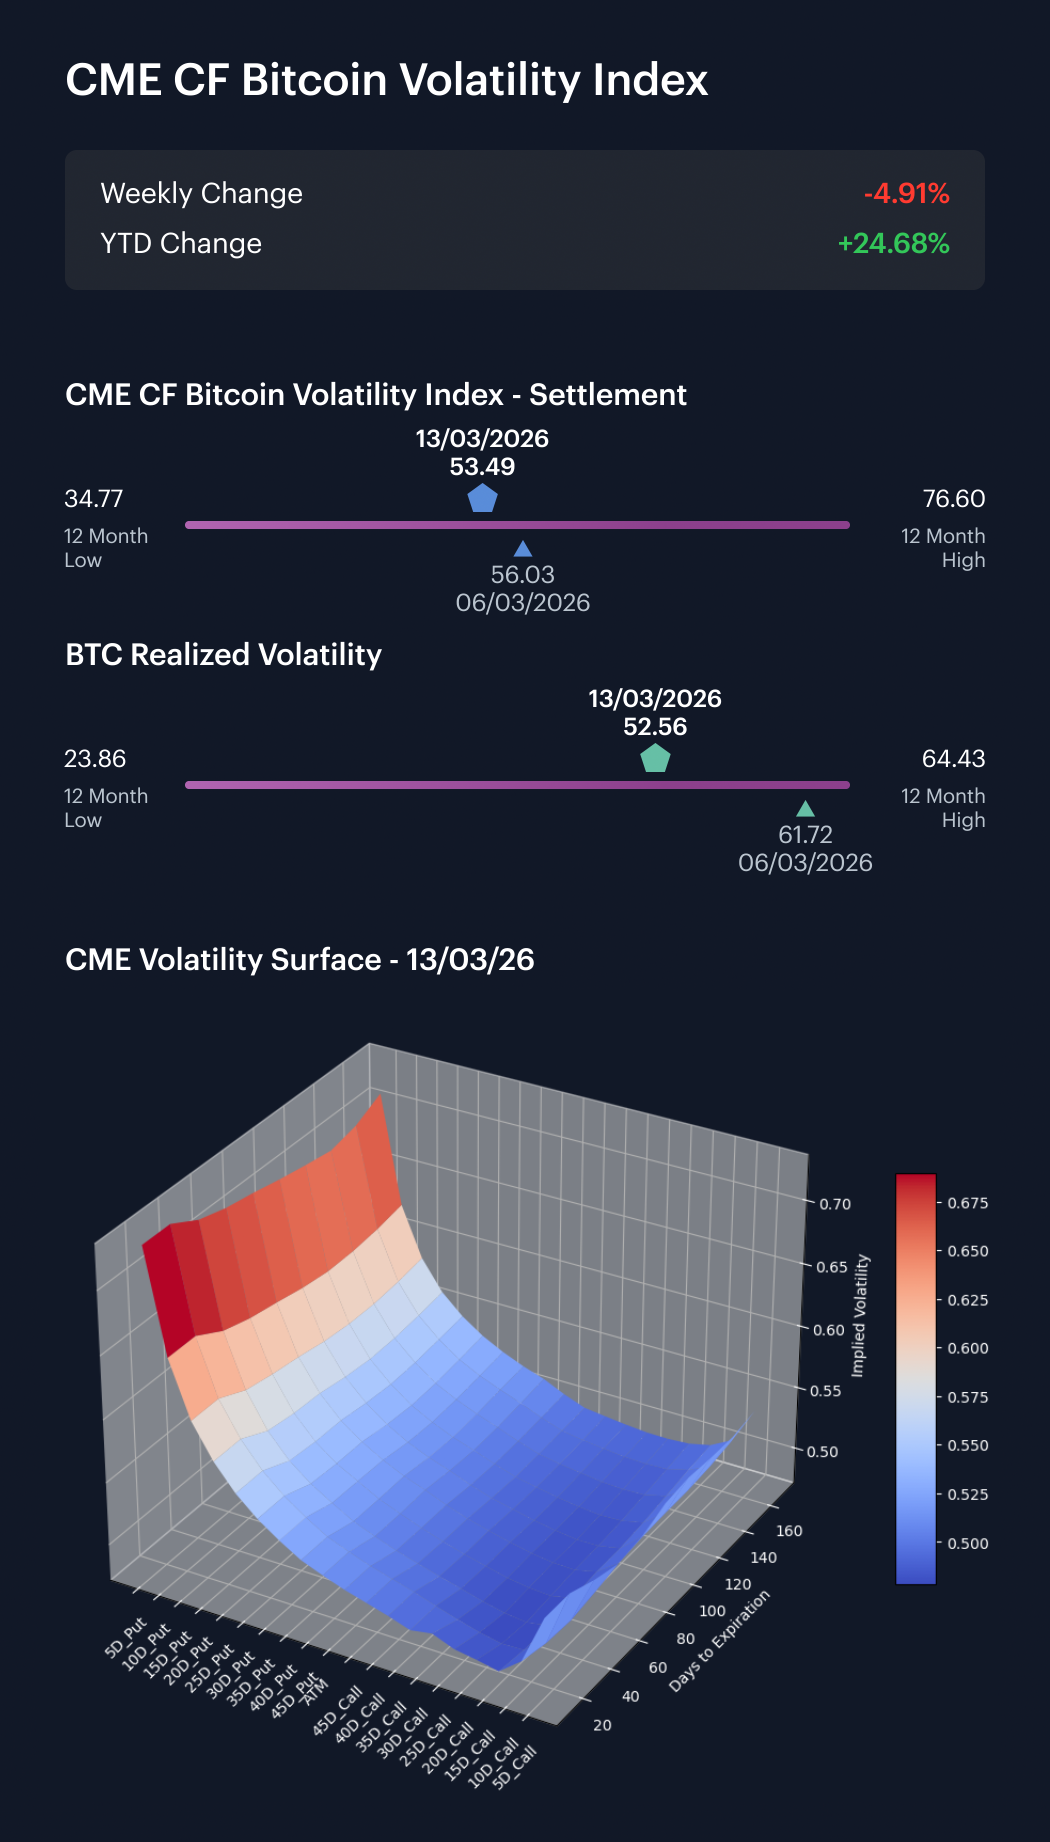
Bitcoin volatility cooled materially on both implied and realized measures over the latest business-week window. Our CME CF Bitcoin Volatility – Settlement (BVXS) gauge moved from 56.03 on Friday, March 6th, to 53.49 on Friday, March 13th, a 2.54-point decline. Realized volatility fell further, from 61.72 to 52.56, a 9.16-point drop. The implied-realized relationship therefore ‘changed signs’, because a week ago, realized exceeded implied by 5.69 vol. points, whereas by March 13th, implied sat 0.93 vol. points above realized. That 0.93-point premium is a calmer shape than the prior week’s 5.69-point realized overrun. The 6.62-point difference between the realized move and the BVXS move shows that delivered volatility cooled faster than options pricing. Realized volatility at 52.56 is still well above the 12-month low of 23.86, but it is also 11.87 points below the 12-month high of 64.43. The latest week therefore looks like a cooling in delivered volatility, with options still carrying a modest premium and no longer being forced higher by a fresh realized shock.
Market Cap Index Performance
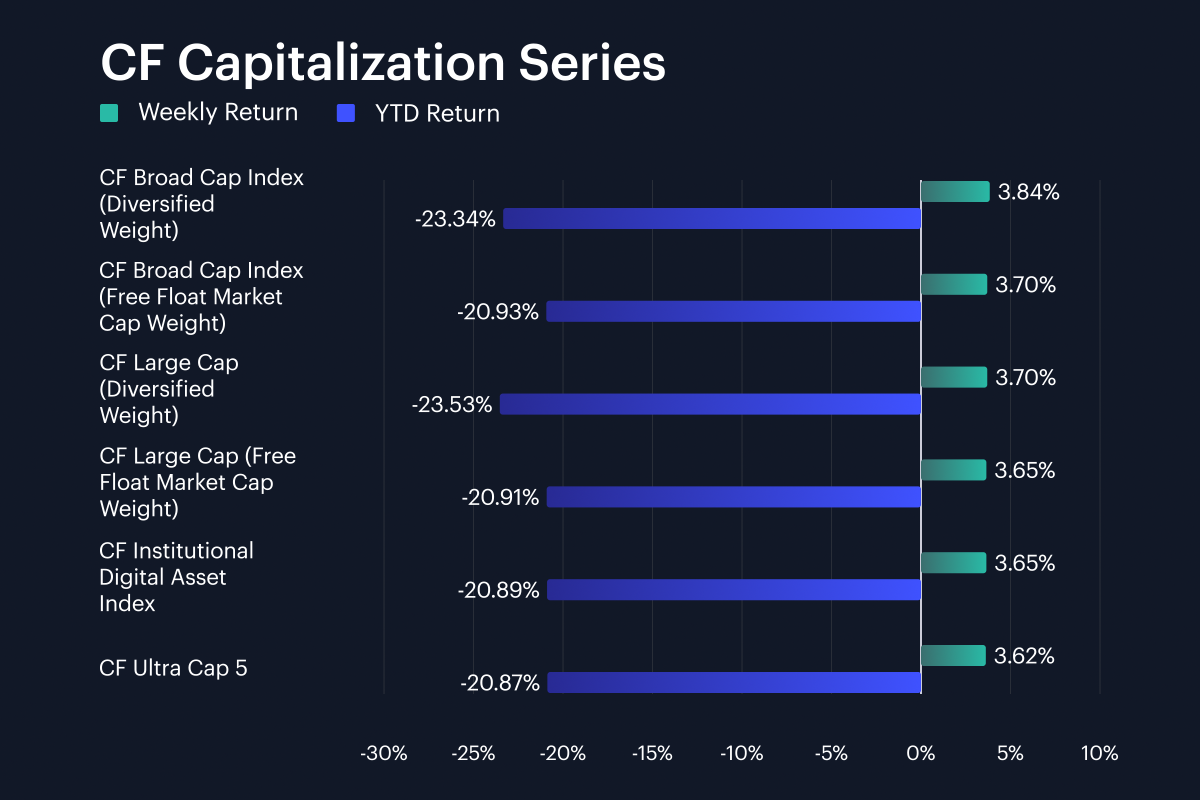
Market-cap indices recovered in near lockstep, which is one of the cleaner signals in the week’s market profile. CF Broad Cap Index (Diversified Weight) led at +3.84% w/w, CF Large Cap (Diversified Weight) returned +3.70%, and the free-float broad and large cap indices printed +3.70% and +3.65%. The CF Institutional Digital Asset Index posted +3.65%, while CF Ultra Cap 5 added 3.62%. The full spread from leader to laggard was only 0.22 pp. That 0.22 pp band is narrower than the 2.57 pp spread in the single-asset basket, which implies index construction muted some of the token-level dispersion. Breadth did improve at the margin, since the CF Broad Cap Index (Diversified Weight) beat the CF Ultra Cap 5 by 0.22 pp. The same diversified broad-cap print exceeded the institutional and large-cap free-float readings by less than 0.20 pp. That’s supportive for breadth, but still modest in size. All told, the rebound seen through the cap frame therefore looked broad-based first, and rotational second, all within a negative year-to-date range of -23.53% to -20.87%.
Factor Analysis
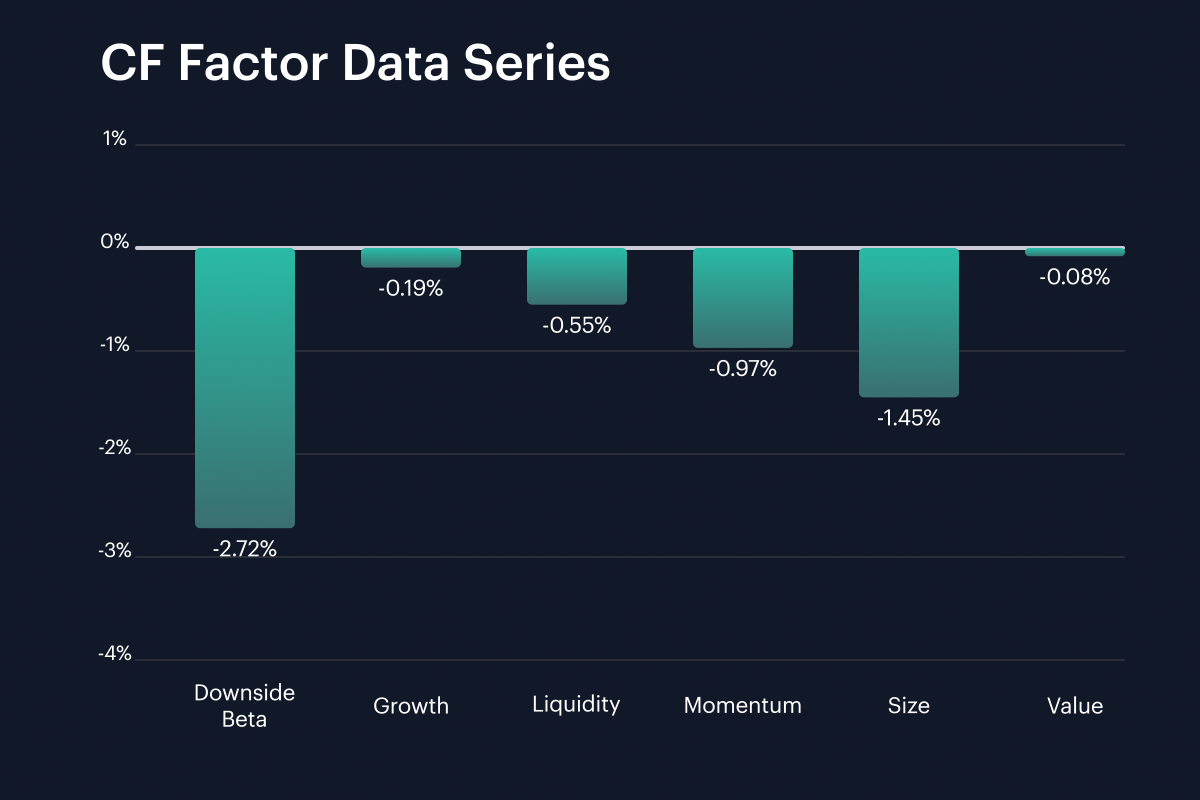
All factor returns deteriorated even as spot prices rebounded, making that split one of the most interesting crosscurrents in the pack. Downside Beta finished the week at -2.72%, versus 0.12% in the prior edition, a -2.84-pp swing. Growth moved from 0.79% to -0.19%, Liquidity from 0.09% to -0.55%, and Momentum from -0.23% to -0.97%. Size remained under pressure, as its decline widened from -0.72% to -1.45%, while Value slipped from 0.51% to -0.08%. That leaves the current factor set spanning -2.72% to -0.08%, with every reported factor negative on the week. The -1.37-pp gap between Size and Value and the -2.84 pp move in Downside Beta suggest that the rebound in spot still favored relatively robust exposures over the most fragile parts of the cross-section. The -0.74 pp move in Momentum, and the -0.98 pp move in Growth also show that the week’s recovery was weakly supported by style leadership. In percentage terms, the factors moved from a prior-week band of -0.72% to 0.79%, to a band of -2.72% to -0.08% in the most recent week, which is a clean way of showing how the whole cross-section shifted lower.
Classification Series Analysis
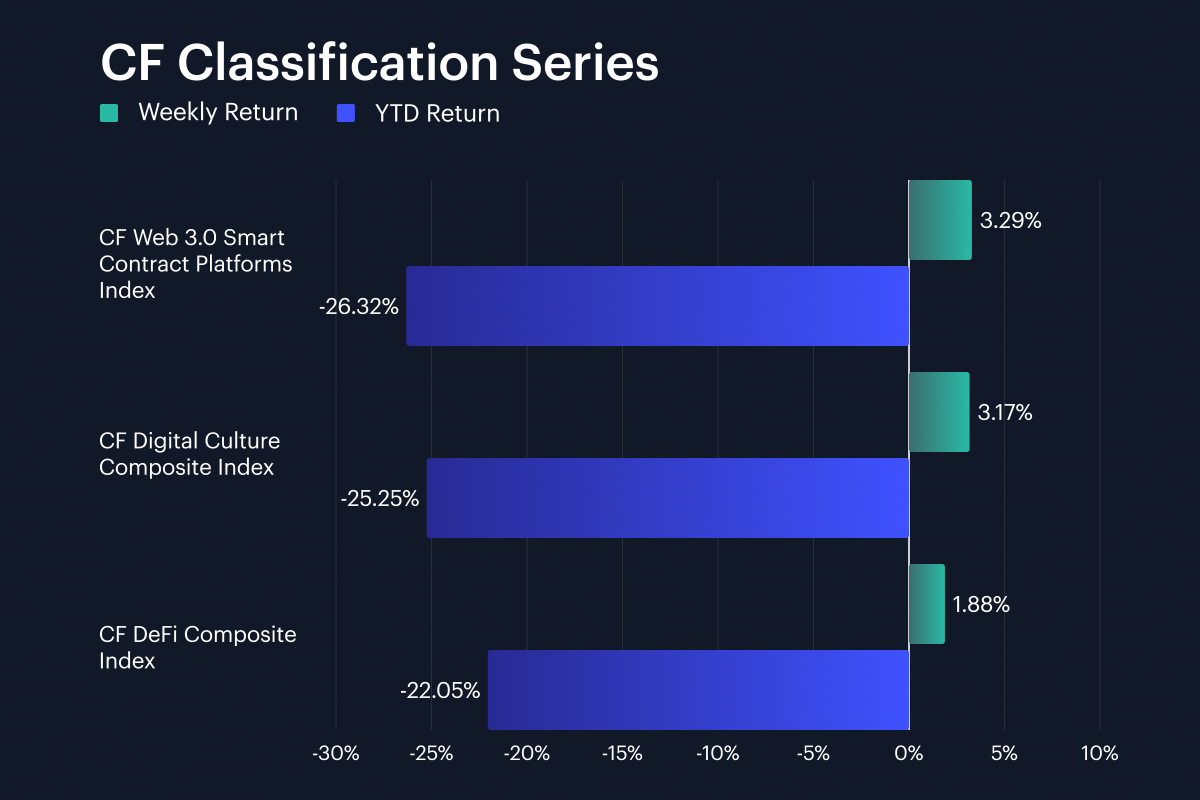
The classification series strengthened across all three composites, but the leadership order was still informative. The CF Web 3.0 Smart Contract Platforms Index gained 3.29% w/w, the CF Digital Culture Composite Index rose 3.17%, and the CF DeFi Composite Index added 1.88%. The spread between Web 3.0 and DeFi was 1.41 pp, while Culture sat only 0.12 pp behind Web 3.0. That 1.41 pp spread is modest in absolute terms, but it matters against a weekly range of 1.88% to 3.29% because it still leaves DeFi at the back of a recovering complex. Even after the bounce, year-to-date returns remain negative at -26.32% for Web 3.0, -25.25% for Culture and -22.05% for DeFi. The classification complex therefore rallied together, yet it did not rally on a single theme, and the 1.88% DeFi print still looked materially softer than the 3.29% Web 3.0 print.
Sector Analysis
Viewed across the tiers of our CF Digital Asset Classification Structure (CF DACS), the rebound was broad albeit uneven. The Infrastructure Sub-Category led CF DACS groups at +8.75% on average, driven by TAO at +41.51%, FET at +35.00% and RENDER at +32.10%. Utility followed at +4.67% on average, supported by BICO at +20.14% and GRT at +5.51%. Non-Programmable averaged +4.80%, Programmable averaged +3.64%, and Finance averaged +2.82%, with COMP leading at +10.57%, and JTO at +7.10%. Culture was the key relative laggard at +1.90%, with WIF at -5.52% and PRIME at -3.36%, offsetting IMX at +9.30% and SHIB at +7.40%. The 6.86 pp gap between Infrastructure and Culture seems wide enough to indicate a sharper preference for computing and tooling exposures than for entertainment and meme-linked segments. Finance at +2.82% and Programmable at +3.64% also show that the rally was not confined to one branch of the taxonomy. Across Sub-Category constituents, weekly moves ranged from -5.58% to +41.51%, which keeps the sector tape firmly dispersion-led, as well as direction-led.
CF Staking Series
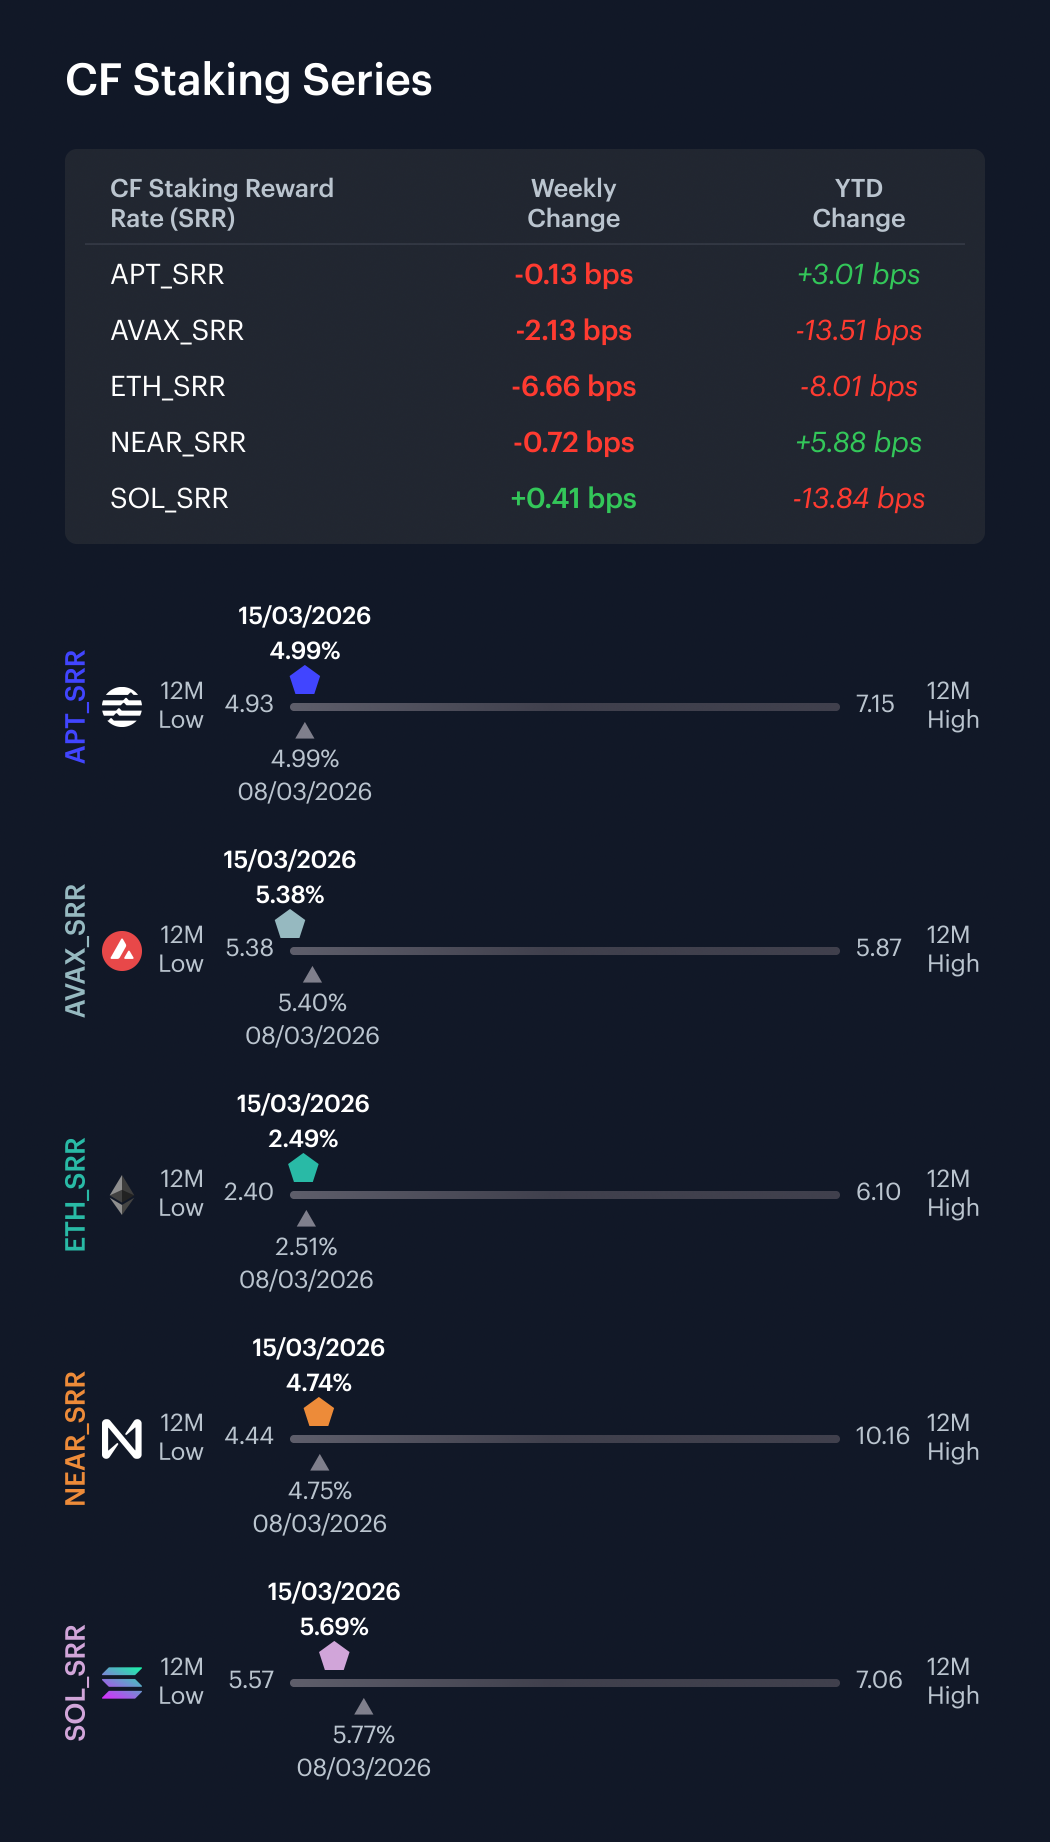
Staking reward rates were mostly stable over the week, with the price-return leg doing most of the talking. APT Staking returned a sliver less at -0.03% w/w with its seven-day reward rate move being from 4.9943% to 4.9930%, a -0.13-bps shift. AVAX Staking returned -0.39% w/w equating to its reward rate moving from 5.3987% to 5.3774%, a -2.13-bps change. ETH Staking was the clear outlier on price performance at -2.61% w/w, as its reward rate fell from 2.5550% to 2.4884%, a -6.66 bps move. NEAR Staking returned -0.15% as its reward rate edged from 4.7478% to 4.7406%, or -0.72 bps. SOL Staking posted the only positive weekly return at +0.07% w/w with its reward rate move from 5.6821% to 5.6862%, a 0.41 bps increase. Across the set, intra-week reward-rate changes ranged from -6.66 bps to 0.41 bps.
Interest Rate Analysis
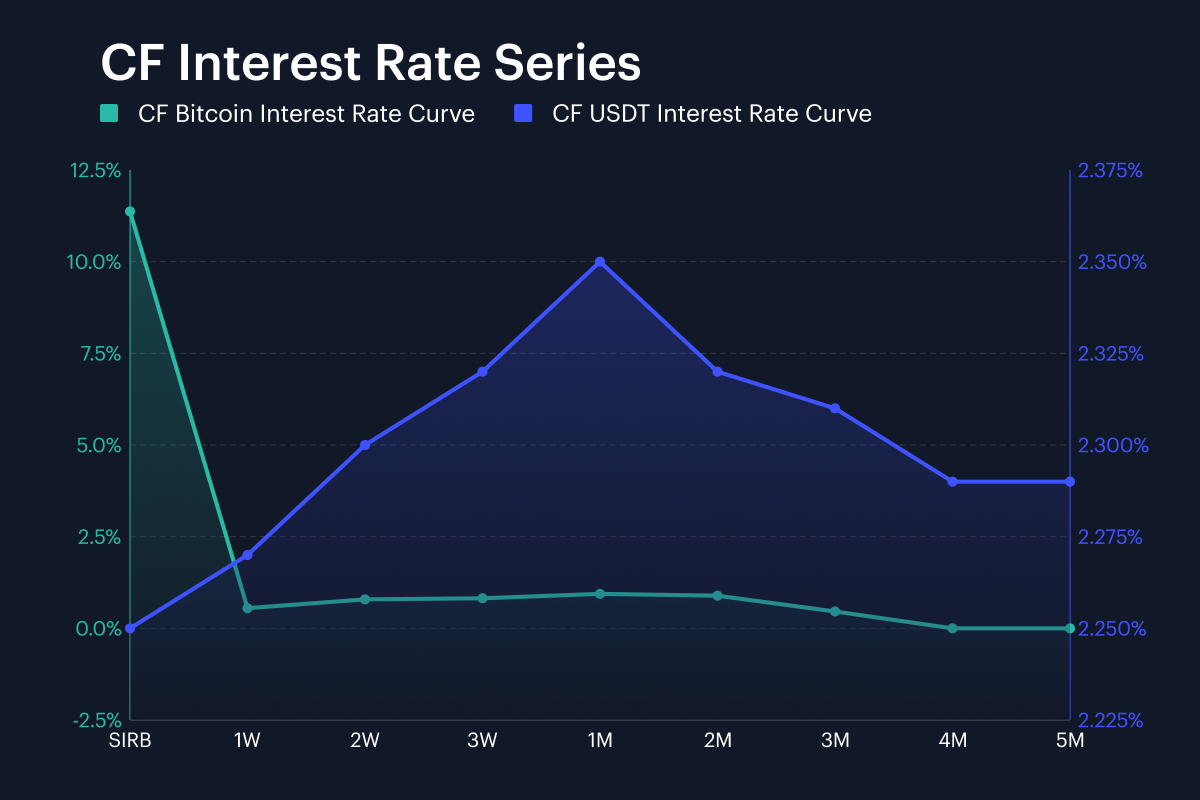
Funding conditions diverged sharply across the CF BIRC curves over the week, suggesting some distinct shifts in behavior and demand. Our Session Interest Rate for Bitcoin (SIRB) moved from 4.79% in the prior workbook to 11.37% in the current one, a 657.9 bps jump. The rest of the BTC curve pointed lower, with 1W moving from 1.40% to 0.55%, 2W from 1.07% to 0.79%, 2M from 1.07% to 0.89%, and 3M from 0.73% to 0.46%. USDT moved in a much cleaner direction, with its own session rate easing from 2.65% to 2.25% and the 1W to 3M strip falling by roughly -39.0 bps to -35.4 bps. The combined change set therefore ranged from -84.9 bps to 657.9 bps. The 657.9 bps move in BTC’s SIRB and the -84.9 bps move in BTC 1W, are so far apart they can essentially describe two different parts of the funding complex. The curve therefore reads as a Bitcoin-specific spot – or very front-end – dislocation sitting alongside softer term funding, and an easier USDT strip.
The information contained within is for educational and informational purposes ONLY. It is not intended nor should it be considered an invitation or inducement to buy or sell any of the underlying instruments cited including but not limited to cryptoassets, financial instruments or any instruments that reference any index provided by CF Benchmarks Ltd. This communication is not intended to persuade or incite you to buy or sell security or securities noted within. Any commentary provided is the opinion of the author and should not be considered a personalised recommendation. Please contact your financial adviser or professional before making an investment decision.
Note: Some of the underlying instruments cited within this material may be restricted to certain customer categories in certain jurisdictions.
Changes to the Token Market Price Benchmarks Series - Market Prices – 21 July 2026
The Administrator has confirmed changes to the Token Market Price Family for the period 14 July 2026 to 21 July 2026.

CF Benchmarks
Softer CPI Reprices July Hike Risk & Lifts Digital Assets
Digital assets extended their recovery over the past week as cooler US inflation prints repriced Fed expectations; the bid was broad across the large cap indices, growth factor leadership returned, stablecoin funding repriced lower, and stress stayed isolated in names hit by token-specific news.
Mark Pilipczuk
Notice of the Demising of CF Dai-Dollar Settlement Price and Spot Rate
The Administrator announces that it will demise the CF Dai-Dollar Settlement Price (DAIUSD_RR) and CF Dai-Dollar Spot Rate (DAIUSD_RTI) which are members of the CF Digital Asset Index Family.
CF Benchmarks
By clicking Accept, you consent to CF Benchmarks's use of cookies.
Visit Cookie Settings to learn how CF Benchmarks uses cookies and to adjust your preferences.