
Feb 07, 2026
Selloff Spotlights CME CF Bitcoin Volatility Index’s (BVXS) Role as Risk Barometer
How BVXS helps lifts the lid on implied vol. when Bitcoin throws one of its curve balls
Another Toast of Value
With Bitcoin’s drawdown accelerating into February, amid fragile broader-market sentiment, crypto is once again exhibiting characteristics that are more akin to those of a high-beta expression of macro uncertainty than commensurate with its portrayal as a longer-term store of value and potential hedge against monetary debasement.
Using standard means of quantifying this week’s drawdown relative to recent sell-offs we can compile a comparative list of market routs, per below.
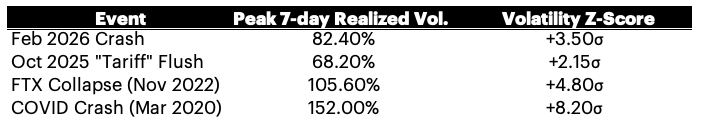
The suggestion is that although the latest sell-off does not currently read as being as extreme as 2020’s ‘COVID Crash’, or the one triggered by FTX’s implosion, at 3.5 sigma, the ‘speed’ of the most recent crash can certainly mark it as a traumatic episode for the market.
Measuring Air Pockets
The pace of such moves and reflexive dynamics that tend to develop when liquidations meet thinning liquidity – often characterized by participants as ‘air pockets’ – typically shifts attention from narratives about spot to the forward price of uncertainty: the premium investors will pay today for convexity and protection over the next month. For highly regulated institutional operators though, the availability of benchmarks suitable for assessment of such convexity and premia is limited.
BVXS’s Role
That is the purpose of the CME CF Bitcoin Volatility Index – the 30-day constant maturity measure of implied volatility, based on CFTC-regulated Bitcoin and Micro Bitcoin options contracts traded on CME Group’s marketplace.
This Week’s Spike
In this week's case, to get an idea of how eye-watering the upsurge of implied volatility has been, we can begin by noting the relatively moderate BVXS print at 55.01 on February 4th. That was followed by BVX spiking to as high as 90.76 on February 5th, at 21:40:30 GMT.
In fast markets, the relationship between a live reading and a daily settlement rate provides a useful gauge of repricing tempo. BVX will reflect the immediate clearing price of protection as conditions shift intraday. BVXS provides the benchmarked daily reference rate that risk owners can carry into reporting and governance artifacts.
Institutional-Grade Methodology
BVXS earns that institutional role through its construction. The settlement methodology aggregates intraday BVX observations across the day using time partitioning and volume-weighted averages, then equally weights the partition averages into a single daily settlement value. The design supports a benchmark-quality rate that remains grounded in traded options inputs while providing a stable daily reference point.
Read/download the CF Bitcoin Volatility Index Settlement (BVXS) Methodology Guide here.
BVXS in Action
Notwithstanding the whipsawing bounce by key crypto assets within the 24 hours or so before this piece was published – which can of course be characteristic of a continued phase of destabilization - the recent market downdraft provides an opportunity to witness the BVXS suite in action.
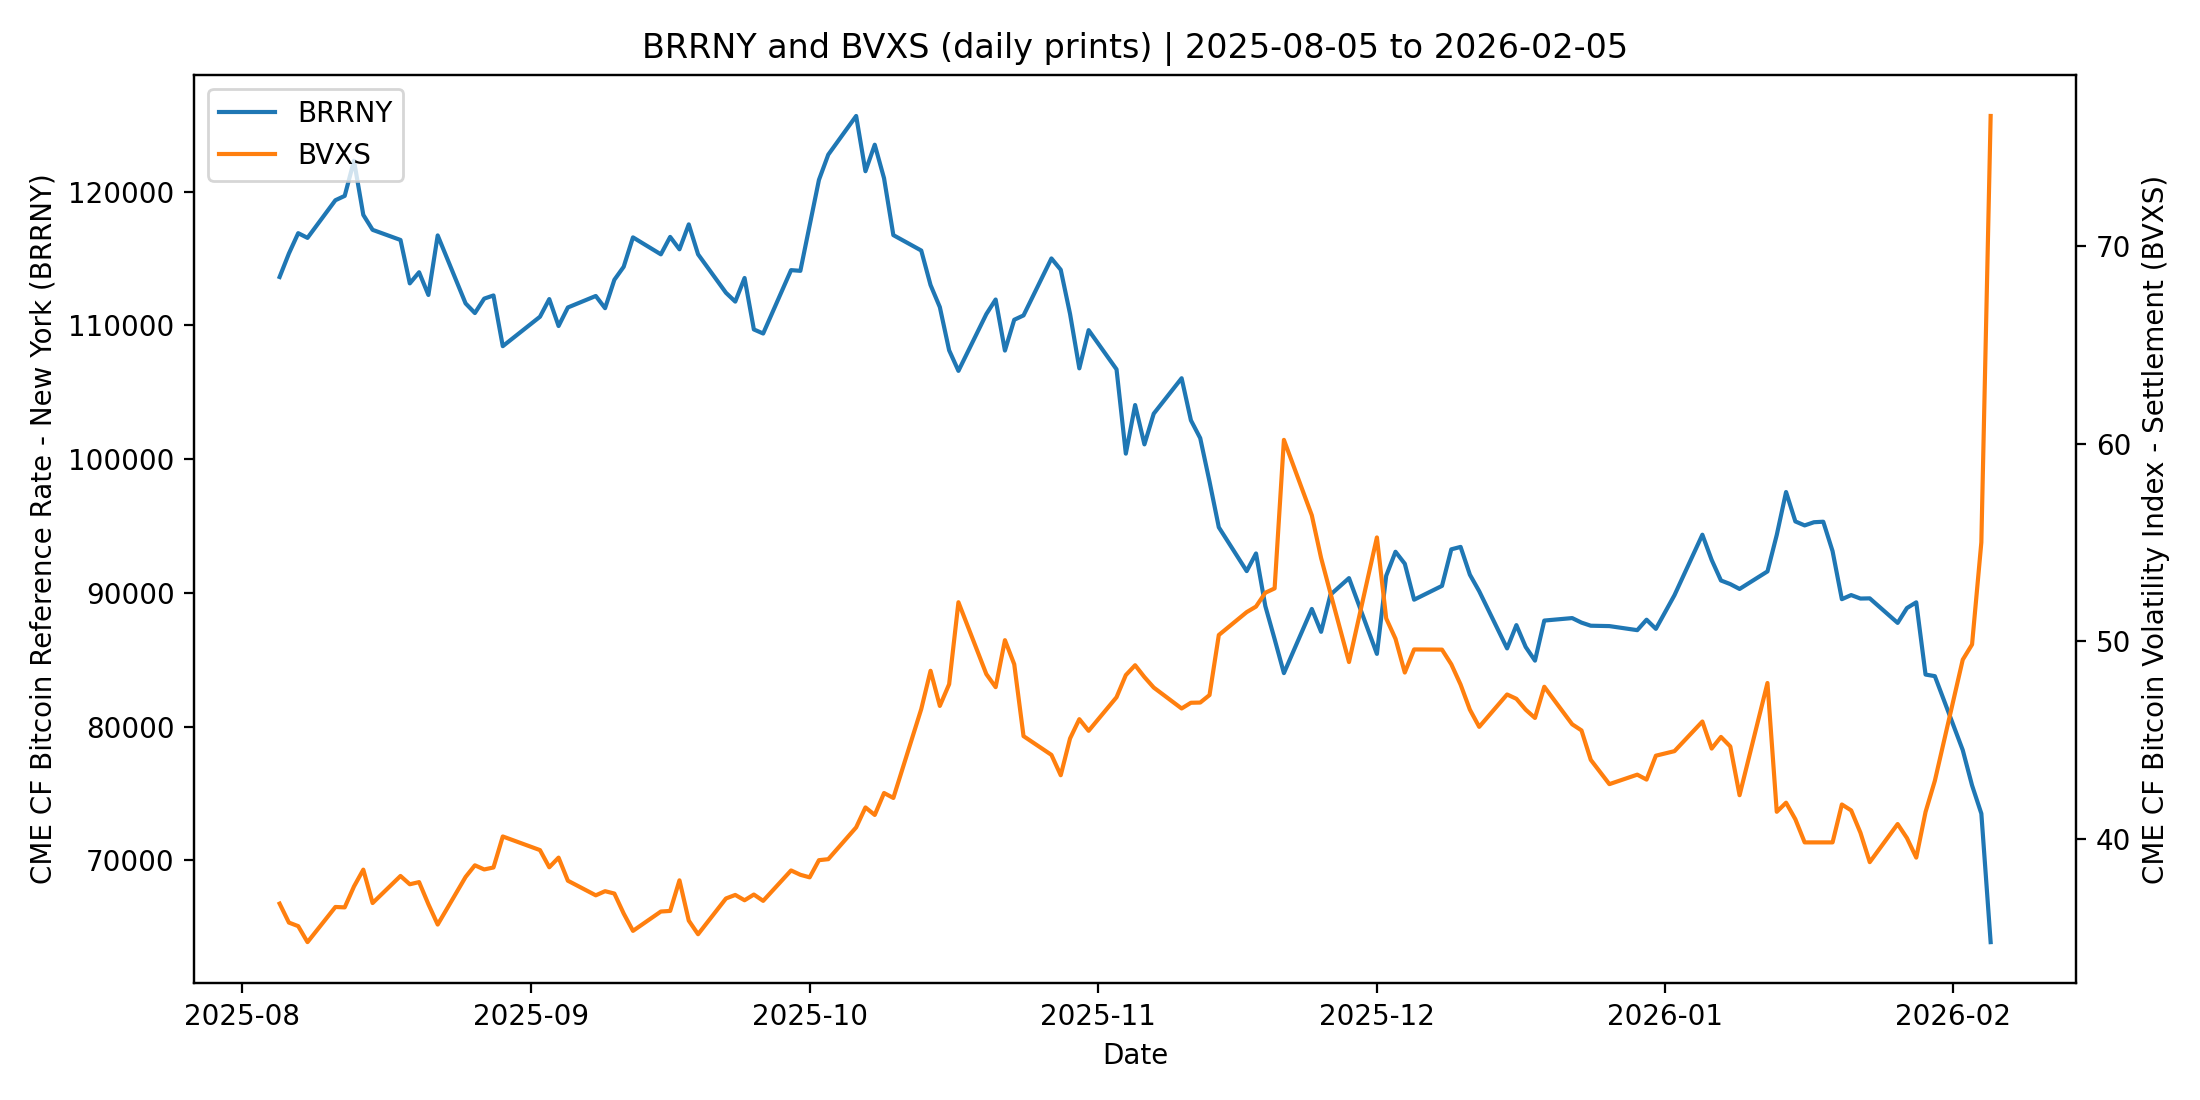
Note that BVXS has risen alongside lower readings of the CME CF Bitcoin Reference Rate – New York Variant (BRRNY) - as it typically does. That co-movement reflects a well-understood feature of stressed markets: as spot declines and realized turbulence increases, the market-implied cost of protection rises and implied volatility reprices higher.
Regime Shift
Such regime shifts are clearest when spot and implied volatility are placed on the same timeline. As spot breaks lower, BVXS rises, reflecting a higher market-implied premium for 30-day uncertainty. This is illustrated in Figure 1 below.
Figure 1 – BVXS vs. CME CF Bitcoin Reference Rate – New York Variant (BRRNY)
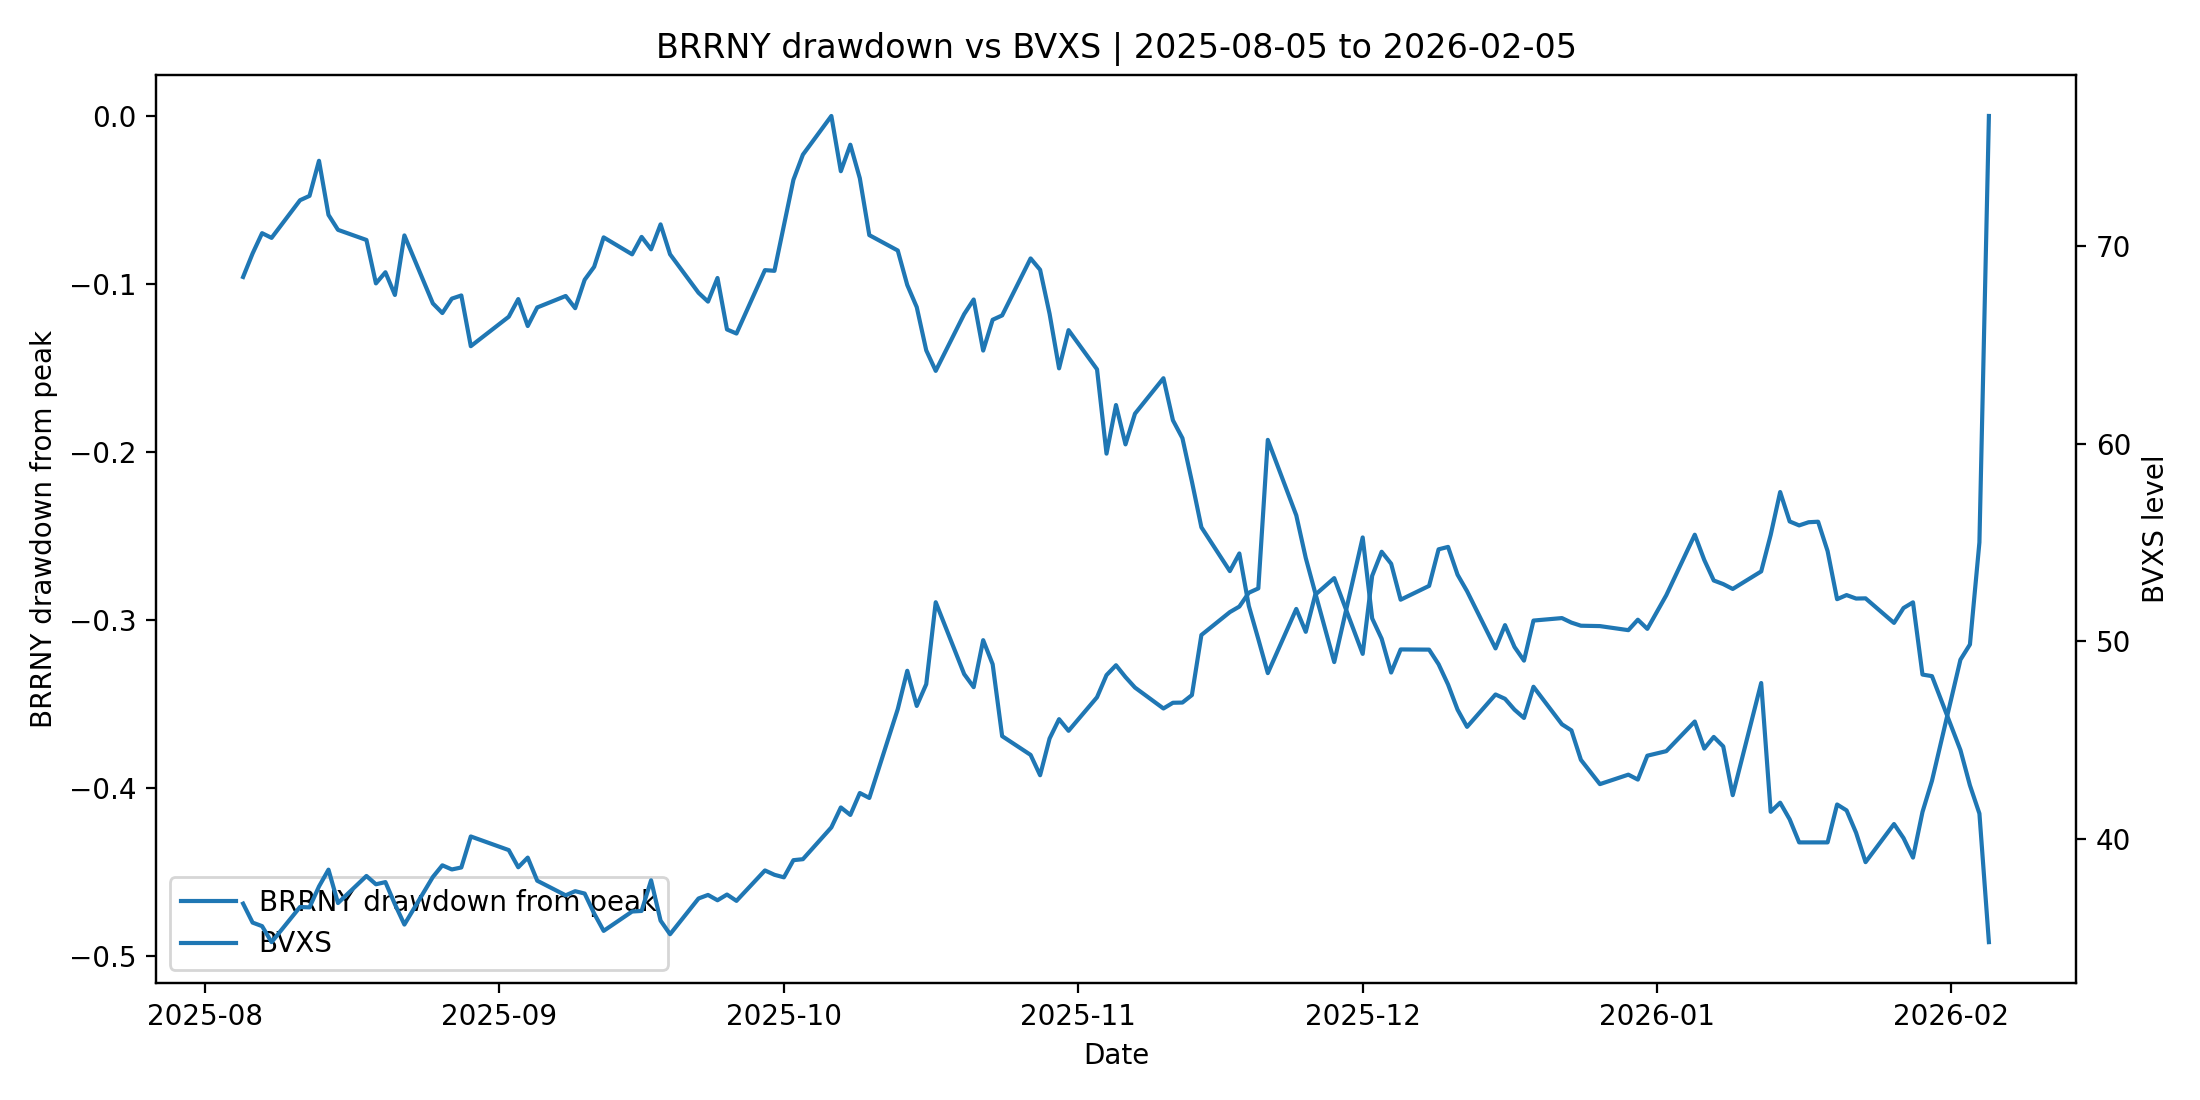
Mapping a Drawdown
For an alternative view, we can express the same relationship against a quantification of the drawdown. Mapping the drawdown as depicted by BRRNY’s peak alongside BVXS clarifies the convexity dynamic that tends to surface in selloffs. Specifically: as losses deepen, the premium for downside insurance commonly rises faster than the underlying declines, especially when markets begin to price gap risk and forced-selling effects. Drawdown framing makes the convexity dynamic more visible: as drawdowns deepen, the implied price of uncertainty commonly shifts upward in a non-linear way, as shown in Figure 2.
Figure 2 - BRRNY drawdown from peak vs. BVXS
Going Deeper with Analytics
From the simplest of determinations like those above, BVXS users can then progress to deeper analyses of the 30-day window and the entire term structure, by means of the CME Bitcoin option implied volatility analytics modules provided on the BVXS/BVX web page:
- Volatility Surface: fully functional, configurable and omnidirectional
- Volatility ‘Heat Map’: 2-D view of the volatility surface
- 30-Day Constant Maturity Volatility Skew Visualization
Note these visualizations, which update automatically in step with trading of CME Group Bitcoin options, are publicly and freely available exclusively on the CME CF Bitcoin Volatility Index page at cfbenchmarks.com.
A snapshot is shown in Figure 3 below:
Figure 3 – Analytics on BVXS web page: (L to R) Volatility Surface, Heatmap, 30-Day Constant Maturity Skew
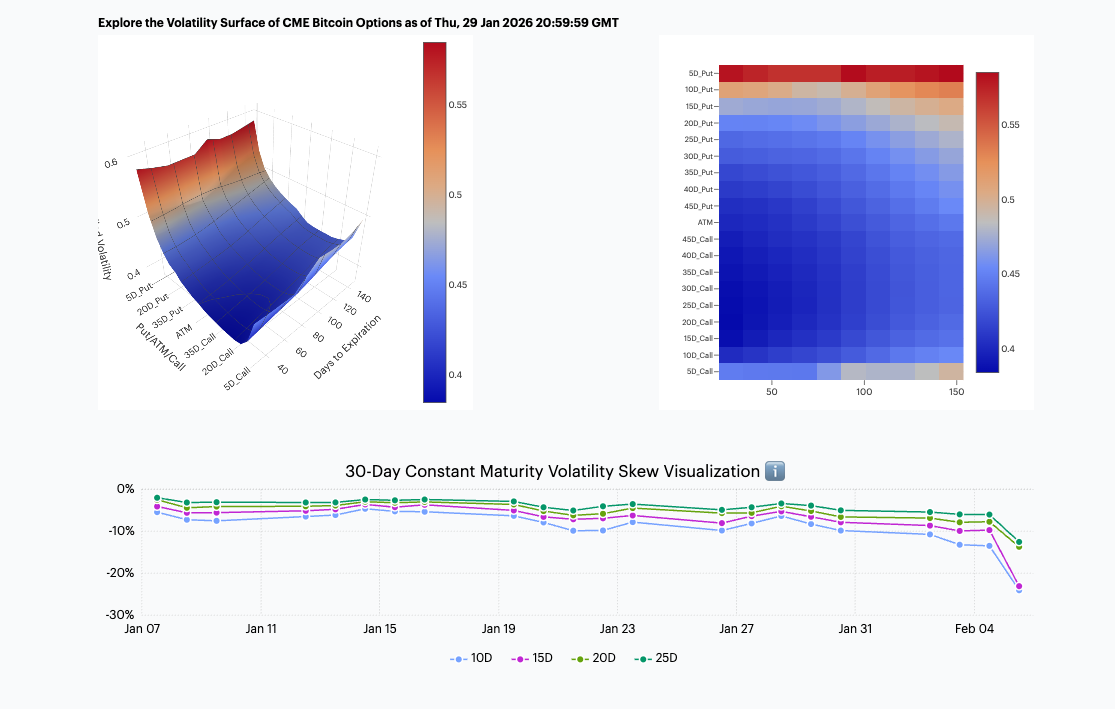
A Granular View of Now
The volatility surface and implied volatility/delta heatmap show the distribution of implied volatility across strikes and expiries, providing a more granular read on where protection demand is concentrated.
For instance, in our snapshot above, implied volatility on the put wing shows particularly strong readings in short-dated expiries. That pattern aligns with near-term demand for crash insurance. Investors are paying up for protection where it is most sensitive to downside tail outcomes, and where near-horizon liquidation dynamics can dominate.
The 30-day Constant Maturity Skew Visualization reinforces the same message. Into early February, skew steepened materially at low deltas, with the 10-delta and 15-delta points pushing deeper into the negative. This steepening is the options market’s way of pricing asymmetry: downside convexity becomes comparatively expensive, and the implied distribution shifts toward a heavier left tail. Taken together, the surface level, the skew shape, and the tenor concentration form a cohesive read of institutional positioning and hedging demand.
VIX Vibes
As shown from our brief examination of Bitcoin’s latest tumult, BVXS is quite analogous to the CBOE Volatility Index (VIX) in function. Both VIX and BVXS are widely interpretable, forward-looking 30-day implied volatility benchmarks, derived from primary CFTC-regulated options markets. This suggests BVXS deployment will be intuitive for stakeholders who already anchor on volatility benchmarks in other asset classes.
While methodological details differ across indices and markets, and adoption determines whether any benchmark becomes the market’s default shorthand, it is notable that BVXS already sits on strong institutional foundations through regulated CME options inputs and a benchmark-grade settlement design.
Similarly, it ought to go without saying that while offshore venues may lead on raw activity, regulated inputs remain central for institutional workflows because they support governance, auditability, and repeatable reference-rate usage. BVX and BVXS provide the institutional lens on Bitcoin options-implied risk using CME Group’s regulated options complex, with analytics that make surface and skew dynamics observable rather than anecdotal.
Conclusion
For product issuers and institutional risk owners, BVXS offers operational and interpretive value when examining a drawdown tape, like the current one. The BVXS suite provides a benchmark-quality daily gauge of the market-implied uncertainty premium for Bitcoin, supported by surface and skew diagnostics that show how the distribution is being priced across strikes and expiries. In the current repricing, the message is clear: implied uncertainty has risen sharply, the market is paying up for downside convexity, and the stress premium is concentrated near the front of the curve.
Just like in the current sell-off, BVXS makes such shifts legible, with single, daily reference rates that institutional professionals can rely on.
The information contained within is for educational and informational purposes ONLY. It is not intended nor should it be considered an invitation or inducement to buy or sell any of the underlying instruments cited including but not limited to cryptoassets, financial instruments or any instruments that reference any index provided by CF Benchmarks Ltd. This communication is not intended to persuade or incite you to buy or sell security or securities noted within. Any commentary provided is the opinion of the author and should not be considered a personalised recommendation. Please contact your financial adviser or professional before making an investment decision.
Note: Some of the underlying instruments cited within this material may be restricted to certain customer categories in certain jurisdictions.
Changes to the Token Market Price Benchmarks Series - Market Prices – 21 July 2026
The Administrator has confirmed changes to the Token Market Price Family for the period 14 July 2026 to 21 July 2026.

CF Benchmarks
Softer CPI Reprices July Hike Risk & Lifts Digital Assets
Digital assets extended their recovery over the past week as cooler US inflation prints repriced Fed expectations; the bid was broad across the large cap indices, growth factor leadership returned, stablecoin funding repriced lower, and stress stayed isolated in names hit by token-specific news.
Mark Pilipczuk
Notice of the Demising of CF Dai-Dollar Settlement Price and Spot Rate
The Administrator announces that it will demise the CF Dai-Dollar Settlement Price (DAIUSD_RR) and CF Dai-Dollar Spot Rate (DAIUSD_RTI) which are members of the CF Digital Asset Index Family.
CF Benchmarks
By clicking Accept, you consent to CF Benchmarks's use of cookies.
Visit Cookie Settings to learn how CF Benchmarks uses cookies and to adjust your preferences.