
May 04, 2022
How to see Crypto Portfolio Return Drivers in 3D, with DACS

Credible crypto portfolio return attribution is now possible for the first time, with CF Digital Asset Classification Structure
Digital asset portfolios need classic construction too
The ‘classic’ process of portfolio construction is (or should be) germane to all forms of investment assets, including digital assets.
In digital assets as well as equities, or any other asset class, the primary aim is to generate returns that meet a specific objective. That objective can vary. It might be to maximise absolute returns; maximise risk adjusted returns; target exposure to specific forms of return drivers, or risk premia or to target exposure to specific forms of economic activity.
Regardless of stated objective though, a portfolio manager must attribute asset performance to specific return drivers, so they can be observed and better understood, and so that conditions that bring them about can be optimised.
For any comprehensive attribution analysis, identification of the specific forms of economic activity that an asset is associated with is an essential initial step. In the traditional asset classes of equity and credit, this identification is achieved by determining the economic sector the issuer is engaged in; typically, by means of classification systems like Global Industry Classification Standard (GICS) or Industry Classification Benchmark (ICB).
Until recently though, no equivalent means of classification existed for the digital asset class—making cogent measurements of digital asset performance against real-world activity impossible.
Furthermore, given that cryptoasset investment is subject to several more potential risks than, say, investing in equities, the lack of such a framework for digital assets was a significant impediment to successful investing, because it compounded such risks, particularly those associated with information asymmetry and portfolio concentration.
And naturally, in a market like crypto, where total market capitalisation is dominated by the two largest digital assets, Bitcoin and Ethereum, diversification is arguably even more critical, though not necessarily straightforward to achieve.
As such, it ought to be clear that digital asset investors need to be particularly vigilant in the portfolio allocation process in order to successfully achieve a balanced portfolio, or indeed to execute any bias (overweight or underweight) towards specific areas of the blockchain economy.
Getting to 3D: CF Digital Asset Classification Structure
The ‘missing link’ that could realistically enable achievement of such goals is a purpose-made framework that provides an overarching understanding of the blockchain economy, thereby improving the process of constructing a digital asset portfolio.
Previously, constructing and managing a digital asset portfolio was almost akin to working in ‘two dimensions’: with (1) subjective asset information (often faulty) and/or (2) public asset information – again, not guaranteed to be unproblematic.
Following CF Benchmarks’ recent publication of CF Digital Asset Classification Structure (DACS), a ‘third dimension’—objective standards of digital asset classification—is now available.
Read our DACS Compact Primer here.
Watch our 3-minute DACS video.
In essence, DACS is the first taxonomy of its kind for classification of the digital asset universe, formulated by a regulated Benchmark Administrator.
Not your traditional asset classification system
Whilst DACS is similar in principle to classification systems for exchange traded assets in mainstream markets—for instance GICS, or ICB, for equities—it’s important to understand two key differences between DACS and traditional classification systems. We outline them below.
- Pro-adoption functions vs. just functions
The chief conceptual difference between DACS and traditional asset classification systems is that whilst the classification basis of the latter is the primary business activity (or business function) of each asset, the preeminent basis of DACS classification is the function through which a particular protocol seeks to service its stated outcome through adoption. The importance of this refinement is eloquently stated in the Usage and Adoption section of the DACS Methodology Guide:
“To classify Digital Assets by the software protocols over which ownership of a digital asset [would confer] rights to, would yield an adoption-based classification. All software protocols will evolve in such a way that seeks to deliver outcomes, whether monetary or otherwise, for their users and token owners. Therefore, we can go further and say that Digital Assets can be classified by the functions through which outcomes are achieved. For example, a software protocol that seeks to deliver outcomes in the DeFi space is classified as a DeFi protocol.”
2. Rules-based eligibility
The other fundamental difference between DACS and traditional asset classification systems is its use of rules-based eligibility criteria. The necessity of these is easy to understand, with a plethora of digital assets—of varying quality—already in existence, and as their amount continues to expand at a rapid rate.
The chief outcome of the criteria is that DACS classifies – on an exclusive and comprehensive basis – investible and liquid digital assets. In turn, given the applicability of CF Benchmarks’ regulated Benchmark Methodology to all assets classified by DACS, each asset can be assigned a publicly available, DACS Category and DACS Subcategory.
The Crux
Attributing notional digital asset portfolio returns to DACS Categories and Subcategories provides information and insights into the economic reality engendered by holdings at a higher-resolution than is possible from an examination of the assets and their weights alone.
There are three key portfolio management functions enabled by this facility:
- Precise quantification of portfolio exposure to the blockchain economy, and thus to real-world activity, expressed in terms of the DACS Categories and Subcategories
- Accurate determination of the economic reality engendered by blockchain networks’ underlying portfolio exposure, due to DACS’s systematic discernment of the blockchain characteristics driving the economic activity a protocol addresses
- Optimisation: the key utility of DACS as a tool that enables impartial, quantitative portfolio assessments, is its deployment for optimised allocation through the improved understanding of the digital asset universe that DACS offers, so that portfolios better reflect intended exposure to the blockchain economy
Model Attribution: Nasdaq Crypto Index
Having outlined how CF Digital Asset Classification Structure makes return attribution in digital asset portfolio construction possible for the first time, we can now demonstrate the use of DACS for this purpose, in practice.
We’ll do this by applying DACS to one of the most salient public portfolios of digital assets available - Nasdaq Crypto Index (NCI).
About Nasdaq Crypto Index
Launched early in 2021, Nasdaq Crypto Index is one of the best-known digital asset portfolios among traditional and crypto market participants alike. It is designed to measure the performance of a significant and diversified proportion of the digital asset market, aiming to provide a benchmark for institutional investment in the asset class.
Administered by Nasdaq and calculated by CF Benchmarks the NCI incorporates the same critical qualities of market accuracy and reliability that applies to all indices and pricing products calculated CF Benchmarks.
Nasdaq’s design for NCI is dynamic whilst applying rigorous liquidity, exchange and custody standards as prerequisites to asset eligibility, ensuring that the index remains fully replicable.
Even so, it’s worth noting that the NCI methodology is not designed to enforce a parametric standard of diversification.
This makes NCI a suitable example of a digital asset portfolio that is likely to develop generally in line with the broad capitalisation of the digital asset universe.
It’s in cases like this that CF Digital Asset Classification Structure can be used to quantify exposure of the portfolio to that universe more precisely.
NCI, unfiltered
Now, as we have repeatedly stressed, DACS was specifically designed to be understood and ‘consumed’ in visual form, so a graphical illustration of the NCI portfolio is an elegant way to begin.
‘Unfiltered’ Nasdaq Crypto Index constituent weightings, following its most recent rebalancing on March 1st, 2022, are shown in Figure 1.
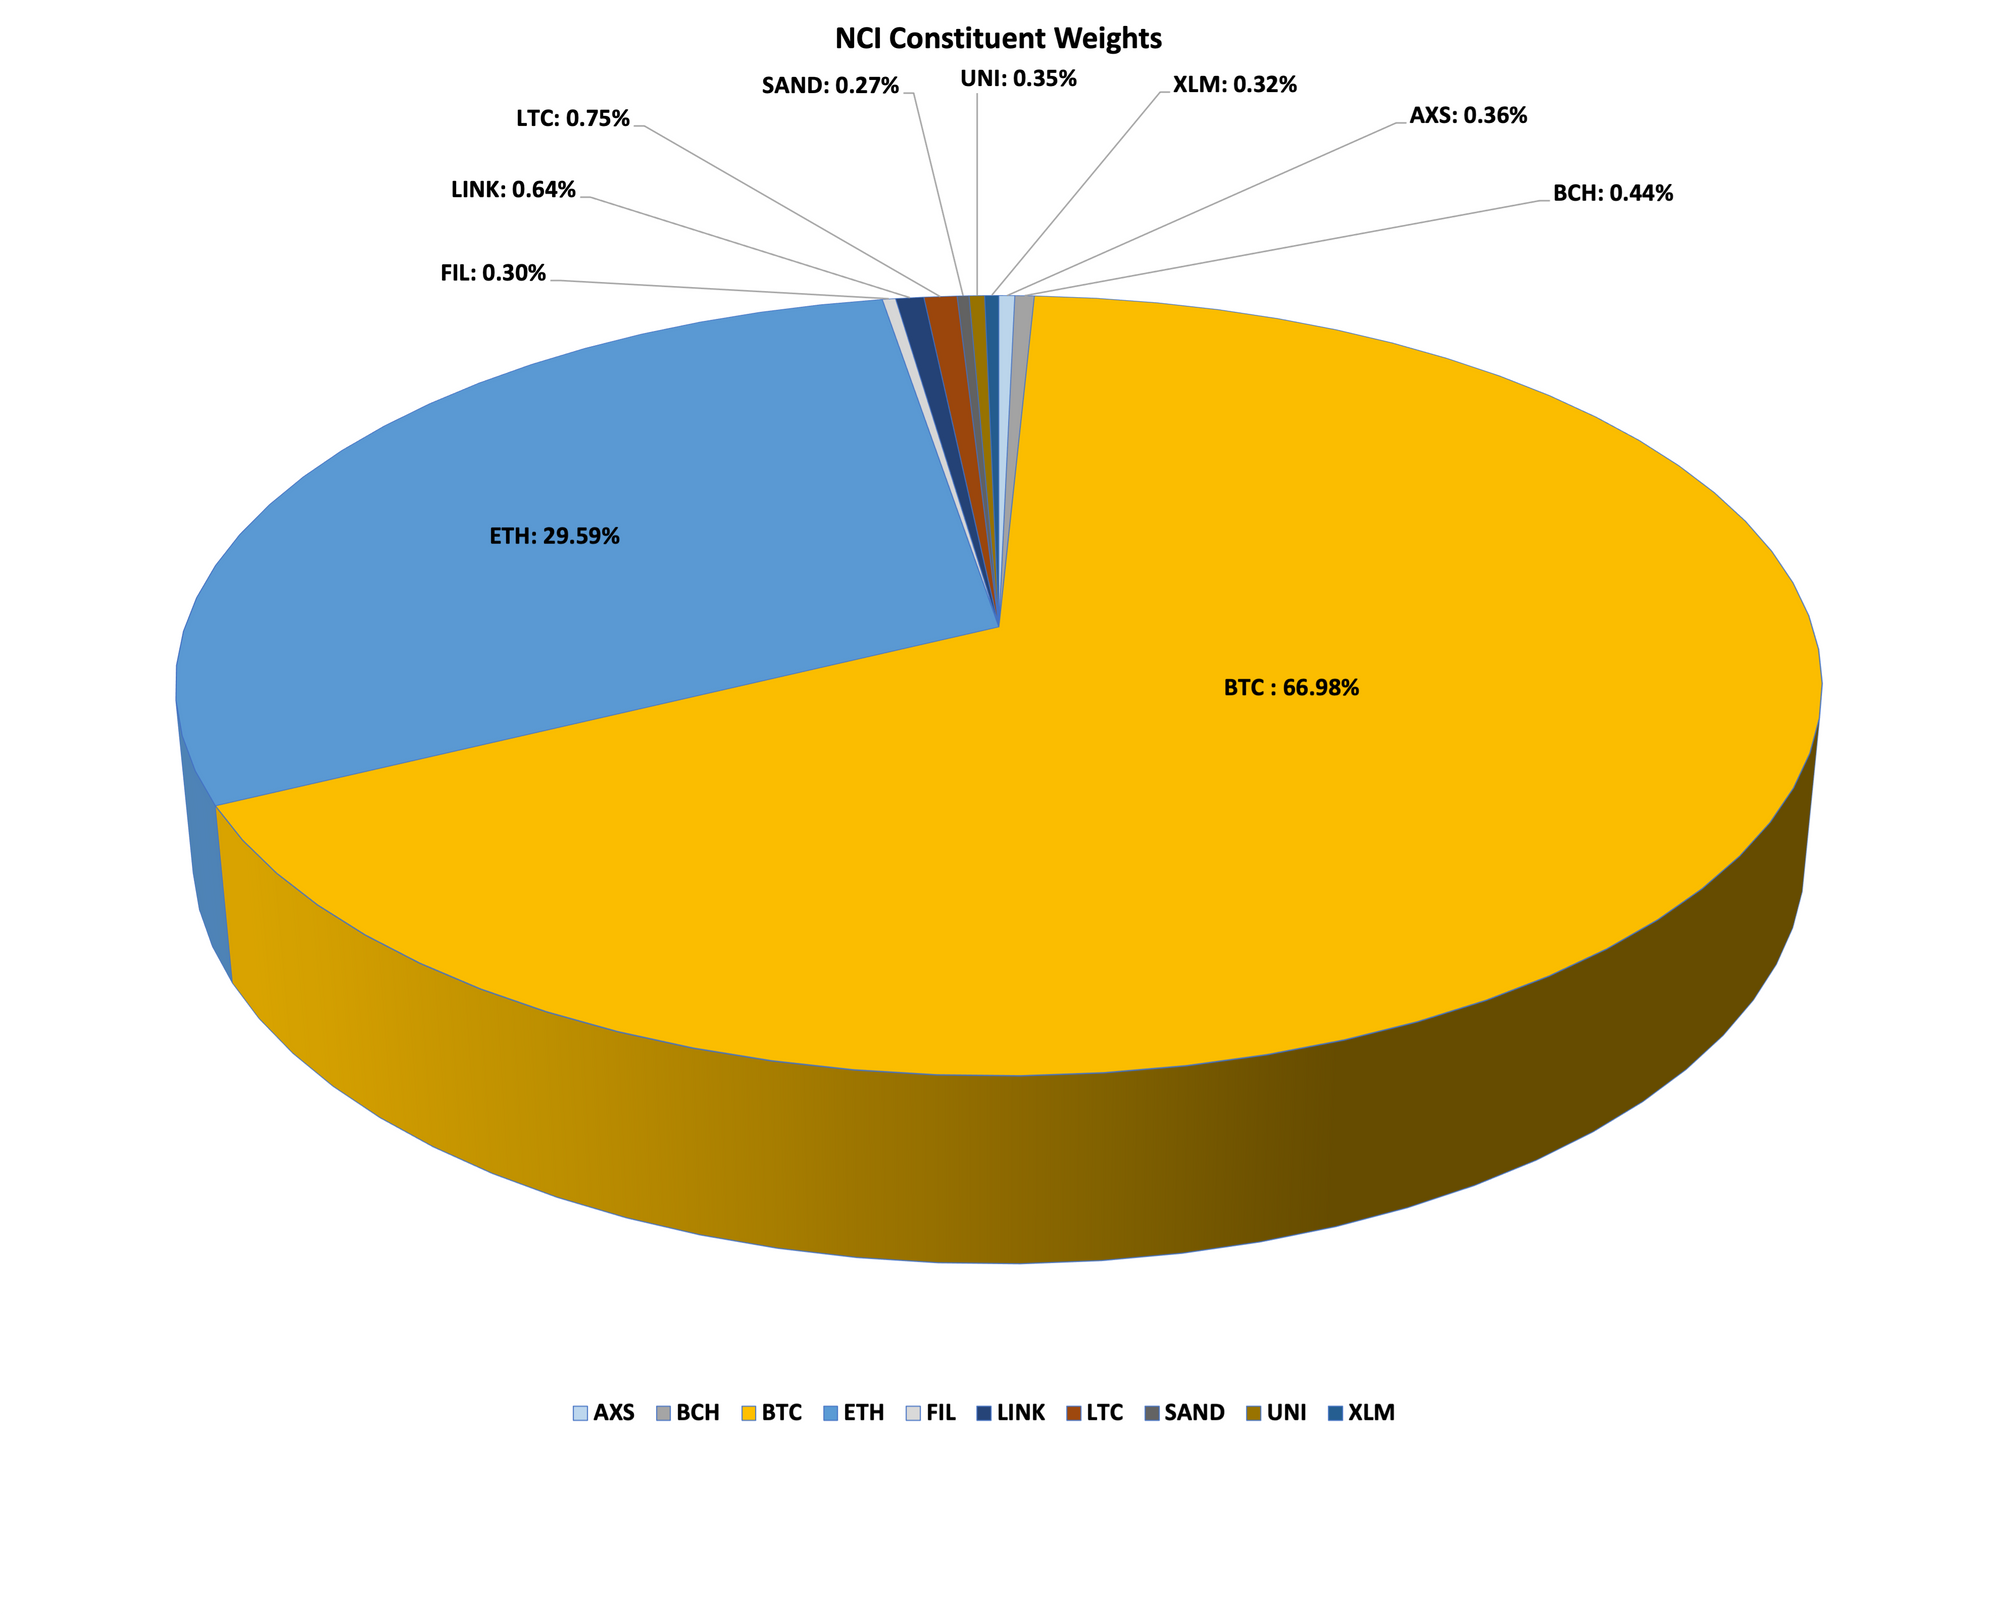
This graphic shows the exact extent of the portfolio’s exposure to the two coins that account for the bulk of digital asset free float market capitalisation. With a 66.98% weighting to Bitcoin and a 29.59% weighting to Ether, NCI indicates significant representation of the crypto market as that market currently stands.
Consequently, NCI’s current constituent weightings point to successful implementation of its implied investment objective: an accurate, investible representation of returns of the Top 10 digital assets by free float market capitalisation.
And, given that a large cohort of investors is likely to have a similar digital asset investment objective, NCI is also probably a fair representation of a typical ‘passive’ crypto portfolio.
Get granular
As we’ve noted though, the CF Digital Asset Classification Structure affords a far more granular assessment of the blockchain economy in general, and of digital asset portfolio exposure to potential drivers of that economy in particular. It’s this facility that opens access to the key portfolio management functions we outlined earlier.
For those new to DACS, it’s worth explaining that, in essence, the structure demarcates eligible protocols into the three major Categories: Sector Applications, On-chain Services and Settlement protocols.
It then sub-divides these Categories further into the Subcategories shown below:
Sector DApps
- Finance - chiefly DeFi
- Culture - DApps for creation, engagement or consumption, of art, music, entertainment, games, etc.
- Industry - Protocols centred on ‘traditional’ economic sectors
On-chain Service Protocols
- Information Providers – provide ancillary support to Sector Applications by delivering data on-chain
- Scaling – provide scaling solutions for Sector Applications
Settlement Protocols – Layer 1 blockchains with in-network usage fees
- Non-Programmable blockchains - Bitcoin is currently the principle one of these
- Programmable blockchains - chiefly, Ethereum
Nasdaq Crypto Index in ‘3D’
Now, let’s map Nasdaq Crypto Index’s exposure to the three protocol Categories and their seven Subcategories.
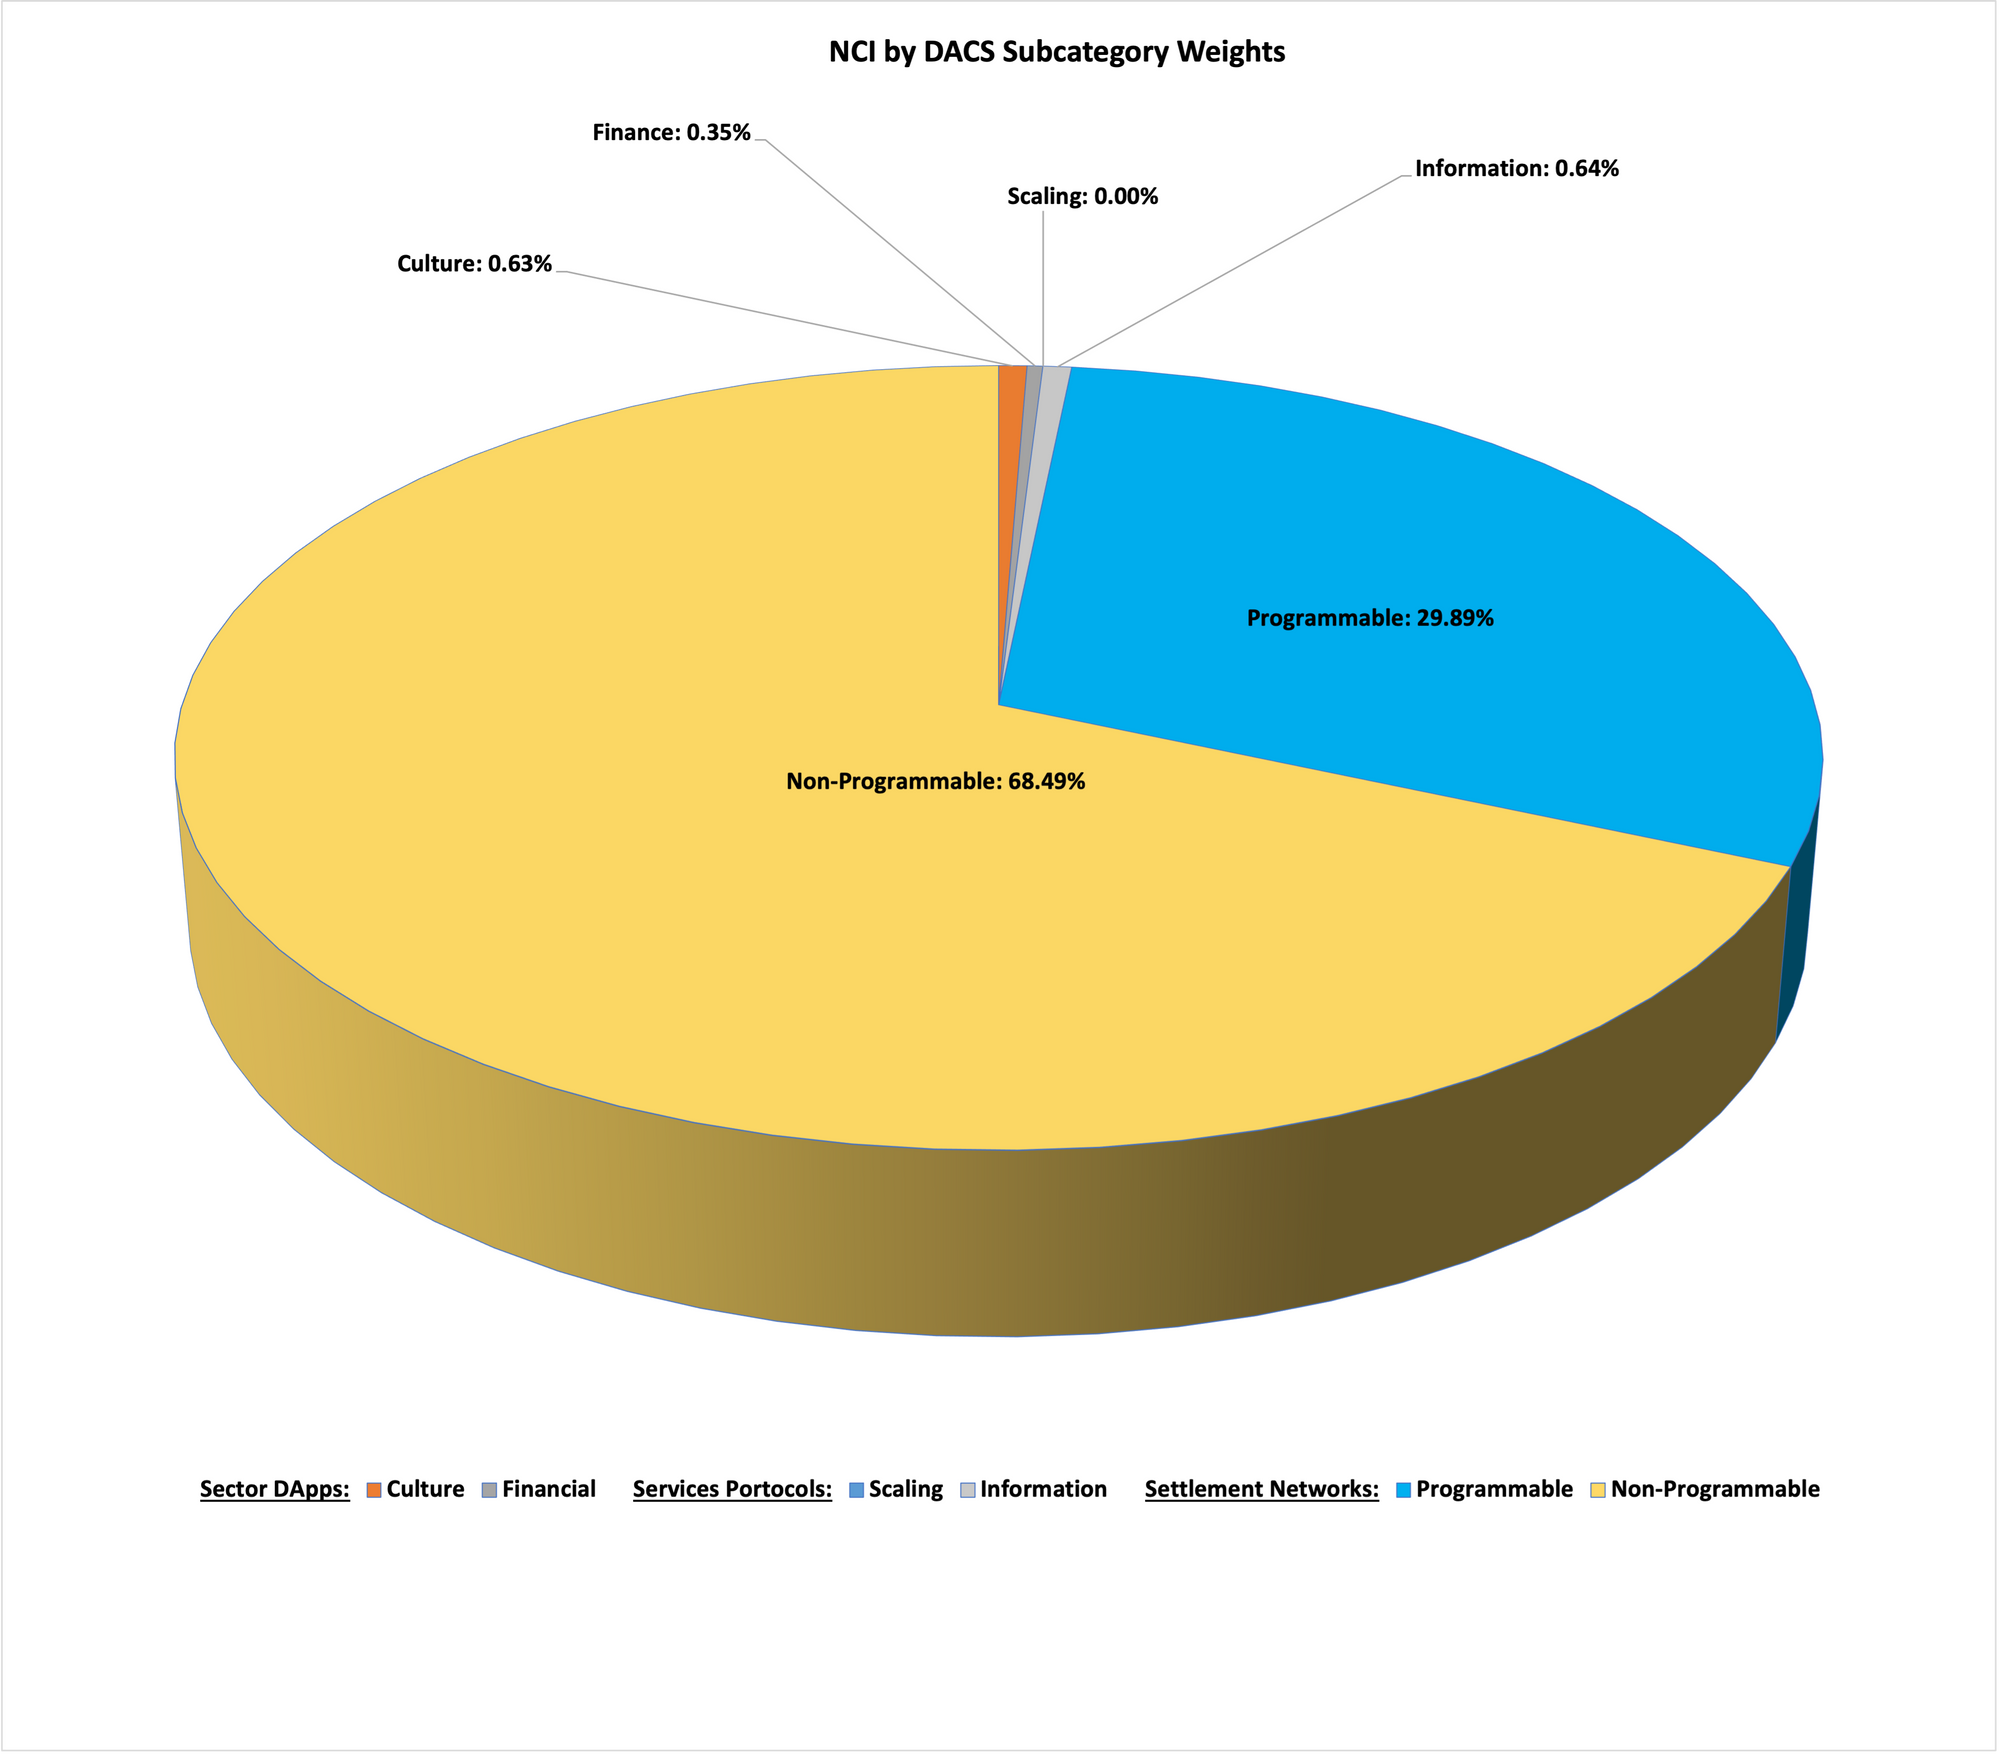
- Bitcoin’s dominance in Non-Programmable protocols and Ether’s pre-eminence in Programmable protocols makes NCI’s 68.49% weighting and 29.89% weighting in those Subcategories, respectively, unremarkable.
- Likewise, the portfolio’s consequent 98.38% total weighting in Settlement Protocols isn’t particularly illuminating.
It’s at the Subcategory level that NCI’s exposure to the three types of digital asset protocols becomes much more interesting.
As shown in Figure 2., NCI’s extreme overweight in Settlement Protocols is quantified, alongside precise metrics for its weak exposure to the Sector DApps Subcategories – Finance (0.35%) and Culture (0.63%).
(At the time of writing, there were no live protocols available for classification under the ‘Industry’ Subcategory, so it was omitted from the graphic).
Seeing (and acting) in 3D
NCI’s low weightings in Finance and Culture are partially reflective of the relatively low prevalence of those Subcategories as a percentage of total digital asset market capitalisation.
Nevertheless, with higher-resolution insight into notional portfolio exposure, and the more comprehensive model of the digital asset universe that DACS provides, investment managers are now possessed of the best possible information available, for any potential allocation adjustments required to meet current objectives.
In the case of a portfolio like Nasdaq Crypto Index, the manager might decide, for example, that an increased allocation to Finance DApps is required.
The Finance Subcategory chiefly relates to DeFi. The sole protocol currently allocated to that Subcategory in NCI is Uniswap (UNI), the decentralised exchange underpinned by liquidity pools.
Yet a glance at the Finance subdivision of a visualised model of DACS (below), shows two further protocols classified under this Subcategory, Aave (AAVE) and Compound (COMP).
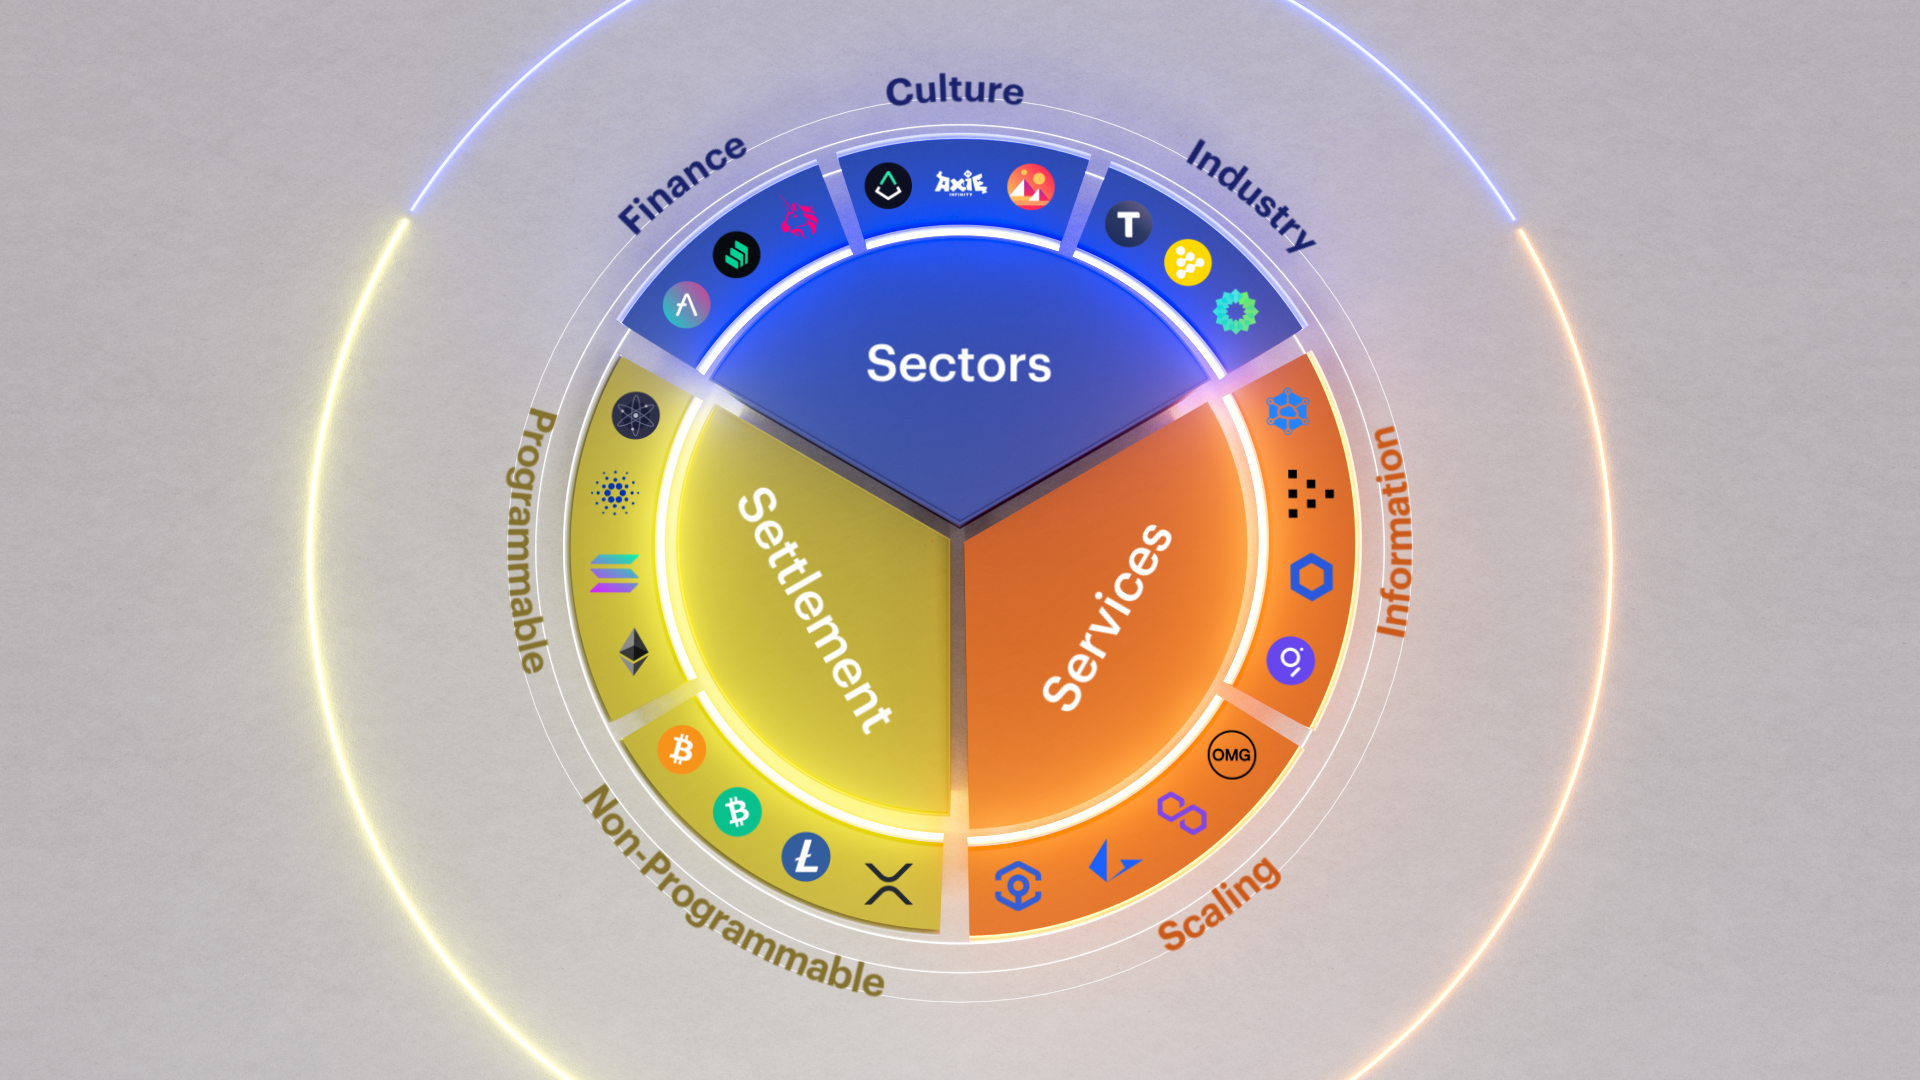
Though not shown in the image, there are also an additional two protocols eligible for classification under the Finance Subcategory: Curve (CRV) and yearn.finance (YFI).
Clarity on the classification of these protocols, by use of DACS, would provide greater scope for fine-tuning the NCI portfolio to the Finance Subcategory, should investment objectives require it.
The same considerations would apply to Scaling network protocols, to which NCI has zero exposure, and Information (0.64% of NCI) which chiefly relates to protocols supporting oracles.
Summary
The pressing need for a credible means of conducting return attribution on digital asset portfolios has now been satisfied with the advent of CF Digital Asset Classification Structure, representing the latest step in the professionalisation and ‘normalisation’ of the crypto asset class, whilst removing yet another obstacle to routine, scalable, institutional investment.
With reference to DACS’s protocol Categories and Subcategories, we’ve shown how the structure affords accurate determination and precise quantification of portfolio exposure, helping to pave the way for reliable portfolio optimisation, in service of any investment objective.
We then outlined the essentials of what a return attribution by means of DACS might look like when applied to the Nasdaq Crypto Index. Finally, as an example of how DACS helps achieve specific investment objectives, we’ve illustrated how the structure could point the way to increased and more precisely calibrated diversification of the NCI, by systematic illumination of eligible protocols.
Understand CF Digital Asset Classification Structure in 3 minutes by watching the video below
The information contained within is for educational and informational purposes ONLY. It is not intended nor should it be considered an invitation or inducement to buy or sell any of the underlying instruments cited including but not limited to cryptoassets, financial instruments or any instruments that reference any index provided by CF Benchmarks Ltd. This communication is not intended to persuade or incite you to buy or sell security or securities noted within. Any commentary provided is the opinion of the author and should not be considered a personalised recommendation. Please contact your financial adviser or professional before making an investment decision.
Note: Some of the underlying instruments cited within this material may be restricted to certain customer categories in certain jurisdictions.
Digital Assets Absorb Hawkish Repricing Ahead of the FOMC
Digital assets traded through a hawkish macro surprise this week but closed mostly higher, with breadth holding across major names and indices. Sector leadership traced to a single regulatory catalyst, not a broad rotation, and implied volatility stayed firmer than realized into the weekend.

Mark Pilipczuk
Factor Friday - July 24, 2026
Beta's four-week grind higher stalled this week as style leadership rotated again: Momentum took the top spot, last week's leader Value fell to the bottom, and Growth stayed July's weakest factor. Size remains the only style factor positive on the year; beta, not style selection, is setting returns.
Mark Pilipczuk
Changes to the Token Market Price Benchmarks Series - Market Prices – 21 July 2026
The Administrator has confirmed changes to the Token Market Price Family for the period 14 July 2026 to 21 July 2026.
CF Benchmarks
By clicking Accept, you consent to CF Benchmarks's use of cookies.
Visit Cookie Settings to learn how CF Benchmarks uses cookies and to adjust your preferences.