
Dec 09, 2025
CF Benchmarks Quarterly Attribution Reports - December 2025

Uncertainty and Liquidations Collide with Monetary Tailwinds & Adoption Breakthroughs
The latest rebalance period left digital assets balancing between macro repricing, historic liquidations, and continued structural progress. From September through early December, the market had to digest two Fed cuts, fading hopes for rapid easing in 2026, and renewed trade tensions even as access widened through new ETFs and derivatives. September opened on a firmer note after the Fed’s first rate cut of the cycle and a surge in flows into spot Bitcoin ETFs, while the SEC’s approval of generic listing standards for commodity-based trust shares effectively removed the bespoke gatekeeping that had constrained crypto ETPs beyond Bitcoin and Ether.
October marked an inflection in both accessibility and risk. The first U.S. spot Solana staking ETF attracted over $400 million in its first week, and CME expanded crypto options coverage to Solana and XRP, underscoring the ongoing institutionalization of the asset class. That progress was abruptly tested on October 10, when tariff headlines sparked the largest liquidation event in crypto history, wiping out more than $19 billion in leveraged positions and briefly driving Bitcoin below $105,000. November then refocused attention on growth and inflation, as fading expectations for additional rate cuts and rising cross-asset volatility drove Bitcoin into the low-$80Ks and triggered some of the heaviest weekly ETF outflows of the year, even as new hedging tools like the Bitcoin Volatility Indices (BVX/BVXS) launched to meet growing institutional demand for risk management.
The quarter ultimately underscored how size, liquidity, and balance-sheet support shaped outcomes. Capital rotated aggressively into Bitcoin and Ether, while higher-beta sectors and less liquid tokens bore the brunt of deleveraging. Smart contract platforms, DeFi, and digital culture assets all lagged sharply, revealing how liquidity premia and the downside effects of volatility can dominate in a risk-off regime.
Key takeaways:
Liquidity Premia Define Relative Returns
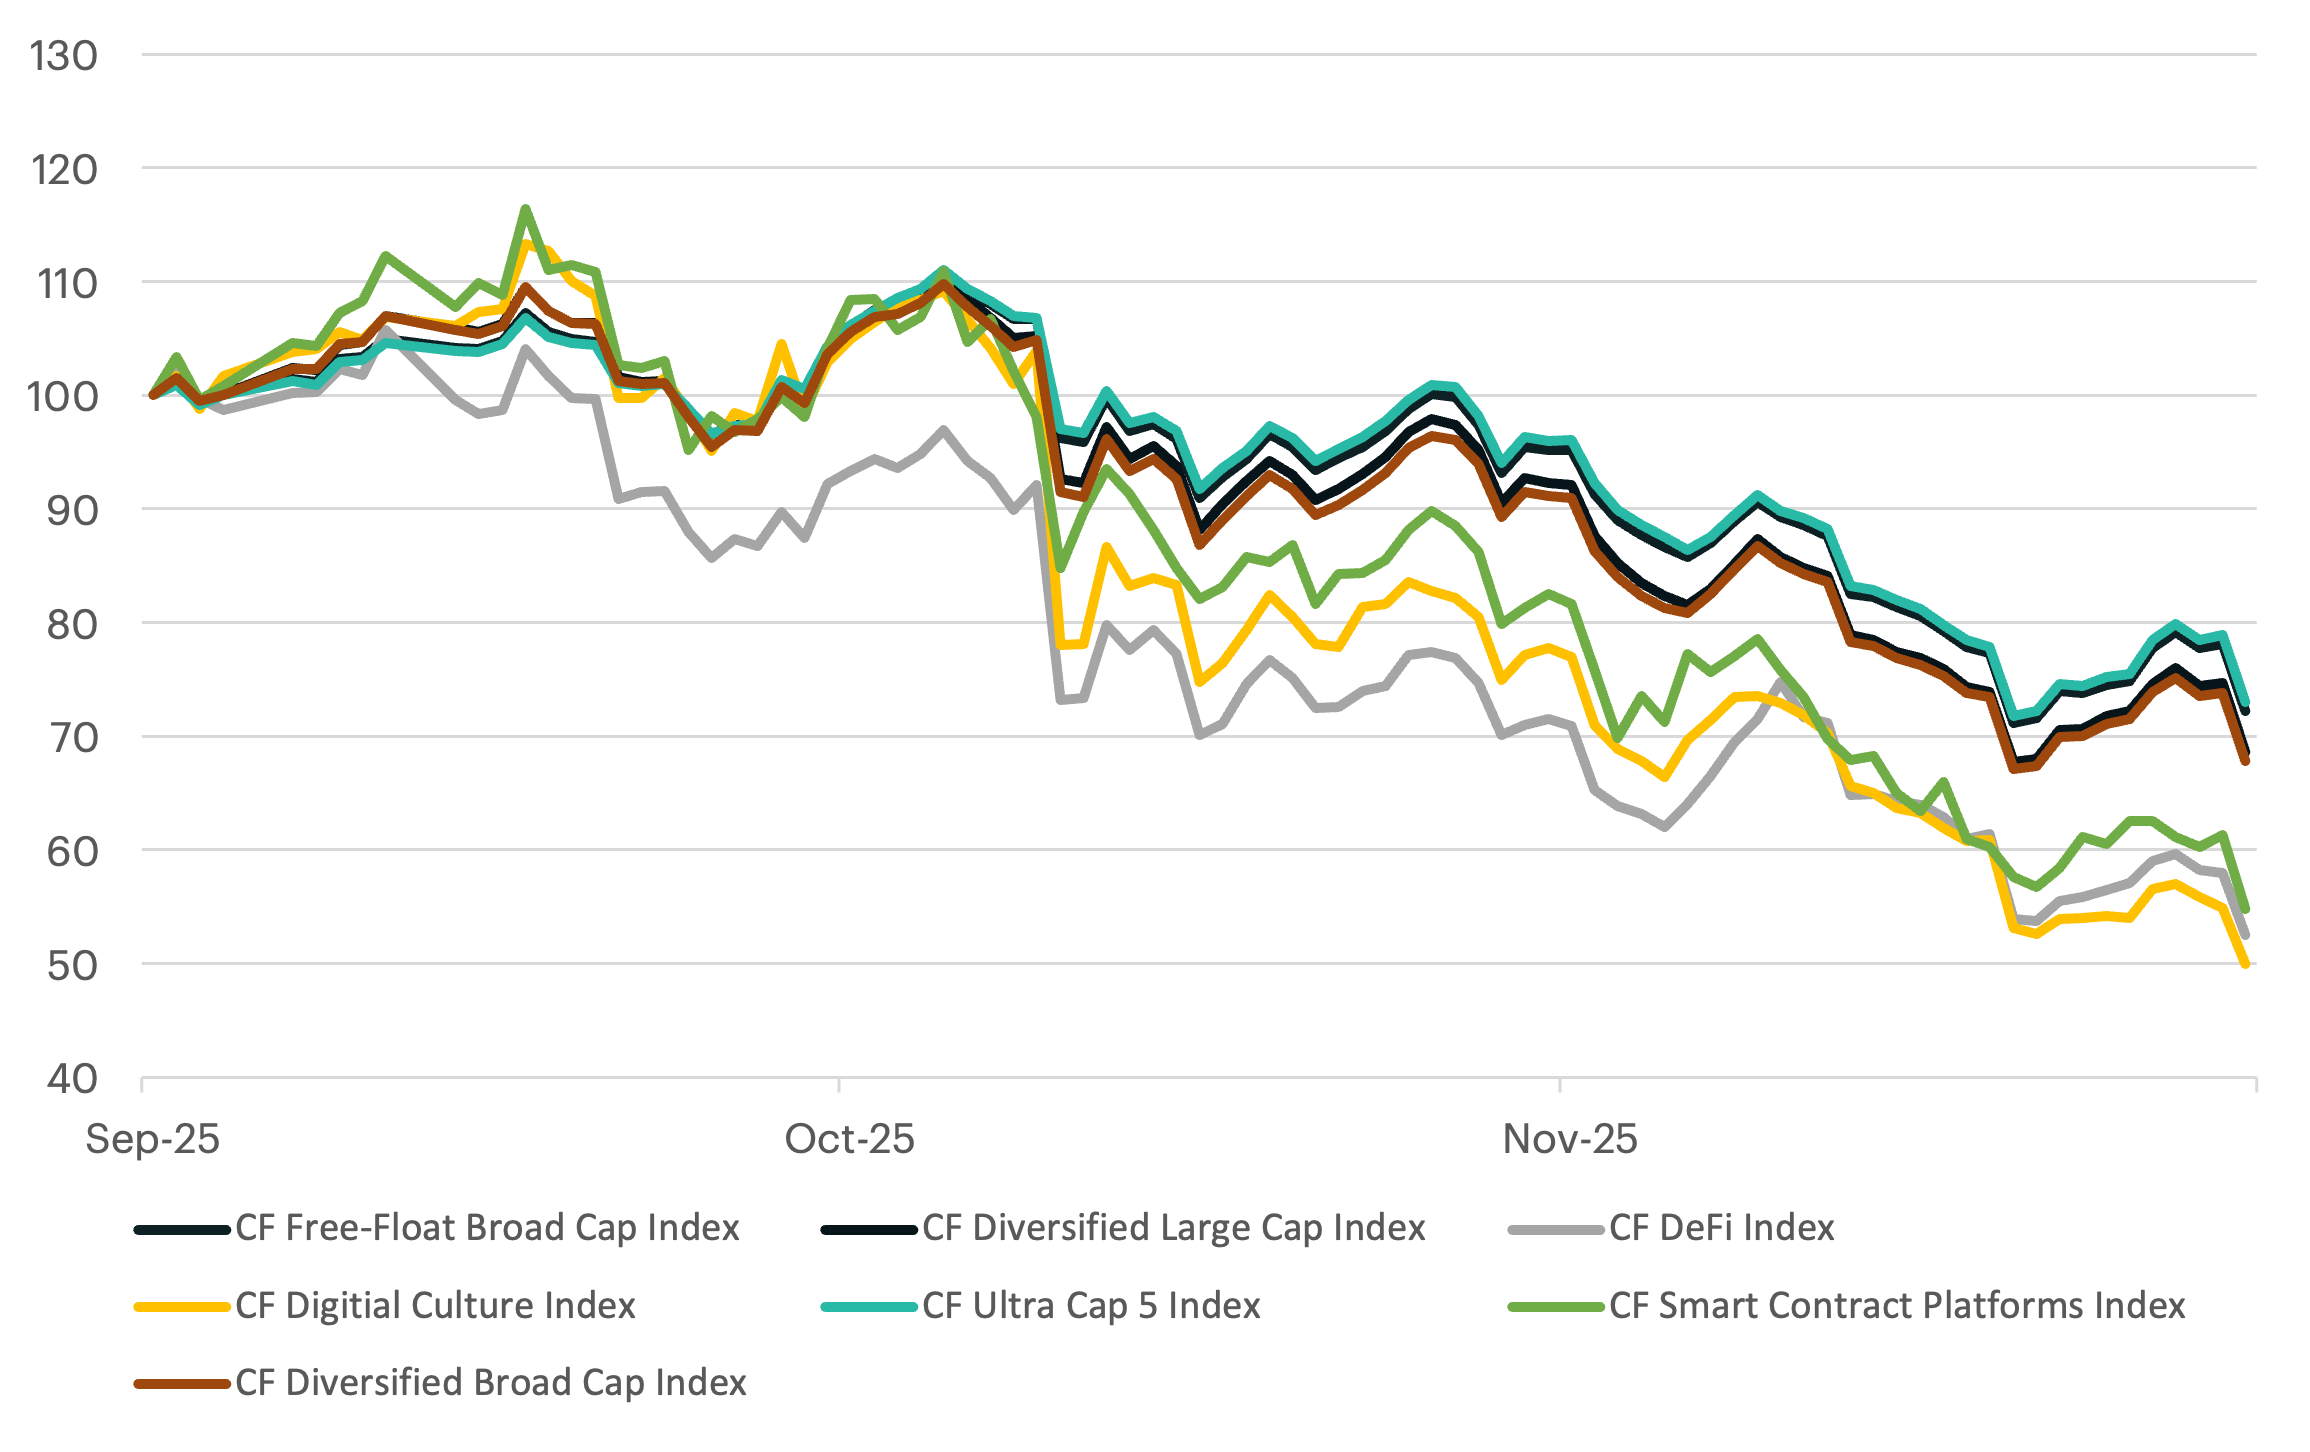
- The CF Cryptocurrency Ultra Cap 5 Index fell 26.99%, and the CF Free Float Broad Cap Index declined 27.76%, reflecting Bitcoin and Ether’s relative resilience. More diversified exposures saw steeper losses: the CF Diversified Large Cap and CF Diversified Broad Cap indices declined 31.37% and 32.19%, respectively, as smaller caps struggled to absorb outflows.
- The CF Web 3.0 Smart Contract Platforms Index fell 45.43%, the CF DeFi Composite Index 47.44%, and the CF Digital Culture Composite Index 50.04%, highlighting how scaling solutions, DeFi protocols, and culture tokens bore the brunt of the liquidation-driven sell-off.
- The free-float broad cap index, dominated by mega-caps, outperformed its diversified counterpart, while the share of tokens trading above their 200-day moving average collapsed to single digits. At the same time, correlations between digital assets and major equity benchmarks rose toward the 0.5 range, reinforcing crypto’s increasingly equity-like risk profile even as it maintained low correlations with bonds, currencies, and commodities.
Normalized Index Performance
Defensive Rotation Narrows Market Breadth
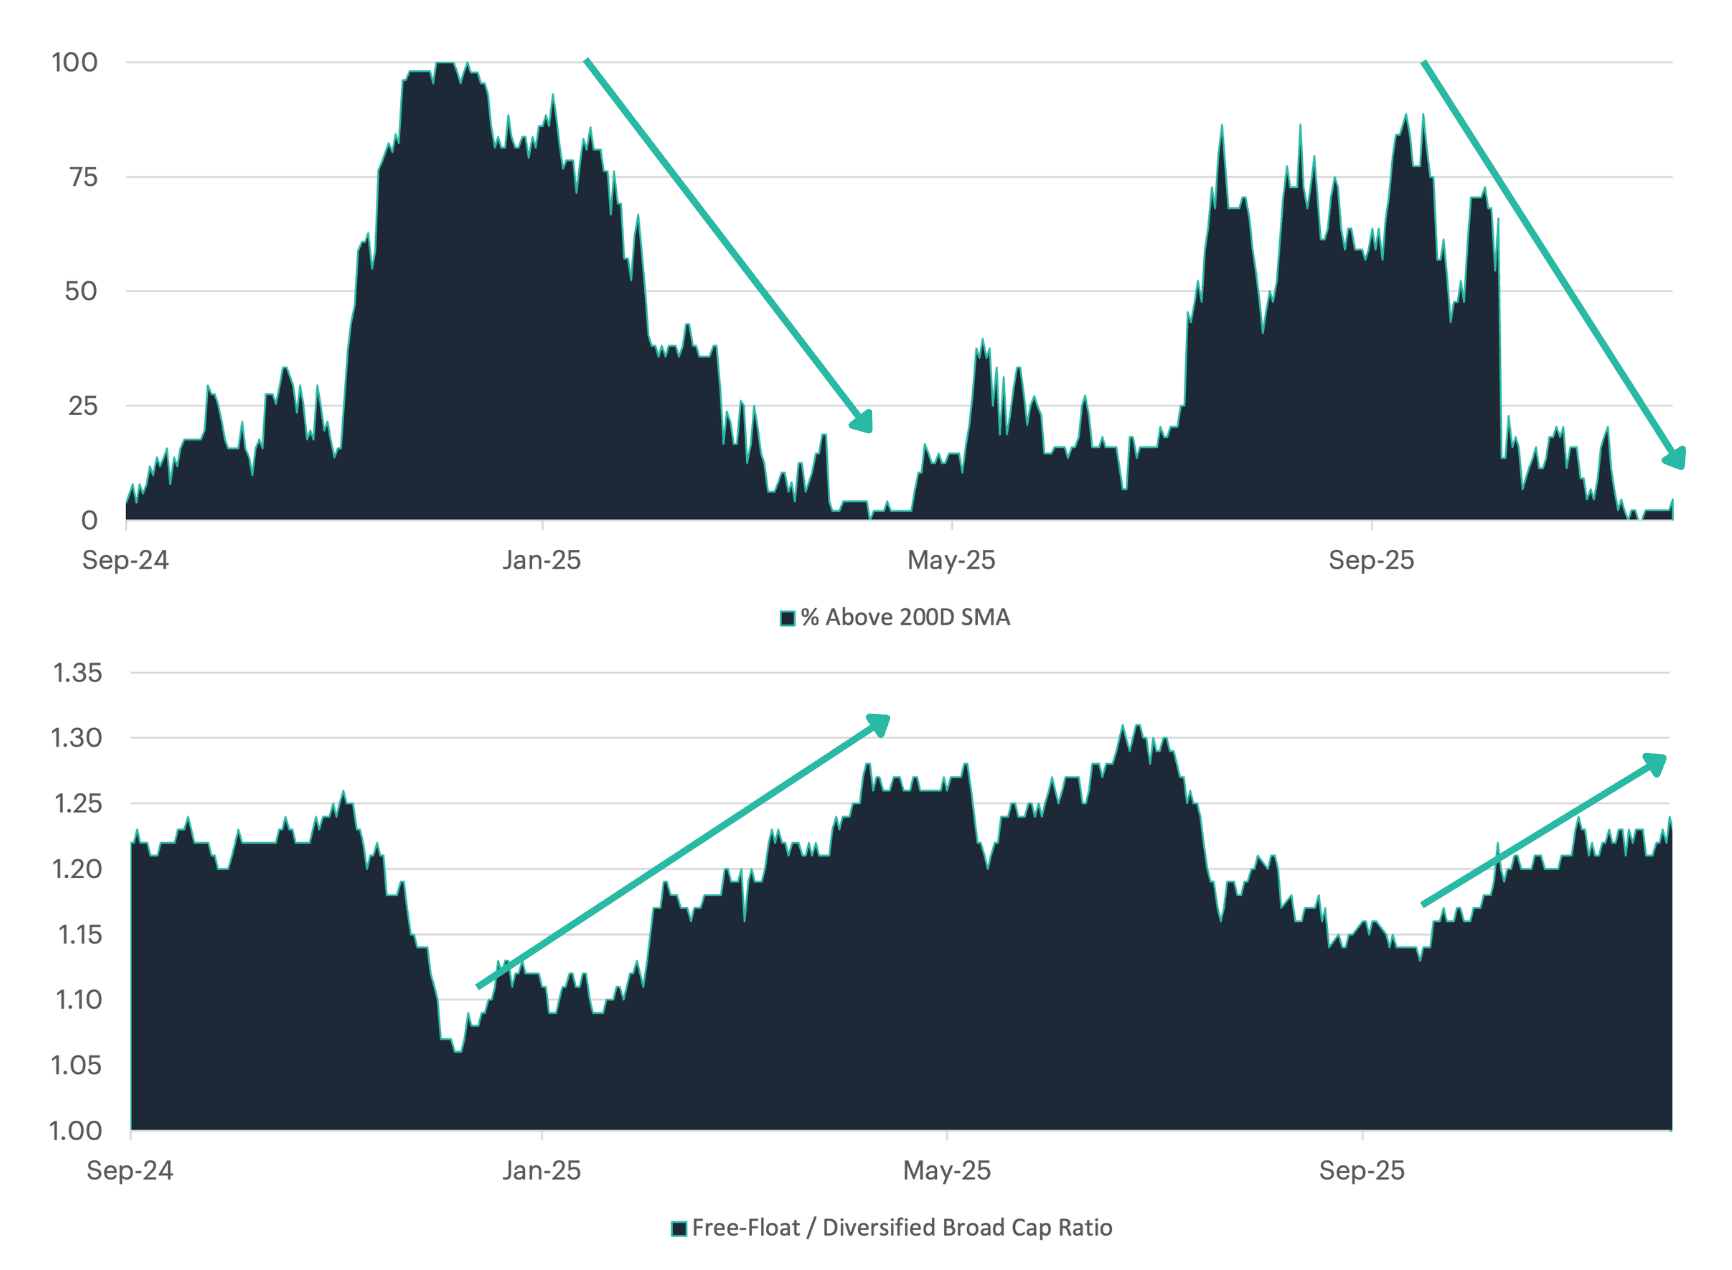
The degree to which Bitcoin and Ether outperform mid- and smaller-cap tokens during drawdowns serves as a reliable barometer for market risk sentiment. The CF Free-Float Index captures this mega-cap exposure, while the Diversified Broad Cap methodology spreads weight more evenly across the market-cap spectrum. As shown in the lower panel, the performance ratio between these benchmarks has historically spiked during risk-off episodes, most notably during April's trade-war-driven selloff following "Liberation Day" tariff announcements. The current period mirrors that dynamic: the ratio has risen back toward recent highs, confirming that mega-cap assets have once again declined less than broader altcoin exposure.
This defensive positioning is corroborated by market breadth in the upper panel. The percentage of tokens trading above their 200-day moving average, which approached 90% during peak risk appetite earlier in 2024, collapsed to single digits by year-end and remains suppressed. The simultaneous rise in the free-float ratio and deterioration in breadth confirms the recent environment has been characterized by concentration rather than participation. Leadership is confined to the most liquid assets, while the vast majority of tokens have broken below long-term trend support. For sustainable broadening, where diversified exposure outperforms and breadth expands, market conditions would need to stabilize, with easing macro uncertainty and returning risk appetite allowing capital to rotate back down the quality curve.
Institutional Divergence Emerges
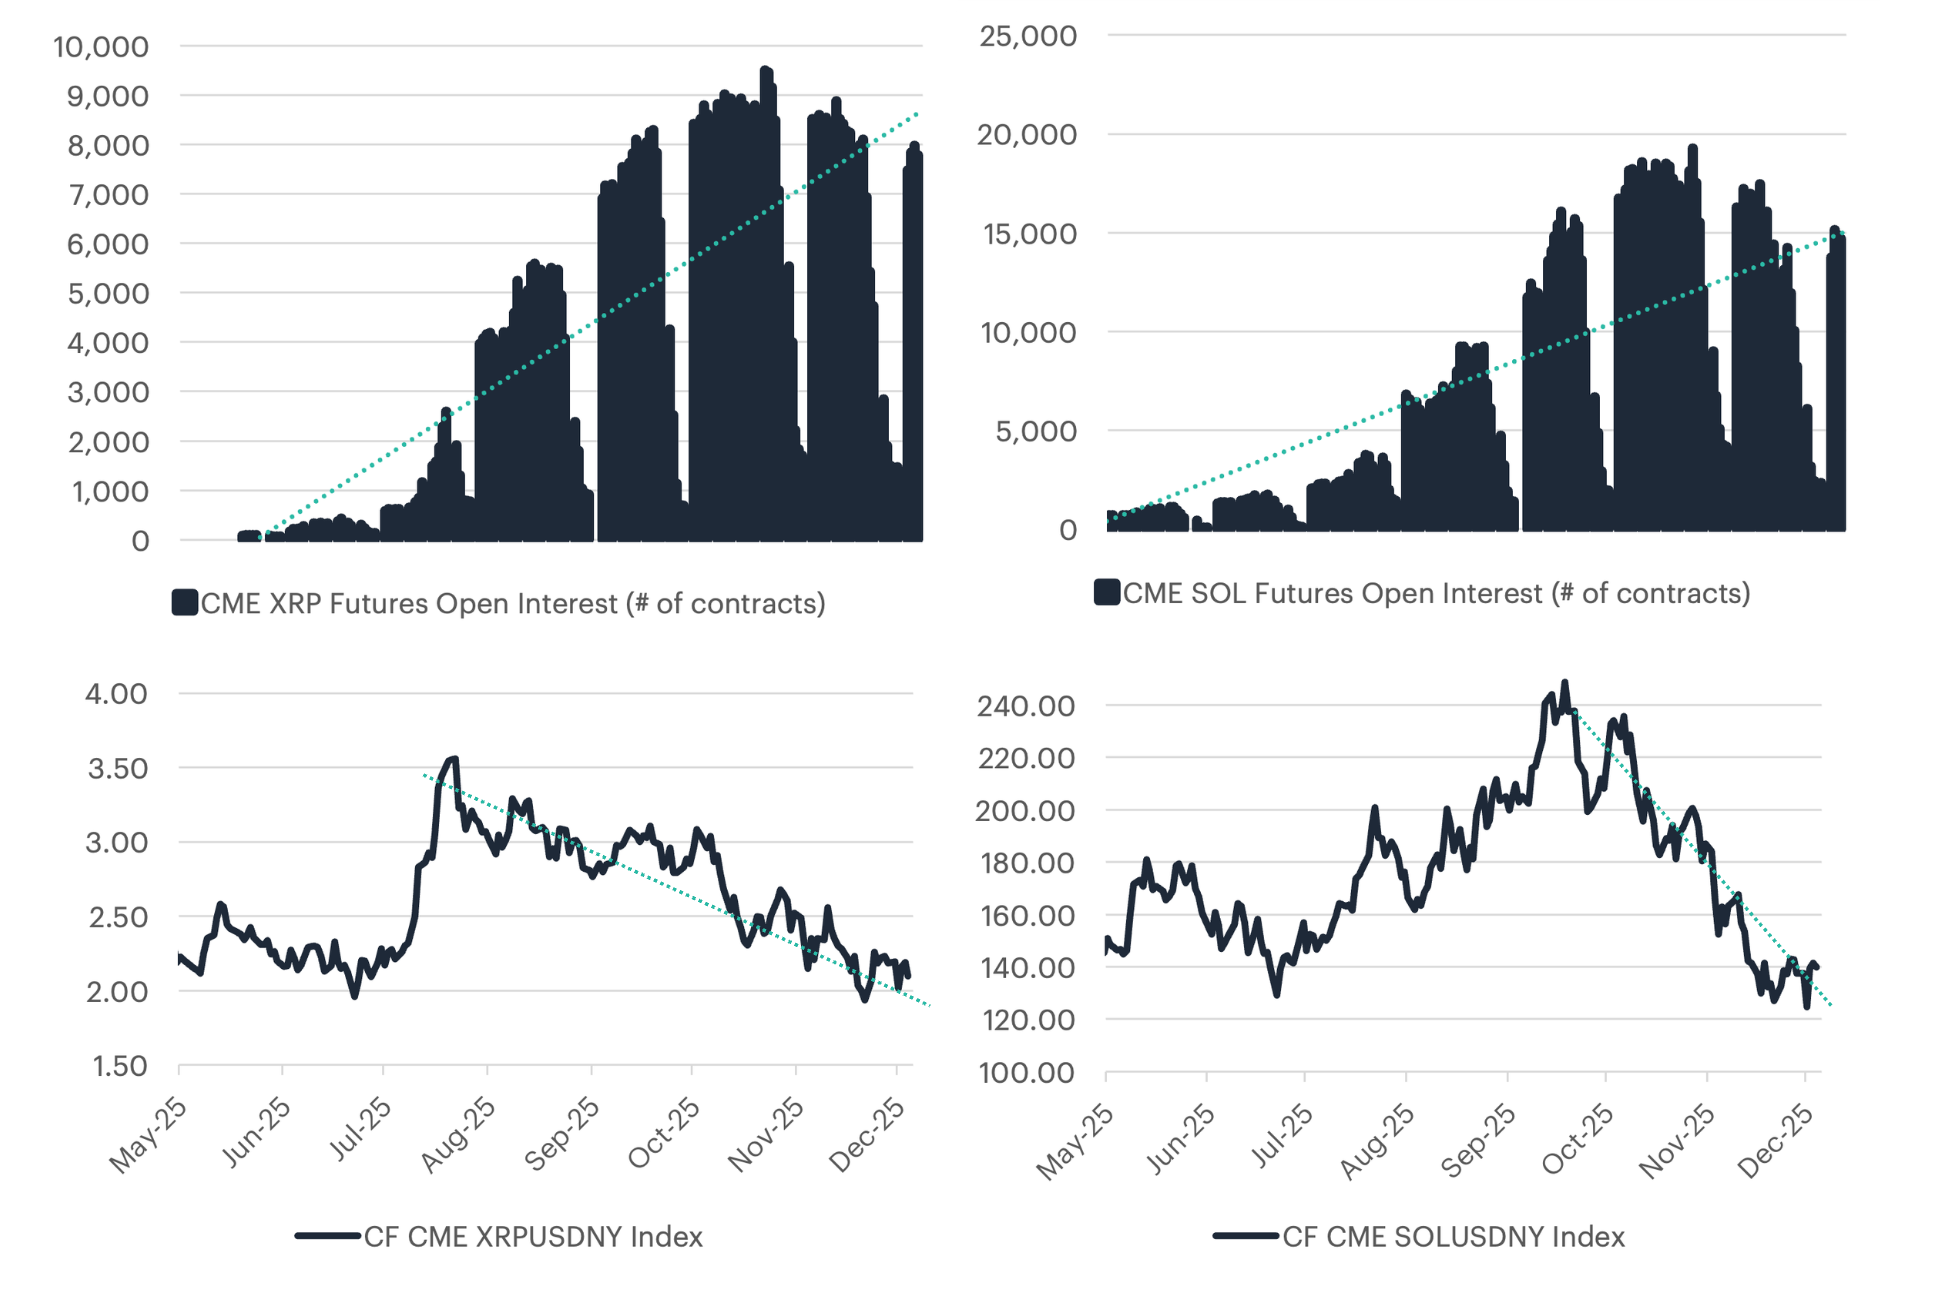
The CME Group’s expansion beyond Bitcoin and Ethereum regulated futures, with Solana futures launching on March 17 and XRP futures following on May 19, has been a pivotal development for institutional access. With nearly all CF Ultra Cap 5 Index constituents now supported by regulated futures, the market has gained a deeper toolkit for hedging, cross-asset spreads, and more complex arbitrage structures. The charts highlight a clear institutional divergence over the recent rebalance window. XRP spot prices sank roughly 43 percent and Solana fell 42 percent amid broad risk-off flows, yet futures open interest moved in the opposite direction. XRP futures positioning remained elevated even as the underlying weakened, and SOL open interest climbed from about 5,000 contracts to peaks near 20,000.
This widening disconnect between spot performance and derivatives activity points to increasingly advanced positioning. Basis trades, relative-value structures, and hedging strategies appear to be absorbing more of the flows as professional capital leans into regulated venues. Rather than reflecting retail capitulation, the behavior resembles the early stages of structural maturation.
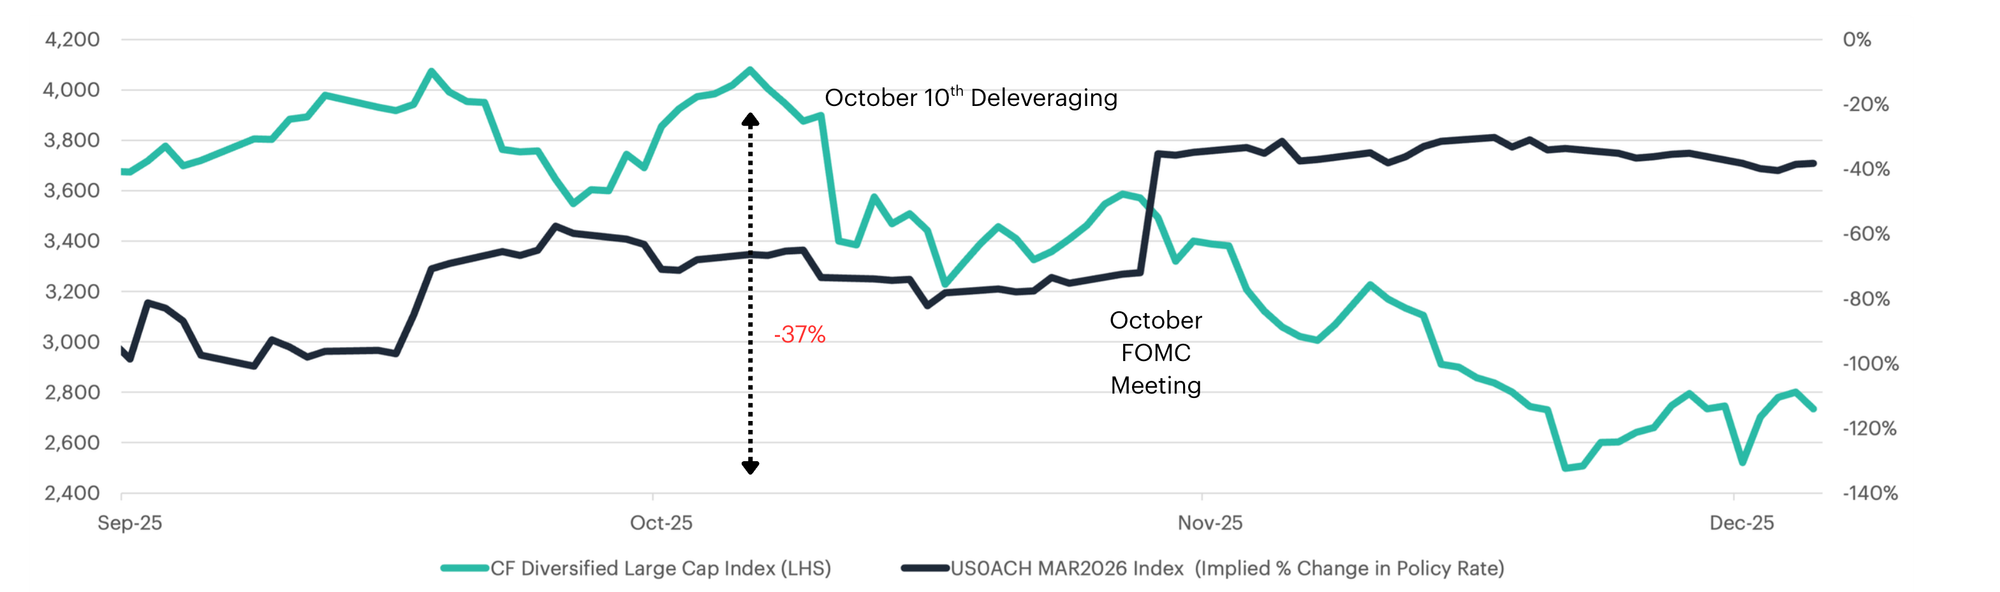
Fed Repricing Puts Large-Caps into Correction
The sharp repricing of rate-cut expectations following the October FOMC meeting has driven a deep deterioration in risk sentiment, pushing the CF Diversified Large Cap Index down roughly 37%, firmly within what we define as “correction” territory for crypto (a 20–45% pullback, the volatility-adjusted analogue to the 10–20% equity correction band in U.S. large caps). As futures markets steadily priced out the aggressive easing path that investors had anticipated for 2026, the policy-rate curve moved higher and the macro backdrop for long-duration assets deteriorated. This shift came on the heels of the October 10 liquidation event, when tariff uncertainty and a broad de-risking across global markets forced widespread deleveraging in crypto. The chart shows that, while implied policy rates grind steadily less dovish, large-cap digital assets transition from a volatile consolidation into a sustained downtrend. Higher expected real rates compress valuations, reduce the attractiveness of speculative growth exposures and encourage a rotation back into cash and short-duration instruments. Absent clearer evidence of disinflation any rebounds in large caps are likely to be tactical; however, with rate cuts now largely priced out, a sequence of benign data that delivers further disinflation without a growth scare could create meaningful upside alpha as markets scramble to reprice a renewed easing path.
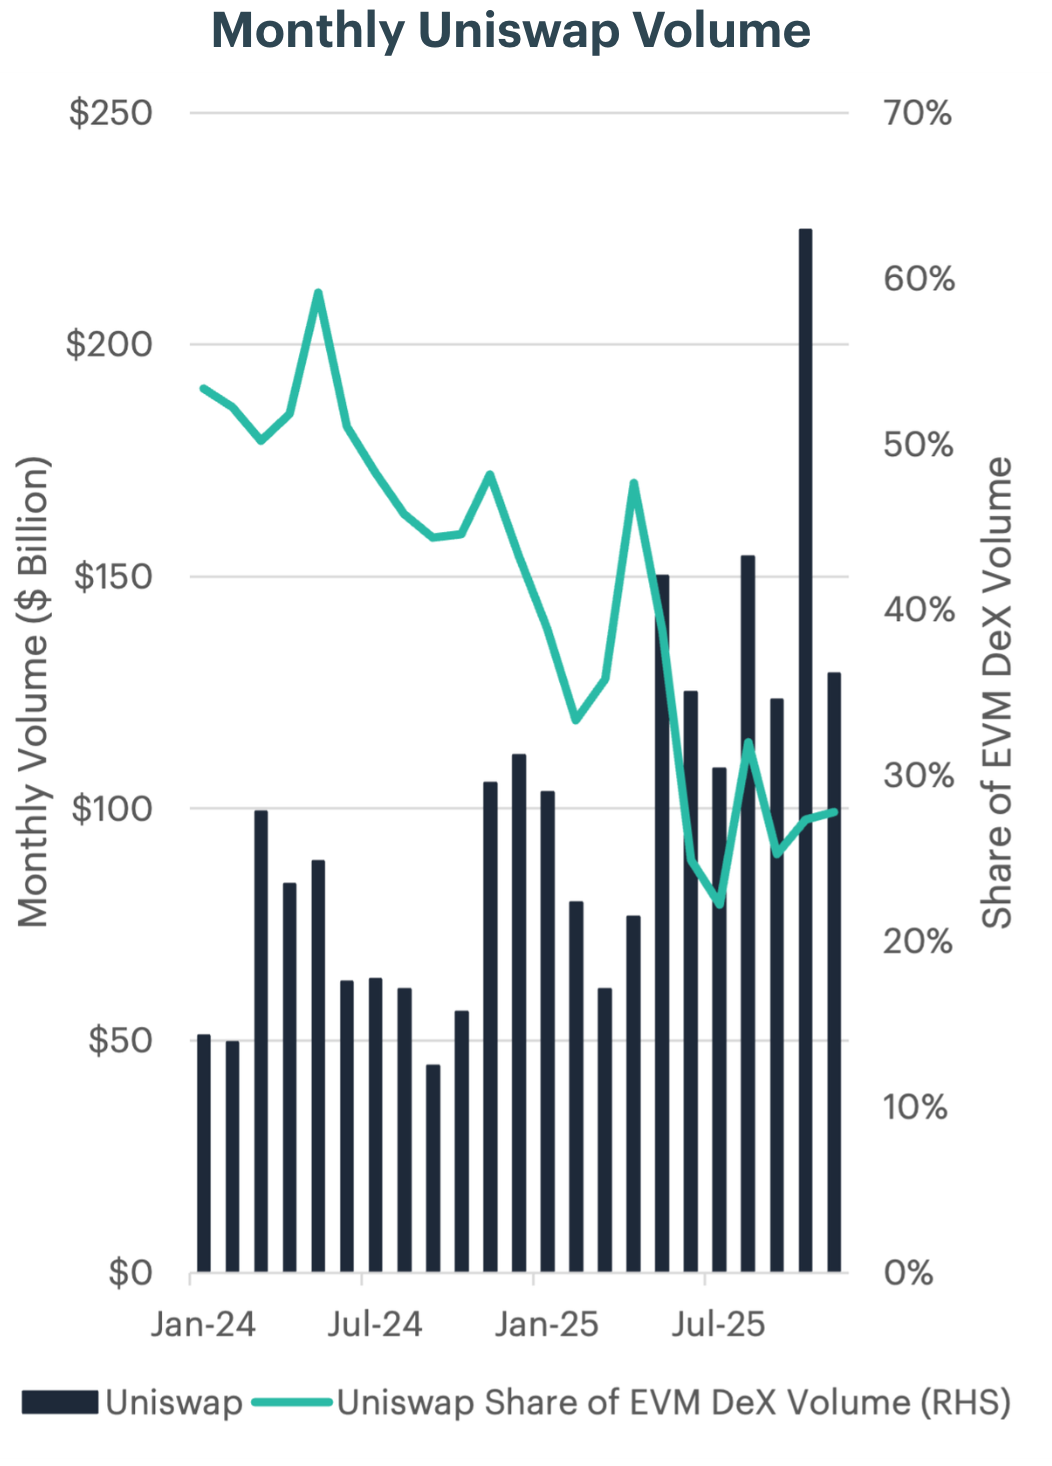
Uniswap Rallies on UNIfication Framework
Uniswap’s recent outperformance has been driven largely by the market’s reassessment of its long-term economics following the proposal for a protocol-level fee switch. To contextualize the potential value creation for token holders, it is useful to frame both the scale of Uniswap’s underlying activity and the structural change in protocol fees. Uniswap processed an average of roughly $73B in monthly trading volume throughout 2024. In 2025, activity accelerated materially, with year-to-date monthly volume averaging approximately $122B, representing a ~65 percent increase. October 2025 marked a cycle high at $225B, more than quadruple early 2024 levels. While Uniswap’s market share has fallen as DEX competition on the EVM has intensified, it still accounts for roughly 30 percent of total volume and has held relatively steady since its market share bottomed out in June 2025.
Historically, Uniswap monetization has occurred primarily through a front-end interface fee charged by Uniswap Labs on certain pairs executed through the official web application. These fees accrue solely to Labs and do not impact the protocol or token economics. Under the new UNIfication framework, Uniswap transitions away from UI-level monetization and activates protocol-level fees across v2, v3, and ultimately v4. These fees are routed on-chain into a unified mechanism that funds UNI buybacks and burns, establishing direct economic linkage between platform activity and UNI supply reduction.
To illustrate the potential impact of this monetization shift on UNI’s tokenomics, we can take the November 2025 volume of $129B and assume a mix of 20% v2, 70% v3, and 10% v4. Under these assumptions, the proposal implies approximately $42M in monthly protocol fees. If fully allocated to buybacks at an illustrative $5 UNI price, the protocol could retire roughly 8.4M UNI in a single month, a level of annualized supply reduction that had not previously been reflected in market valuations.
Following the announcement, UNI experienced a sharp 42 percent price appreciation, rallying from the $7 range to around $10 on significantly elevated trading volumes. The speed and magnitude of the move reflect a broad repricing of UNI’s fundamental value as investors incorporated a sustainable, volume-linked revenue stream into the token’s valuation framework.
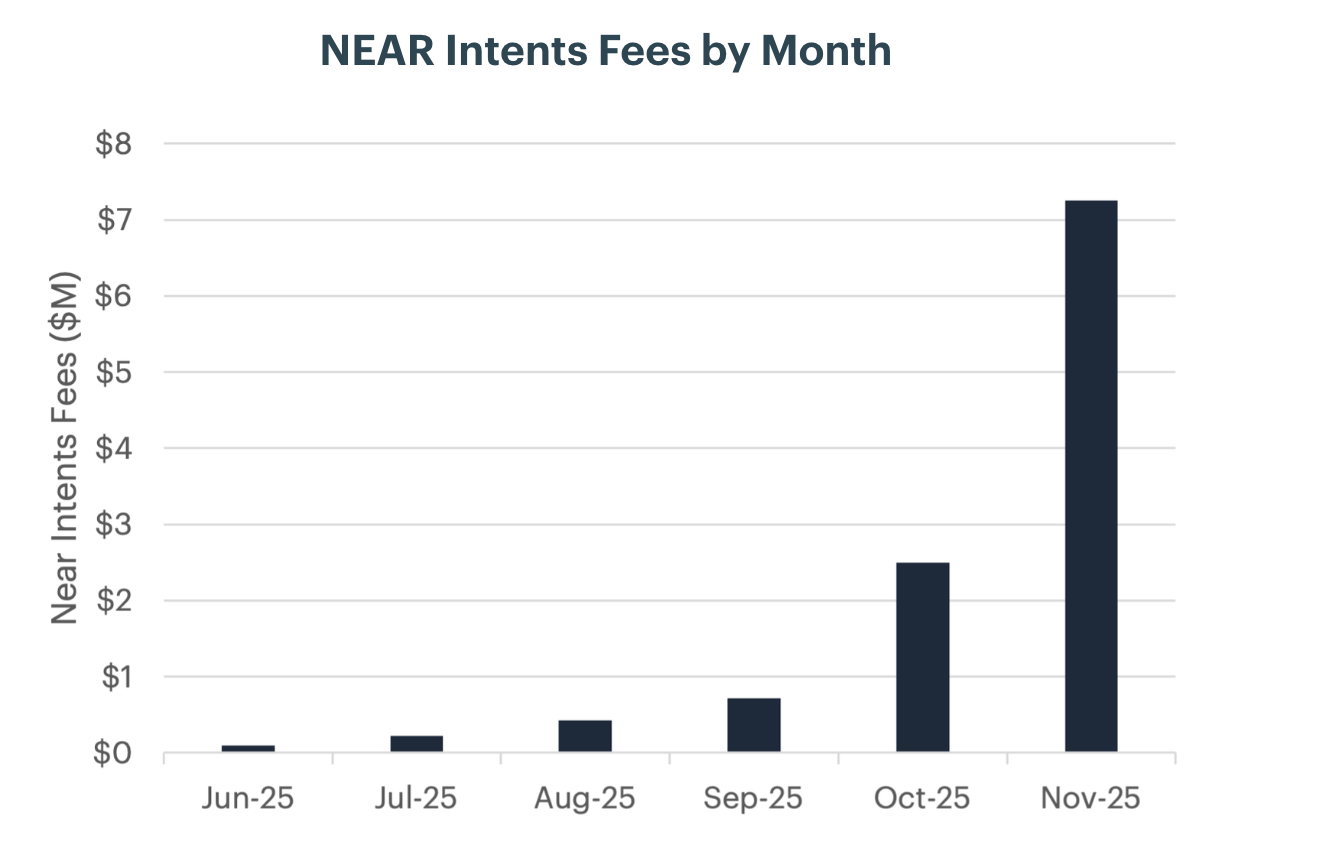
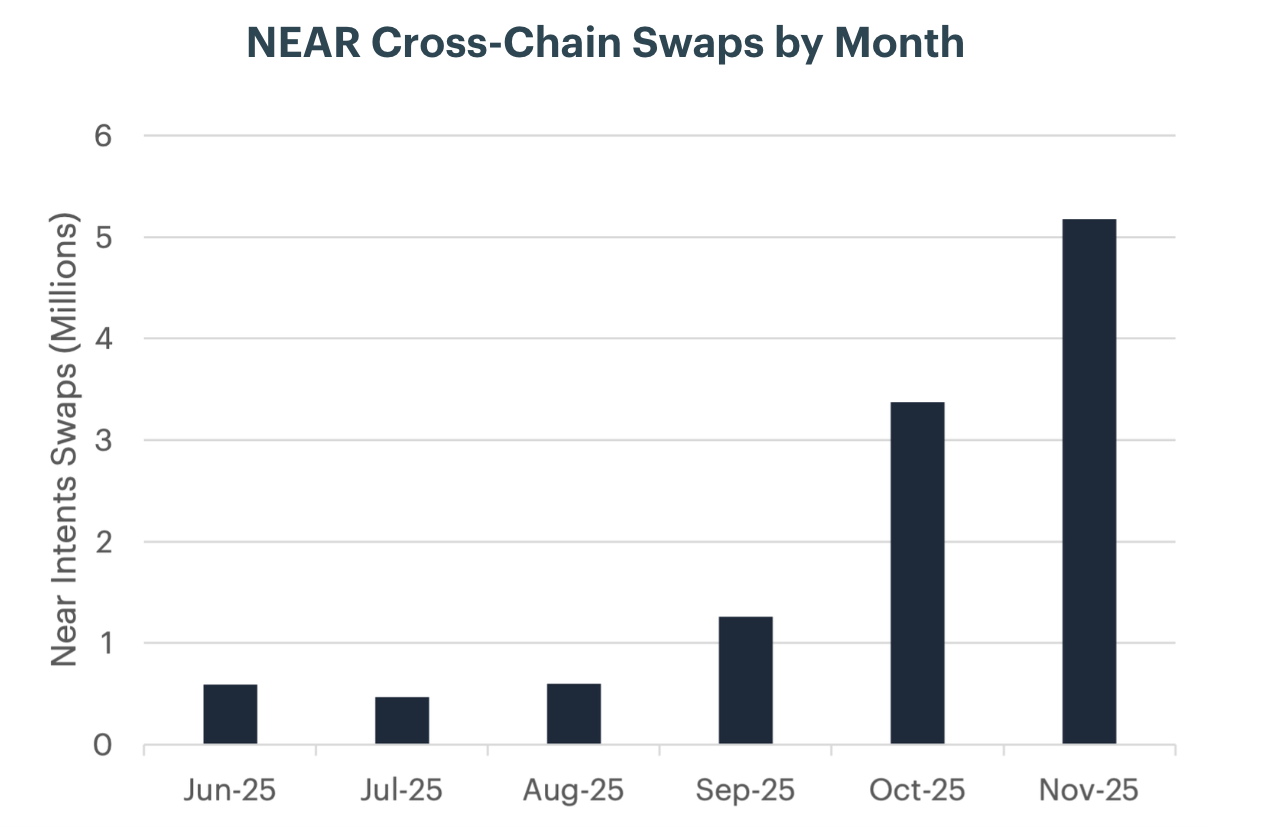
Cross-Chain Swaps Boost NEAR Adoption
Arbitrum’s performance this quarter was underpinned by a steady rebound in its share of Layer-2 revenue, with recent months marking higher lows and a gradual climb back to 18% in August. This recovery in market share reflects strengthening activity across its ecosystem, supported by incentive programs and new DeFi deployments. On a quarterly basis, the improvement is clear: Q2 2025 revenues totaled $2.9M, but in just the first two months of Q3 Arbitrum has already generated $2.5M, putting it firmly on pace to surpass the prior quarter. Importantly, this growth comes alongside consistently high profitability. Arbitrum’s margins have remained above 92%, far outpacing the Layer-2 average of around 79%, underscoring its structural efficiency and cost advantage. The combination of rising on-chain activity and newly launched incentive programs has created strong demand for the ARB token, helping to drive a 32.7% gain during the quarter.
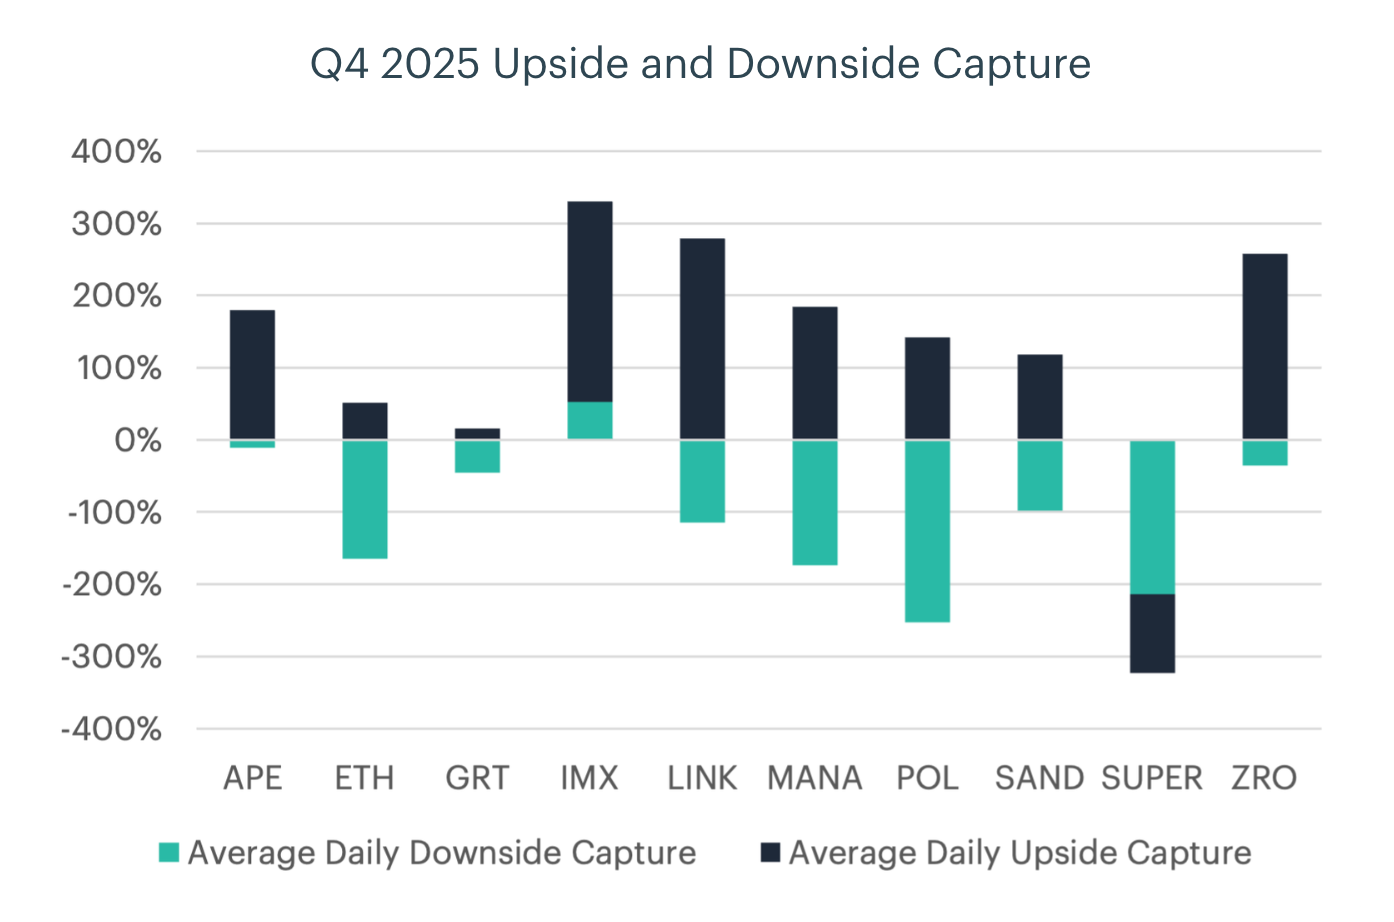
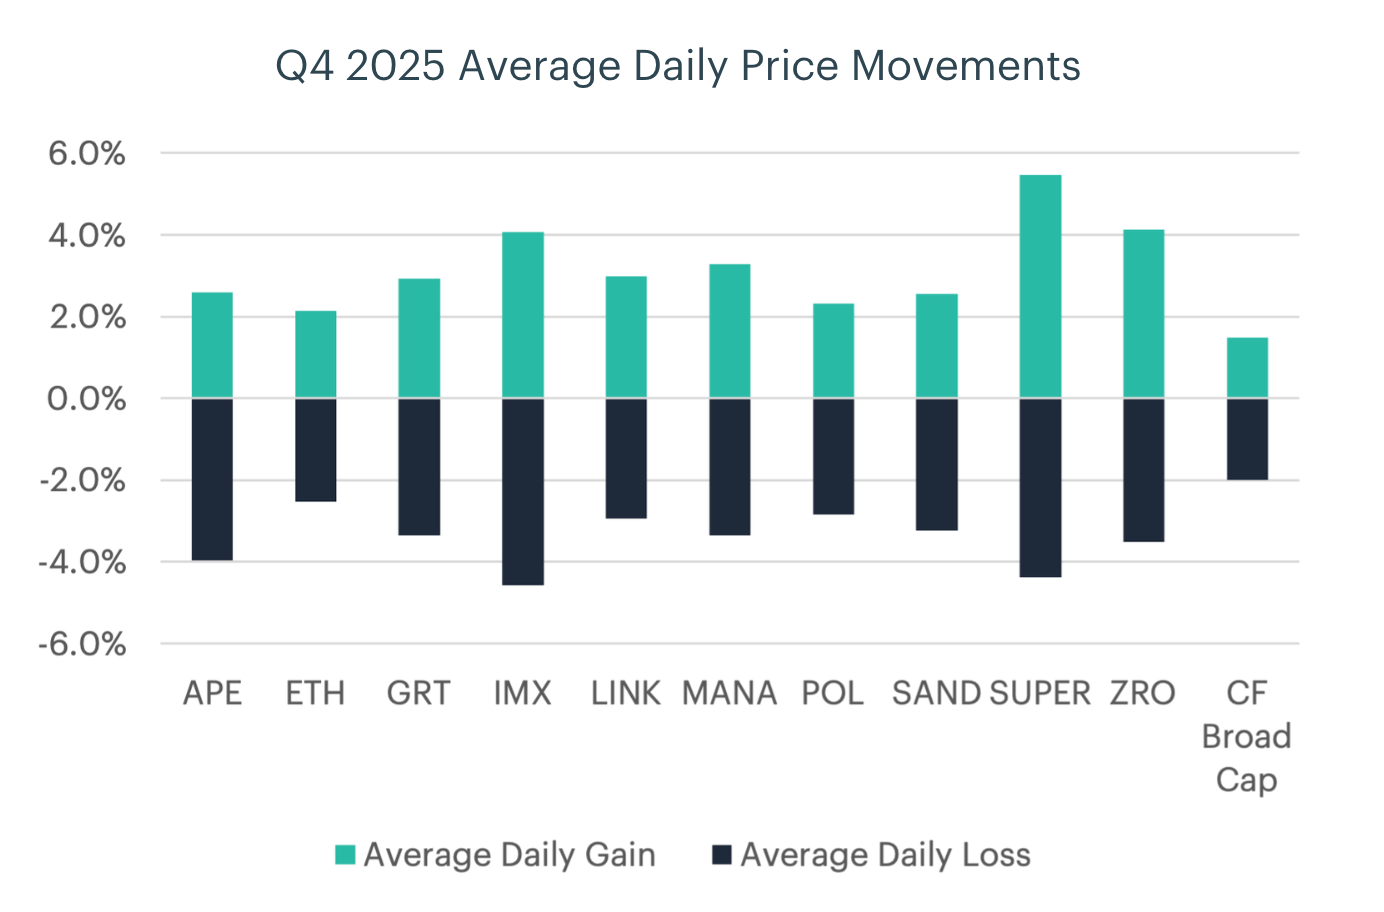
Volatility Drag Undercuts Culture Token Rallies
Performance across digital culture tokens during the period highlights the asymmetric impact of volatility in a market downturn. Upside and downside capture ratios suggest several assets outperformed on positive market days, with many showing upside capture above 100 percent, but these metrics are misleading on their own. High upside capture reflects strong sensitivity to rising markets, yet it does not account for how often or how sharply markets fell. Over the period, the market declined 27.8 percent while the Digital Culture Index fell 50.04 percent, illustrating how persistent negative sessions dominated results.
Average daily returns reinforce this dynamic. Tokens posted higher gains than the market on up days, but losses on down days were far larger, creating significant volatility drag. Assets such as MANA, POL, and SUPER showed extreme downside capture, allowing a small number of deep declines to overwhelm sporadic rallies. In this environment, conditional outperformance on up days could not offset the cumulative effect of repeated, outsized losses.
To read the full report , please click on the respective links below:
Quarterly Attribution Report (PDF Version)
Lastly, our Quarterly Attribution Reports are designed to help investors understand the performance of digital assets through a purpose-centric lens called the CF Digital Asset Classification Structure (CF DACS). To learn more about CF DACS, please utilize our interactive CF DACS Token Explorer.
Contact Us
Have a question or would like to chat? If so, please drop us a line to:
The information contained within is for educational and informational purposes ONLY. It is not intended nor should it be considered an invitation or inducement to buy or sell any of the underlying instruments cited including but not limited to cryptoassets, financial instruments or any instruments that reference any index provided by CF Benchmarks Ltd. This communication is not intended to persuade or incite you to buy or sell security or securities noted within. Any commentary provided is the opinion of the author and should not be considered a personalised recommendation. Please contact your financial adviser or professional before making an investment decision.
Note: Some of the underlying instruments cited within this material may be restricted to certain customer categories in certain jurisdictions.
Changes to the Token Market Price Benchmarks Series - Market Prices – 21 July 2026
The Administrator has confirmed changes to the Token Market Price Family for the period 14 July 2026 to 21 July 2026.

CF Benchmarks
Softer CPI Reprices July Hike Risk & Lifts Digital Assets
Digital assets extended their recovery over the past week as cooler US inflation prints repriced Fed expectations; the bid was broad across the large cap indices, growth factor leadership returned, stablecoin funding repriced lower, and stress stayed isolated in names hit by token-specific news.
Mark Pilipczuk
Notice of the Demising of CF Dai-Dollar Settlement Price and Spot Rate
The Administrator announces that it will demise the CF Dai-Dollar Settlement Price (DAIUSD_RR) and CF Dai-Dollar Spot Rate (DAIUSD_RTI) which are members of the CF Digital Asset Index Family.
CF Benchmarks
By clicking Accept, you consent to CF Benchmarks's use of cookies.
Visit Cookie Settings to learn how CF Benchmarks uses cookies and to adjust your preferences.