
Jul 06, 2026
Non-Programmable Tokens Lead Rebound as Hedging Demand Softens
Weekly Index Highlights, July 6, 2026
Last week's moves were largely macro driven. Digital assets traded heavy into Thursday July 2nd's June employment report and reversed after it: the payrolls print came in well short of consensus, taking the priced-in odds of a July hike out of the front end, and the easier rates path brought risk demand back, visible the same session in spot Bitcoin ETF flows turning positive after a 10-day outflow streak. The relief ran broad: every CF Single Asset Series name, every CF Capitalization Series index, and every CF DACS Sub-Category closed the week higher, with the payments-heavy Non-Programmable block out front on a concrete settlement catalyst and BVXS compressing as hedges were unwound. Our read: the market spent the front half of the week trading hike risk and the back half trading the relief from it.
Market Performance Update
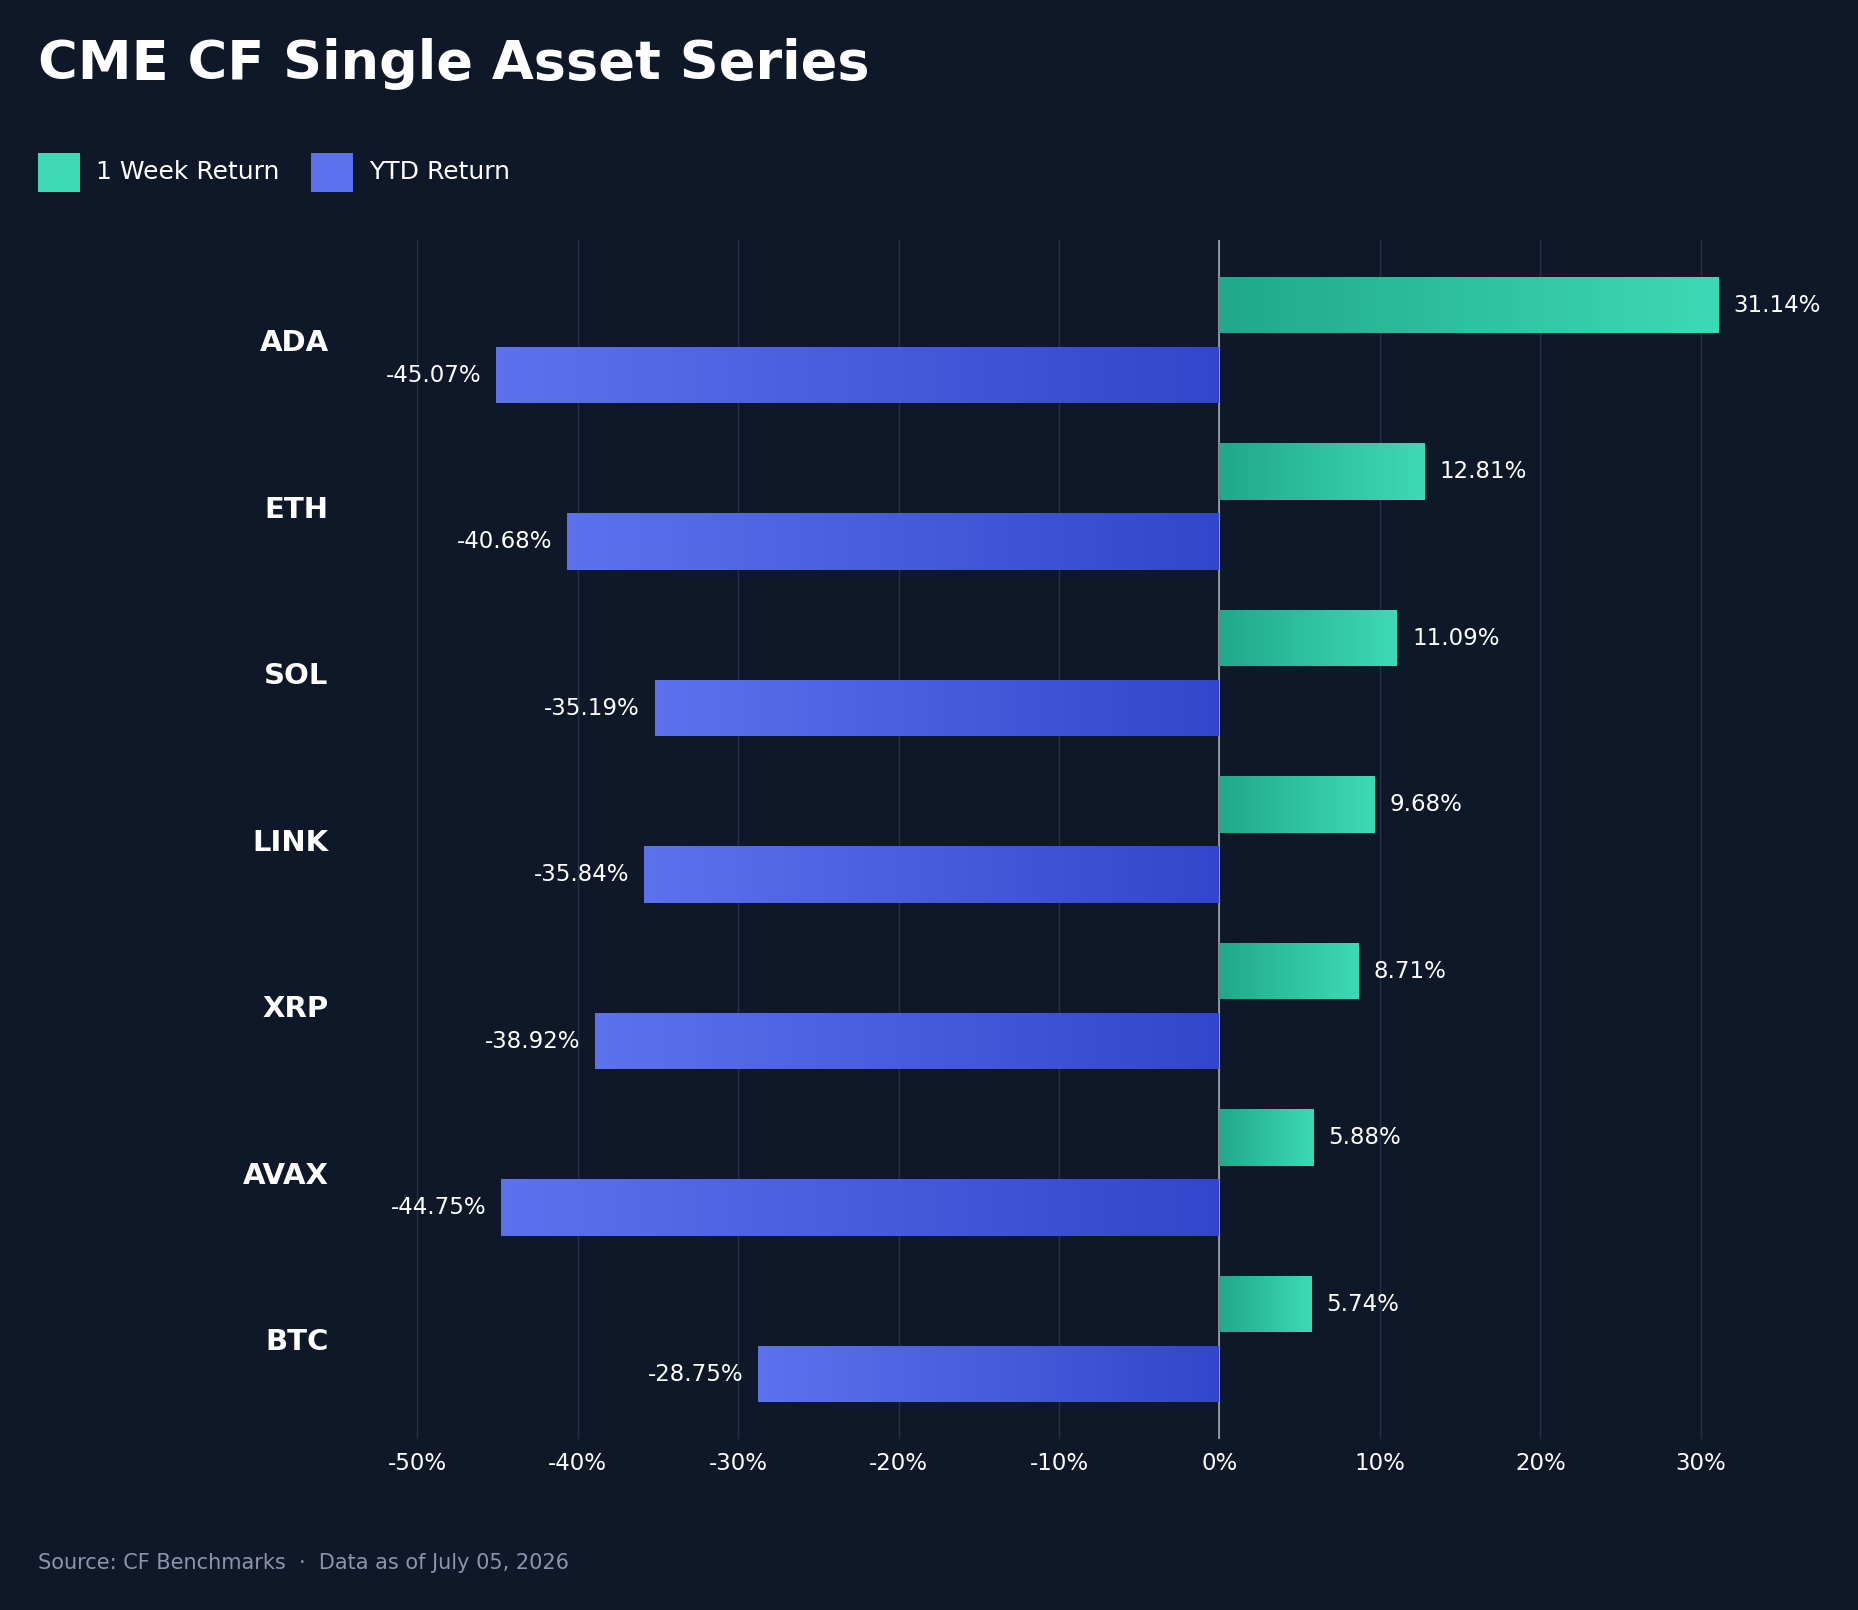
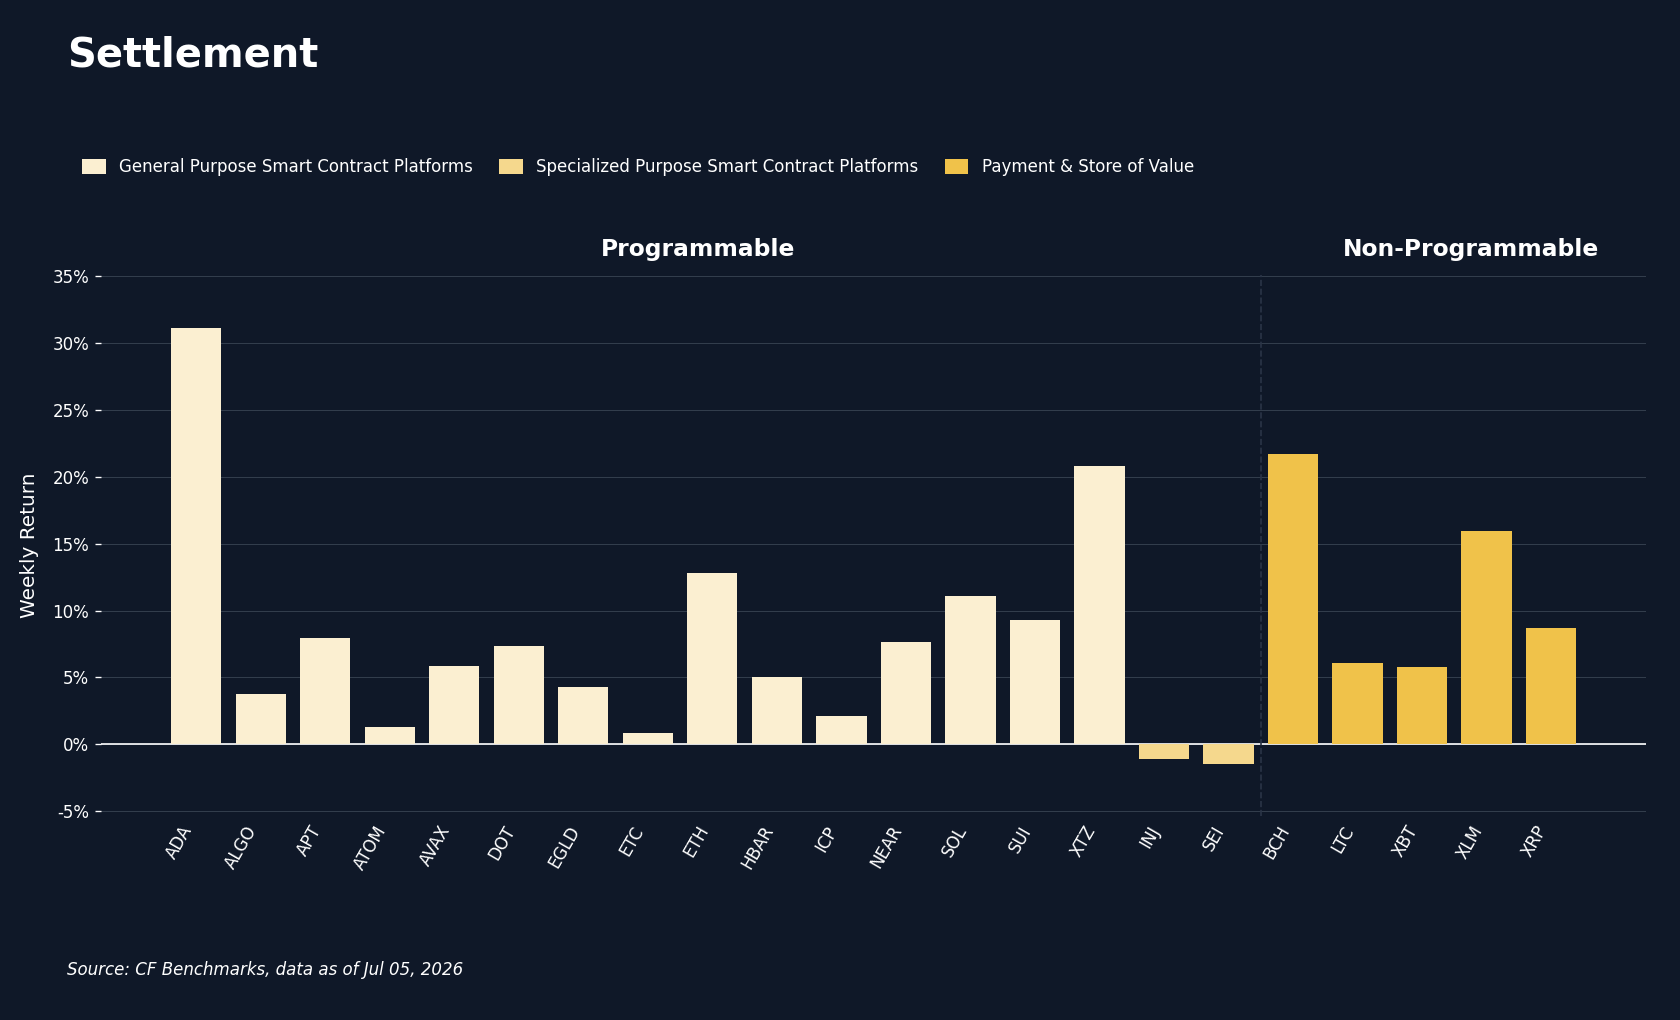
Digital assets rebounded across the CF Single Asset Series in the June 29th to July 5th window, recovering much of the drawdown that had taken Bitcoin (BTC) to a reported low below $58,000 on July 1st. The turn came on Thursday's June employment report, pulled forward by the July 4th holiday: nonfarm payrolls printed 57k against a 115k consensus, with May revised down to 129k and the unemployment rate falling to 4.2% only on a 0.3 pp drop in participation. The mechanism was the rates path. BTC had traded heavy into the print because markets still assigned roughly a one-in-three chance to a July hike after Chair Warsh's Sintra remarks that inflation remains too high; the soft print collapsed those odds, and the asset recovered above $61,000 in the session that followed as the discount rate on long-duration risk fell. Cardano (ADA) led the seven names at +31.1% week-on-week (w/w), leaving it -45.1% year-to-date (YTD); the move was name-specific, a recovery bid from its June 25th low supported by renewed wallet growth and exchange readiness for the van Rossem hard fork on the Leios and RealFi timeline, with no single in-week event behind it. Ether (ETH) gained 12.8% w/w (YTD -40.7%), Solana (SOL) 11.1% (YTD -35.2%), Chainlink (LINK) 9.7% (YTD -35.8%) and XRP 8.7% (YTD -38.9%), while Avalanche (AVAX) added 5.9% (YTD -44.7%) and BTC 5.7% (YTD -28.8%). Excluding ADA's 25.4 percentage point (pp) gap over BTC, the set sat in a 7.1 pp band with the mega-cap anchors at the low end: in a rally driven by cheaper money rather than a BTC-specific story, the higher-beta names simply had more compressed valuation to retrace. Beta, not BTC, did the heavy lifting.
Volatility Analysis
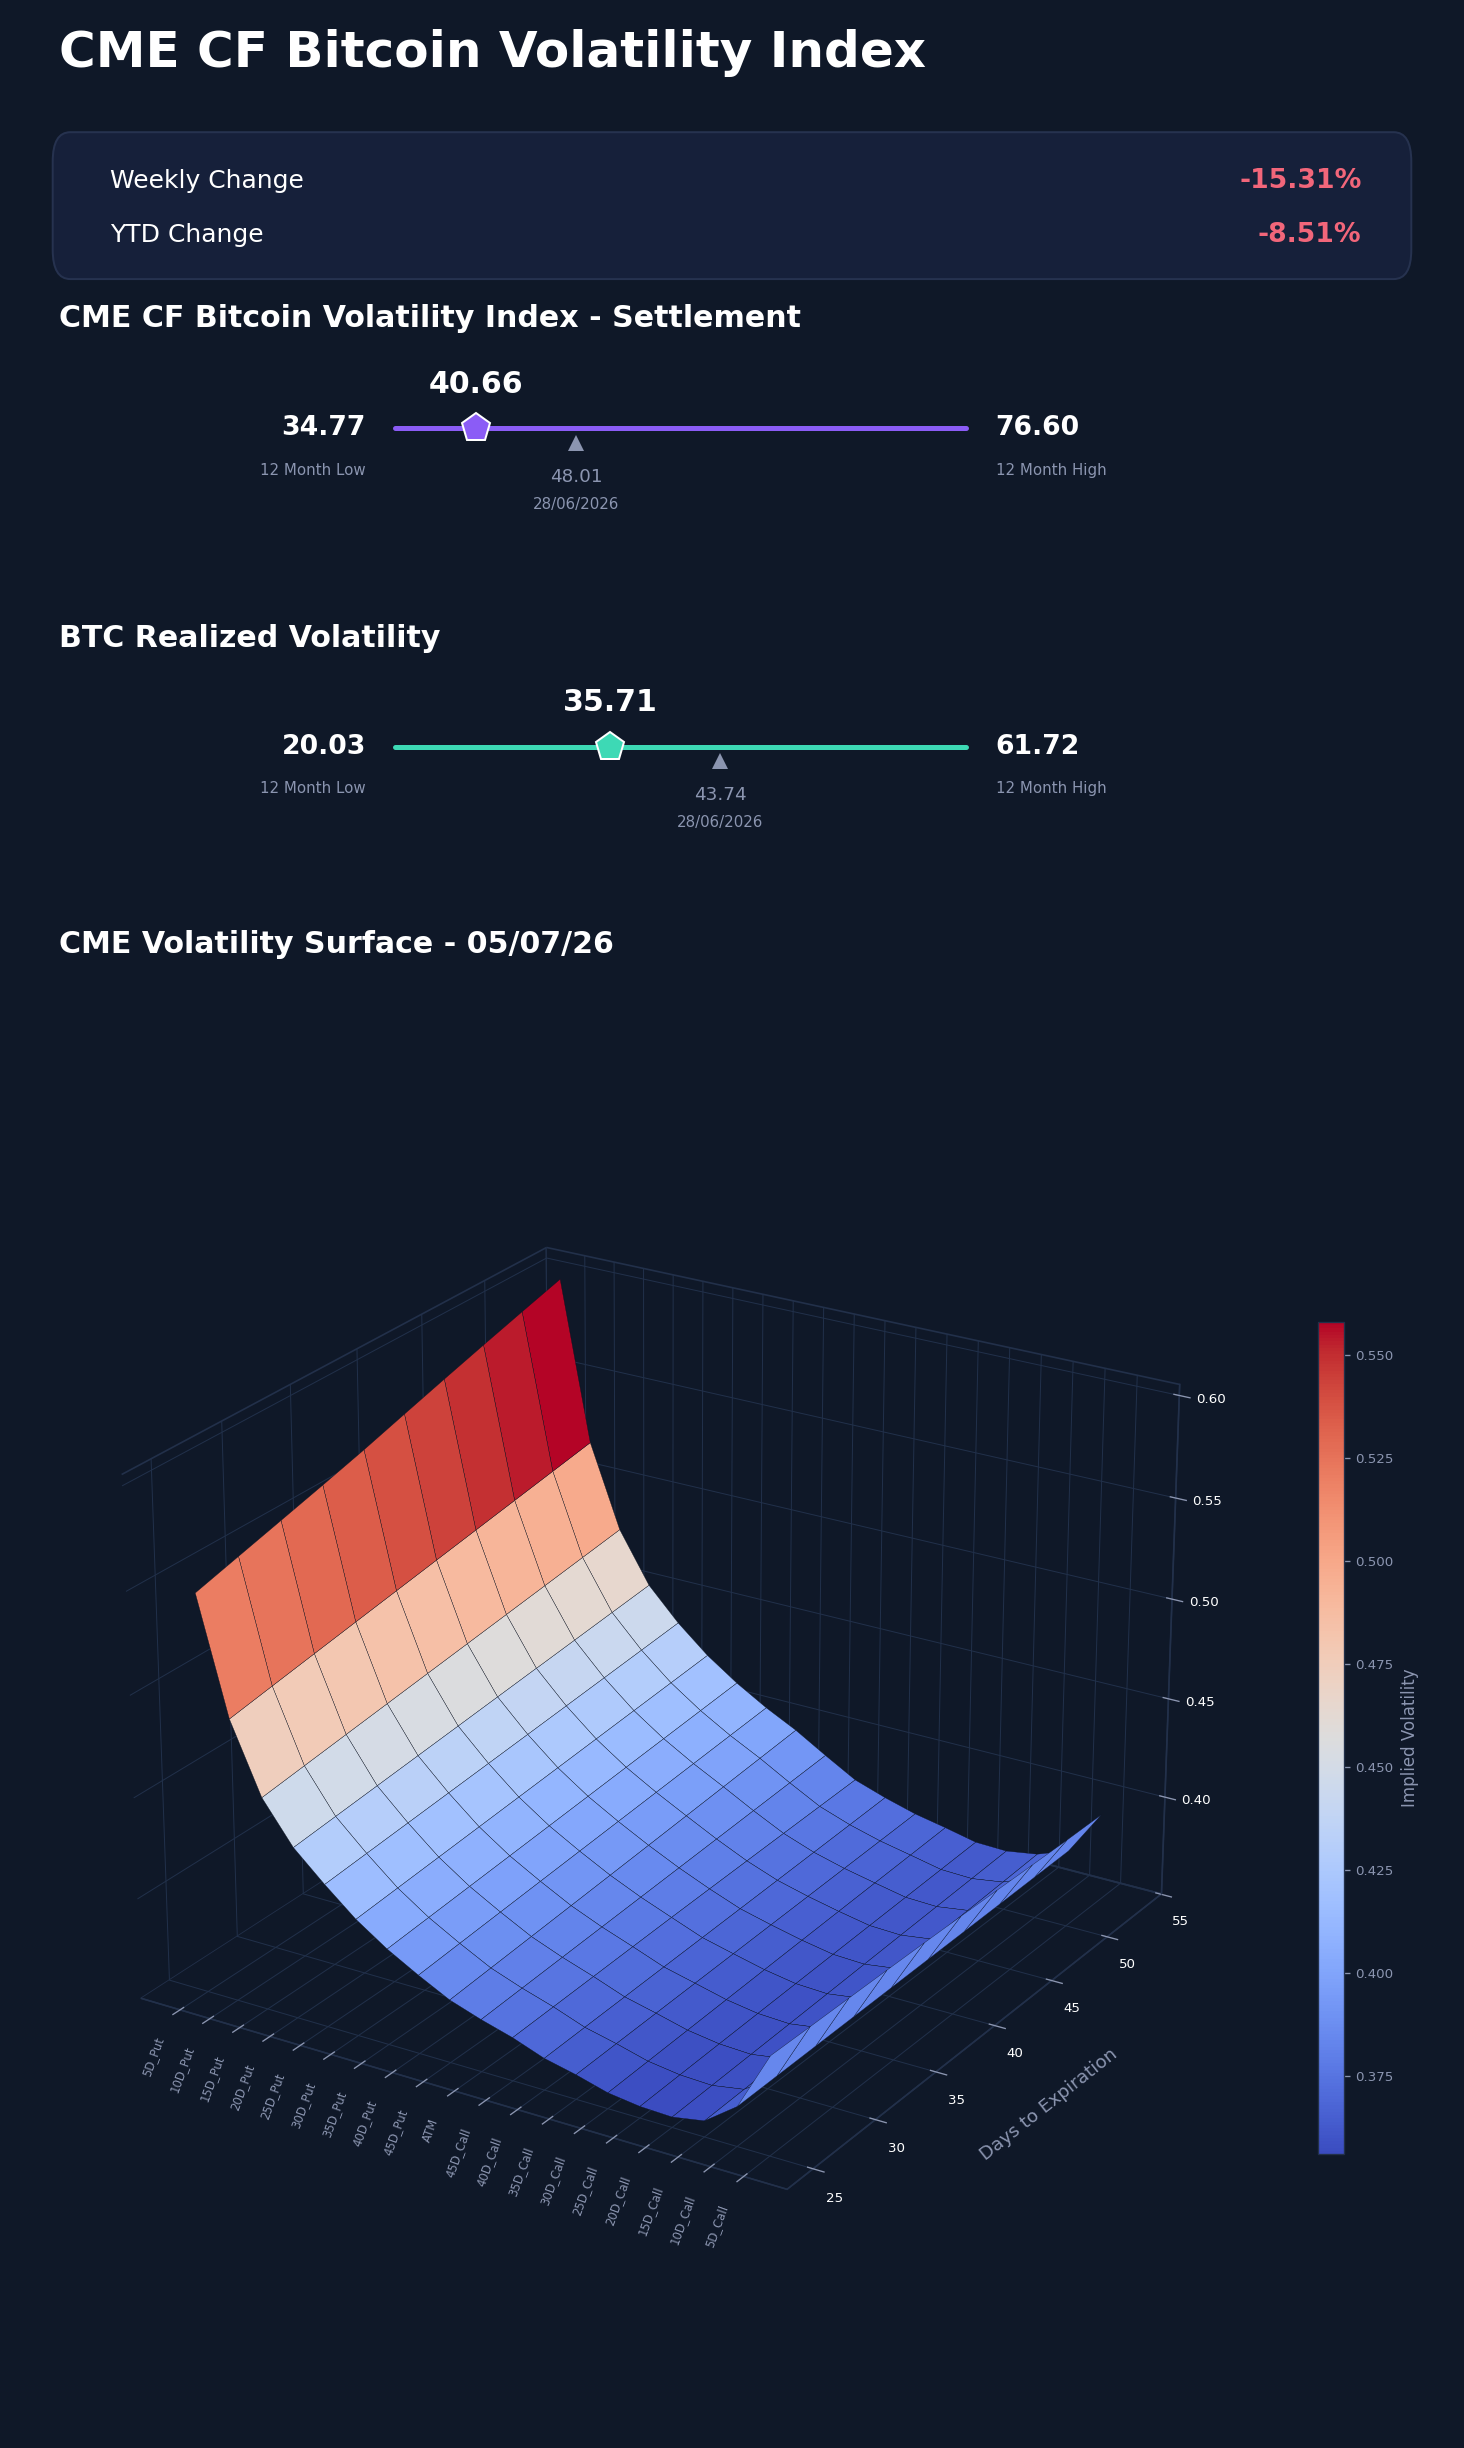
Bitcoin volatility compressed as spot recovered, and the reason is the same event: with the July hike scenario off the table, the tail the options market had been insuring against got smaller. Our CME CF Bitcoin Volatility Index - Settlement (BVXS) finished Sunday July 5th at 40.66, 7.35 vol. points below the prior Sunday's 48.01 close, and realized volatility fell alongside it, from 43.74 at the prior weekly close to 35.71, an -8.04 vol. point decline. Implied ended the week 4.95 vol. points above realized, against a 4.27 point premium a week earlier, so options markets held their forward premium even as both legs moved lower; dealers cheapened protection, they did not abandon it. The intraweek path shows the repricing was event-driven rather than a drift: BVXS printed 46.55, 45.21 and 43.28 through Wednesday July 1st, then stepped down to 39.69 by Friday's shortened session once the payrolls miss had reset the front end of rate expectations. Relative to the trailing 12-month range, BVXS stood 5.89 vol. points above its 34.77 low, realized sat 15.67 points above its 20.03 low, and the index closed 8.51% below its 44.44 start-of-year reference. The configuration reads as an unwind of hedging demand built up during the hike-risk stretch, not a bid for fresh protection.
Market Cap Index Performance
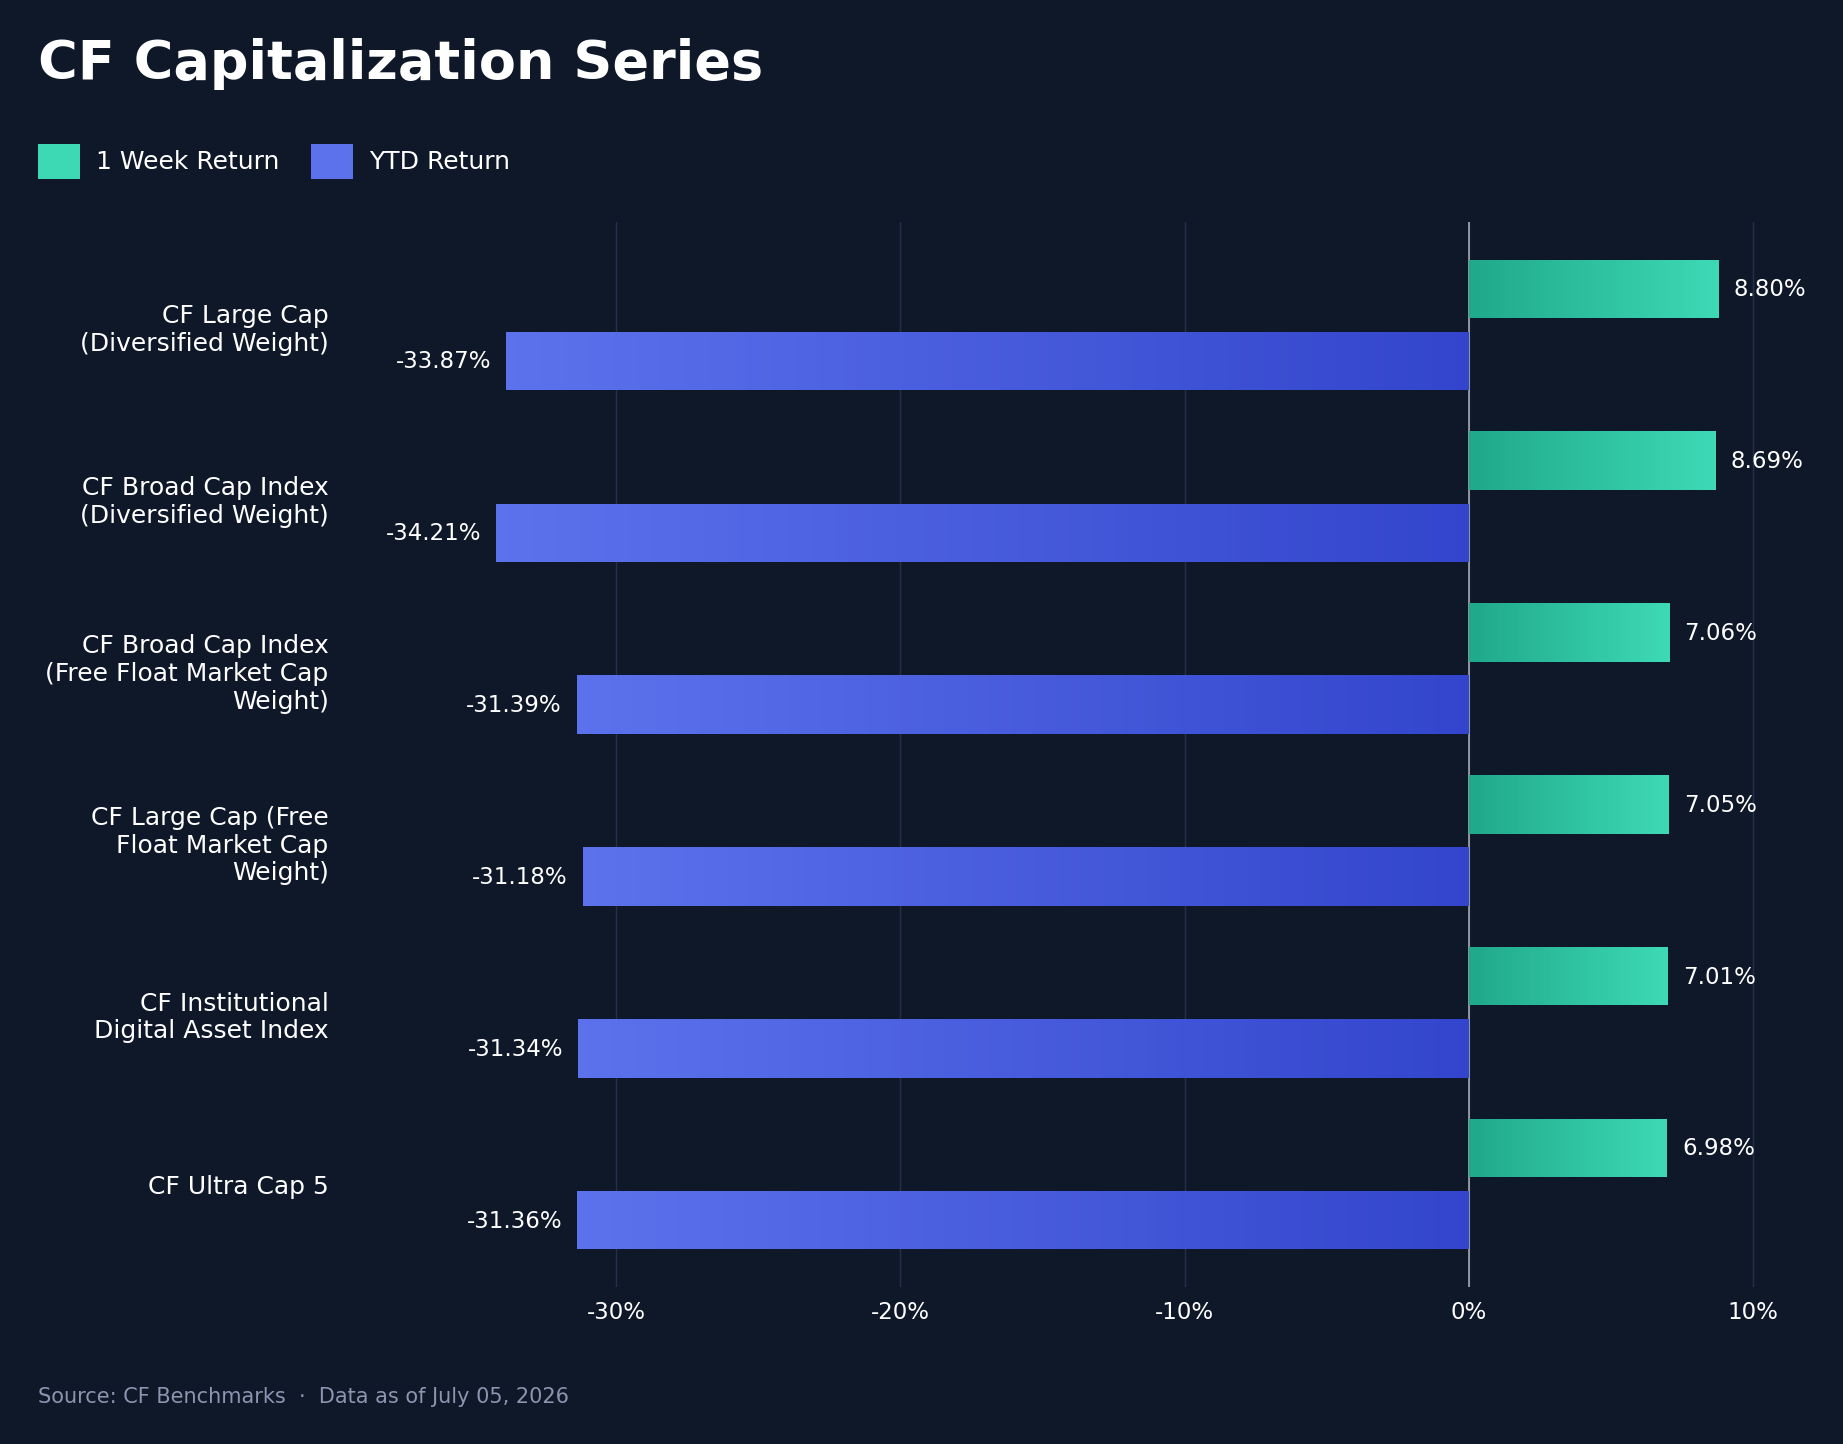
The relief bid hit the whole market rather than rotating within it: all six CF Capitalization Series indices closed higher, and the move coincided with spot Bitcoin ETFs turning to a $221.7m net inflow after a 10-day, $2.7bn outflow streak, the flow expression of the same rates repricing that lifted spot. The CF Large Cap (Diversified Weight) led at +8.80% w/w (YTD -33.87%), just ahead of the CF Broad Cap Index (Diversified Weight) at +8.69% (YTD -34.21%), while the free-float measures clustered below them: the CF Broad Cap Index (Free Float Market Cap Weight) rose 7.06% (YTD -31.39%), the CF Large Cap (Free Float Market Cap Weight) 7.05% (YTD -31.18%), the CF Institutional Digital Asset Index 7.01% (YTD -31.34%) and CF Ultra Cap 5 6.98% (YTD -31.36%), a 1.82 pp band across the six. The diversified variants outpaced their free-float counterparts by 1.63 pp at the broad-cap level and 1.75 pp at the large-cap level, and the gap has a mechanical explanation: diversified weighting holds proportionally more of the mid-cap names that rallied hardest, ADA's outsized move chief among them, so a broad rally led by beta shows up first in the diversified variants. YTD the ordering still favors free-float exposure by 2.5 to 3.0 pp; one week of breadth has not repaired the diversified indices' deeper 2026 drawdown.
Factors Analysis
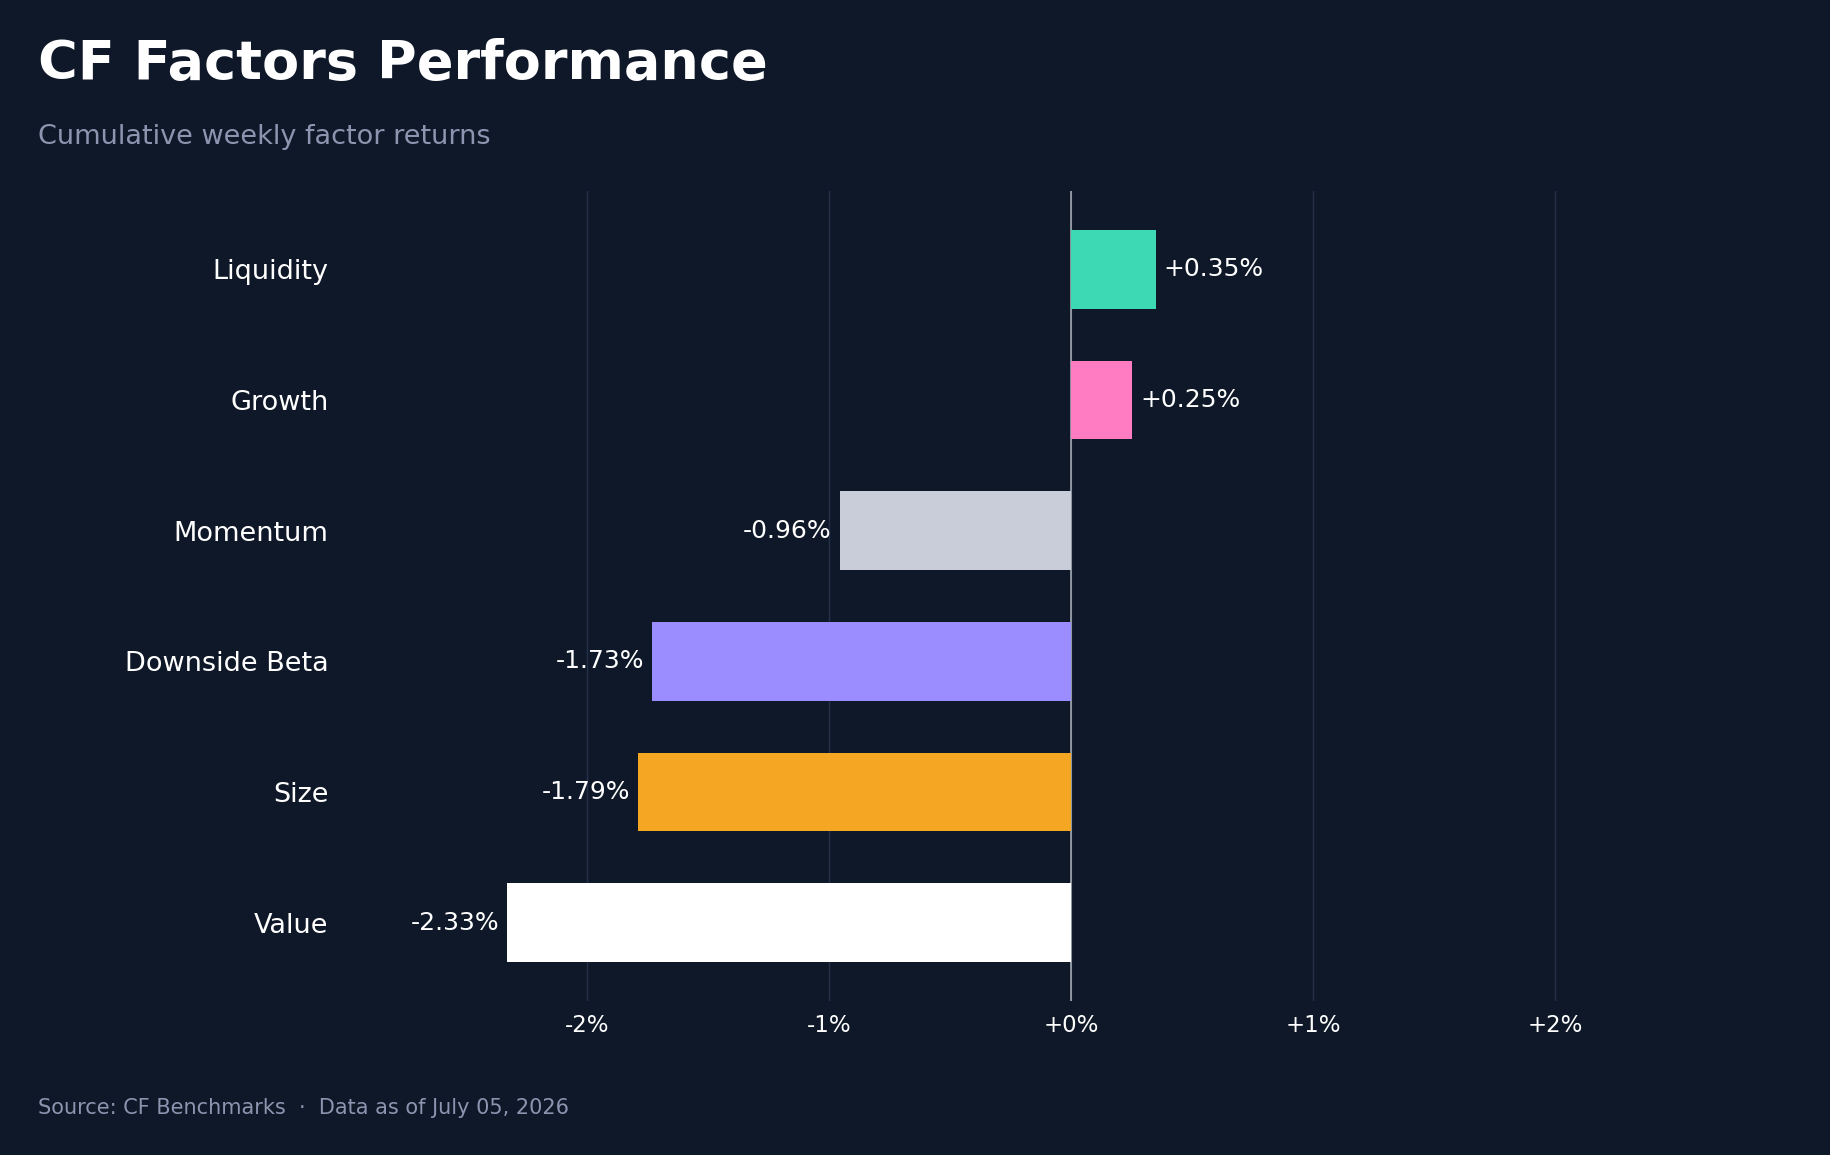
The factor set moved against spot, and the divergence has a logic to it. Cumulative weekly factor returns ran from Liquidity's +0.3% down to Value's -2.3%, a 2.68 pp spread that skewed negative even as the cash market rallied, because a relief rally is exactly the tape in which defensive factor positioning gets unwound. Value reversed from +2.3% to -2.3%, a -4.62 pp swing that was the largest rotation in the set, and Size flipped from +0.6% to -1.8%, a -2.41 pp move: the cheap and small exposures that had worked as shelter during the hike-risk stretch were sold once the payrolls miss removed the reason to hold them, with the proceeds visible in Liquidity improving from -1.1% to +0.3% and Growth firming from -0.2% to +0.3%. Momentum slipped from -0.6% to -1.0% and Downside Beta from -1.5% to -1.7%. Value and Size giving back their full prior-week gains in five sessions, 7.0 pp of combined swing against a 1.4 pp improvement in Liquidity, is what a fast repricing of the macro path looks like at the factor level.
Read our latest weekly crypto factors report: Factor Friday - July 3, 2026
Classification Series Analysis
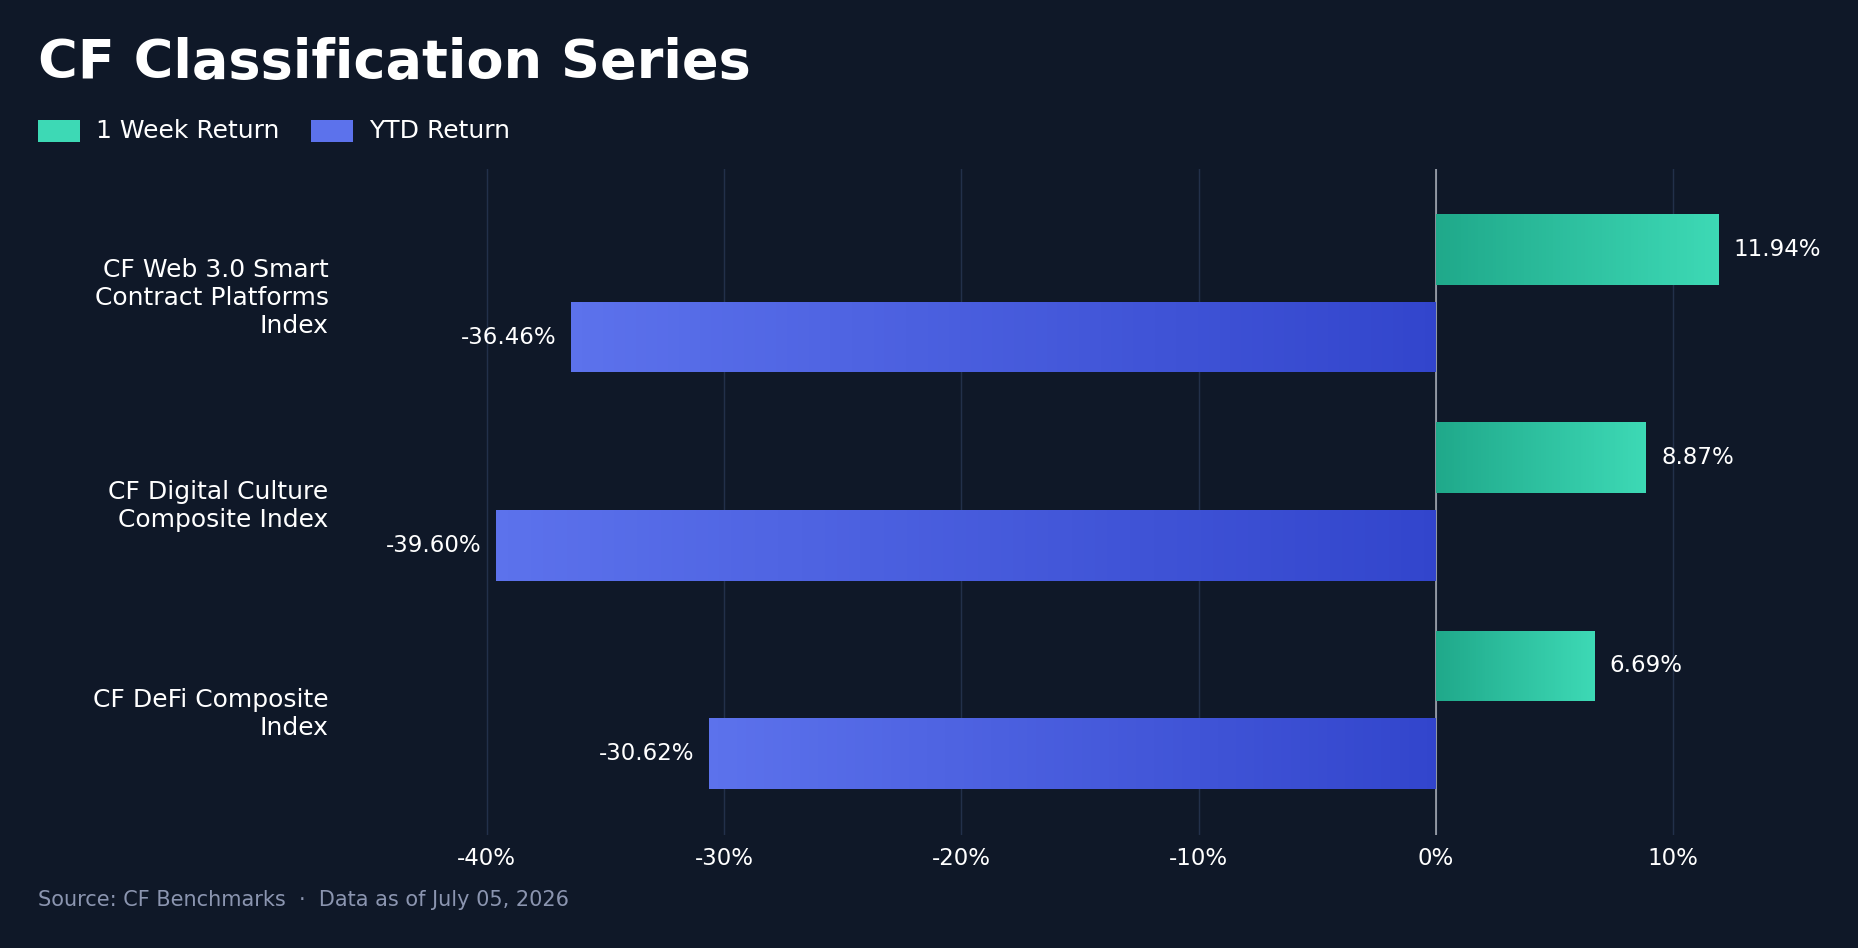
Across the CF Classification Series, thematic beta outran the majors. The CF Web 3.0 Smart Contract Platforms Index led at +11.94% w/w (YTD -36.46%), followed by the CF Digital Culture Composite Index at +8.87% (YTD -39.60%) and the CF DeFi Composite Index at +6.69% (YTD -30.62%); Web 3.0 outran DeFi by 5.25 pp and Culture by 3.06 pp, and all three composites beat Bitcoin's weekly print. The ordering follows directly from the week's single-asset tape: the smart-contract basket holds the two names that led the seven-asset set, so the same beta retracement that drove them lifted the composite most. DeFi's smaller weekly gain still leaves it with the shallowest YTD drawdown of the group, against Culture at the deep end; this week's leadership order is close to the inverse of the year's. Every theme beating BTC with the highest-beta platform basket on top is the classification-level signature of a relief rally rather than a defensive rotation.
Sector Analysis
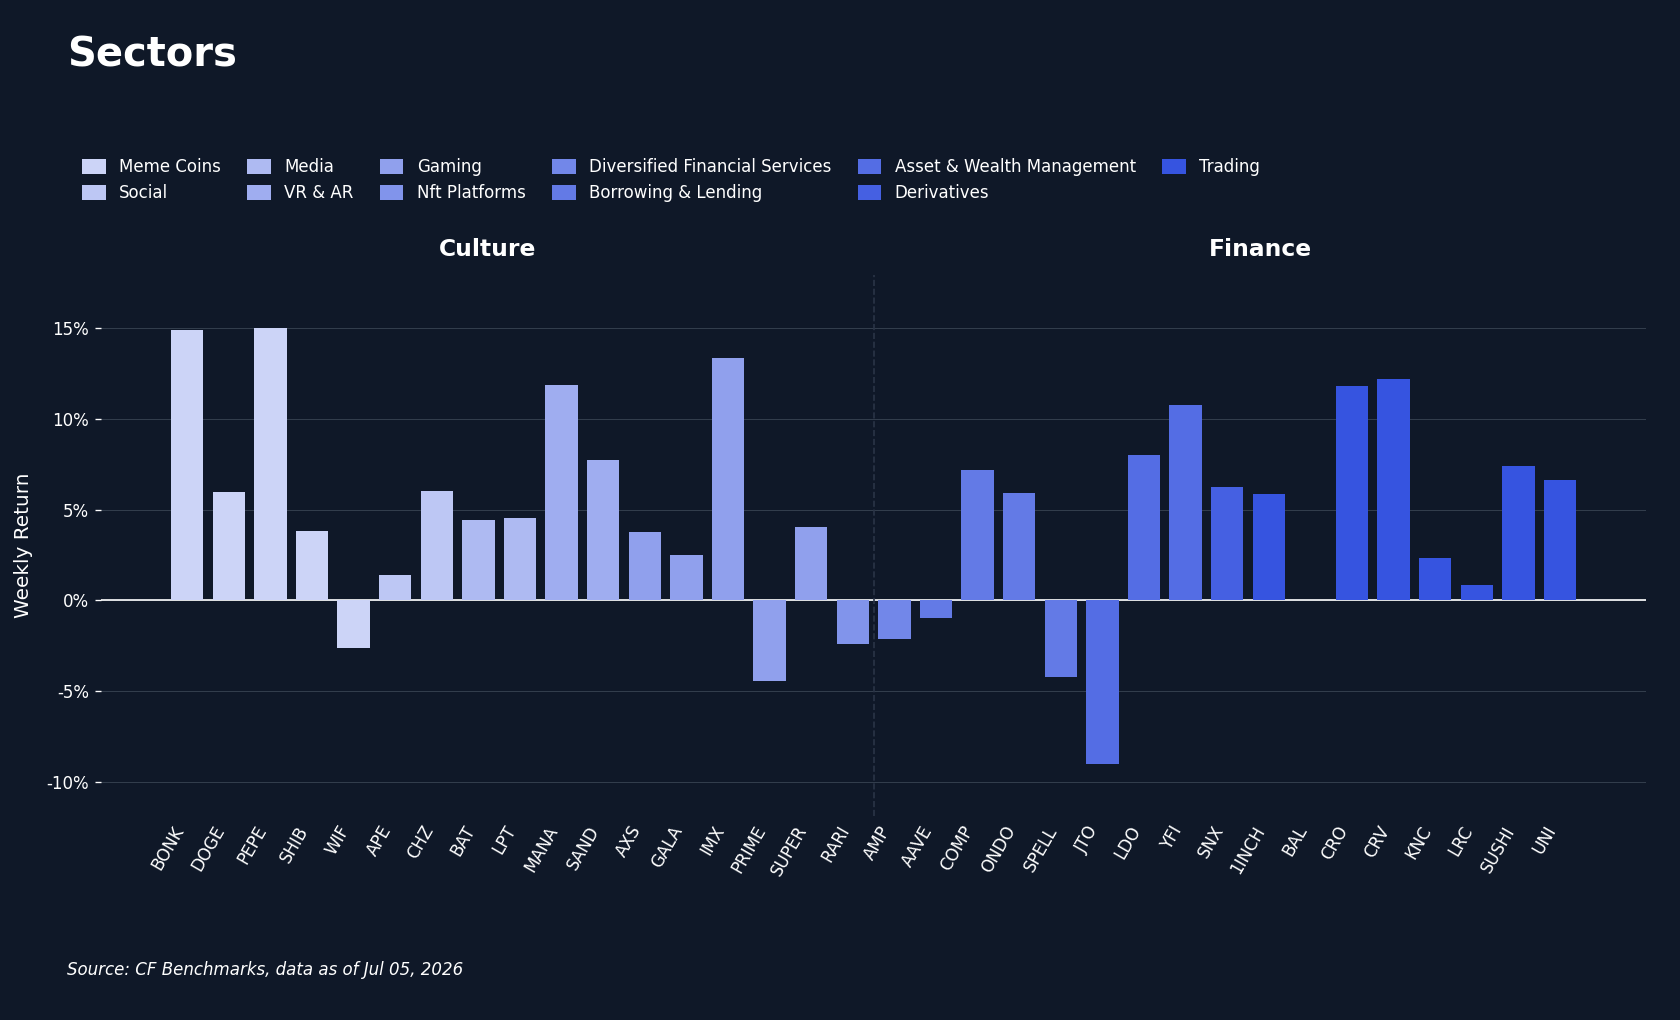
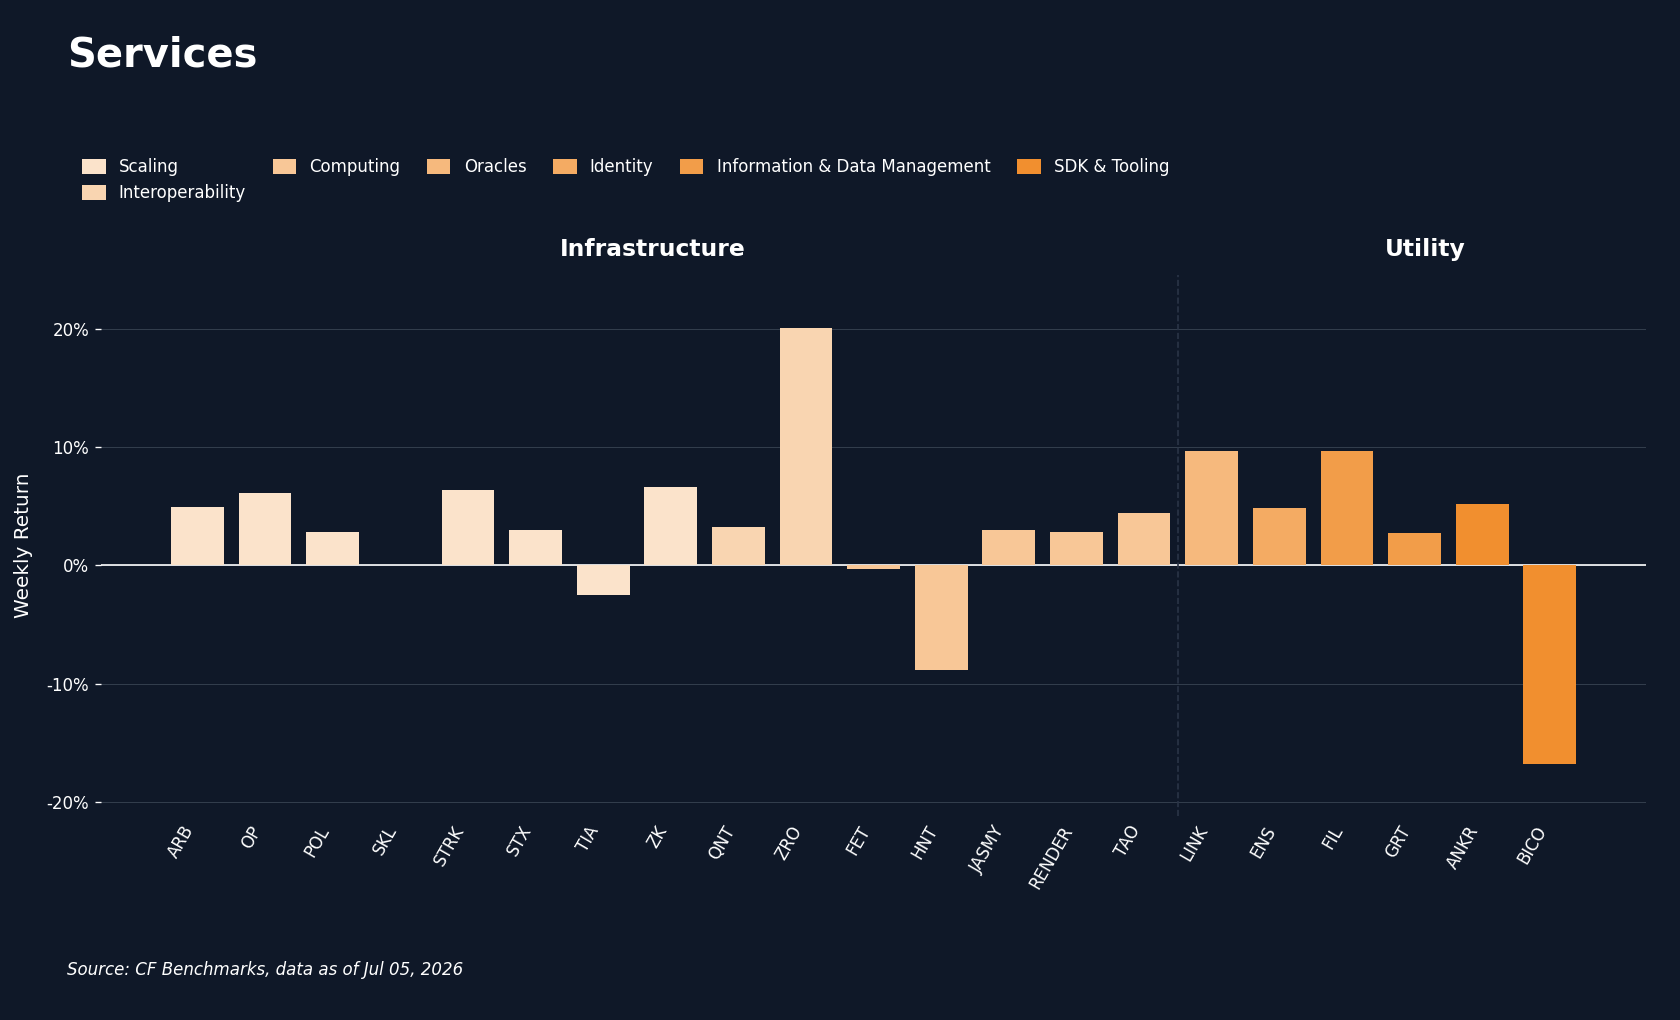
Sector performance across our CF Digital Asset Classification Structure (CF DACS) taxonomy was positive in every Sub-Category, with averages running from Utility's +2.6% to Non-Programmable's +11.6%, a 9.06 pp spread. The week's clearest industry catalyst explains that leadership. On June 30th the Open USD stablecoin consortium launched with more than 140 backers including Visa, Mastercard, Stripe and BlackRock, and named Stellar (XLM) a launch partner: being written into the settlement layer of a consortium at that scale gives XLM a direct claim on future payment throughput, and the market repriced it accordingly, roughly +10.0% on July 1st alone and +16.0% on the week. The launch also put a bid under the payments theme generally, and the rest of the Non-Programmable block rode it: Bitcoin Cash (BCH) added 21.7%, XRP 8.7% and Litecoin (LTC) 6.0%, with BTC posting the block's smallest gain. Programmable followed at +7.6% on average, led by the same name-specific Cardano recovery covered in the market performance section, with Tezos (XTZ) at +20.8% and ETH's double-digit gain behind it; Sei (SEI) at -1.5% was the group's laggard. Culture averaged +5.3% on a memecoin bid (PEPE +15.0%, BONK +14.9%) that we read as the risk-appetite turn expressing itself in its highest-beta corner rather than anything token-specific. Finance averaged +4.1% with Curve (CRV) up 12.2% against Jito (JTO) at -9.0%, and Infrastructure +3.5% with LayerZero (ZRO) up 20.1% against Helium (HNT) at -8.9%. Utility lagged at +2.6%, held back by Biconomy (BICO) falling 16.7% with no single in-week catalyst we can point to; that decline set the week's widest token-level spread, 47.88 pp between ADA and BICO.
CF Staking Series
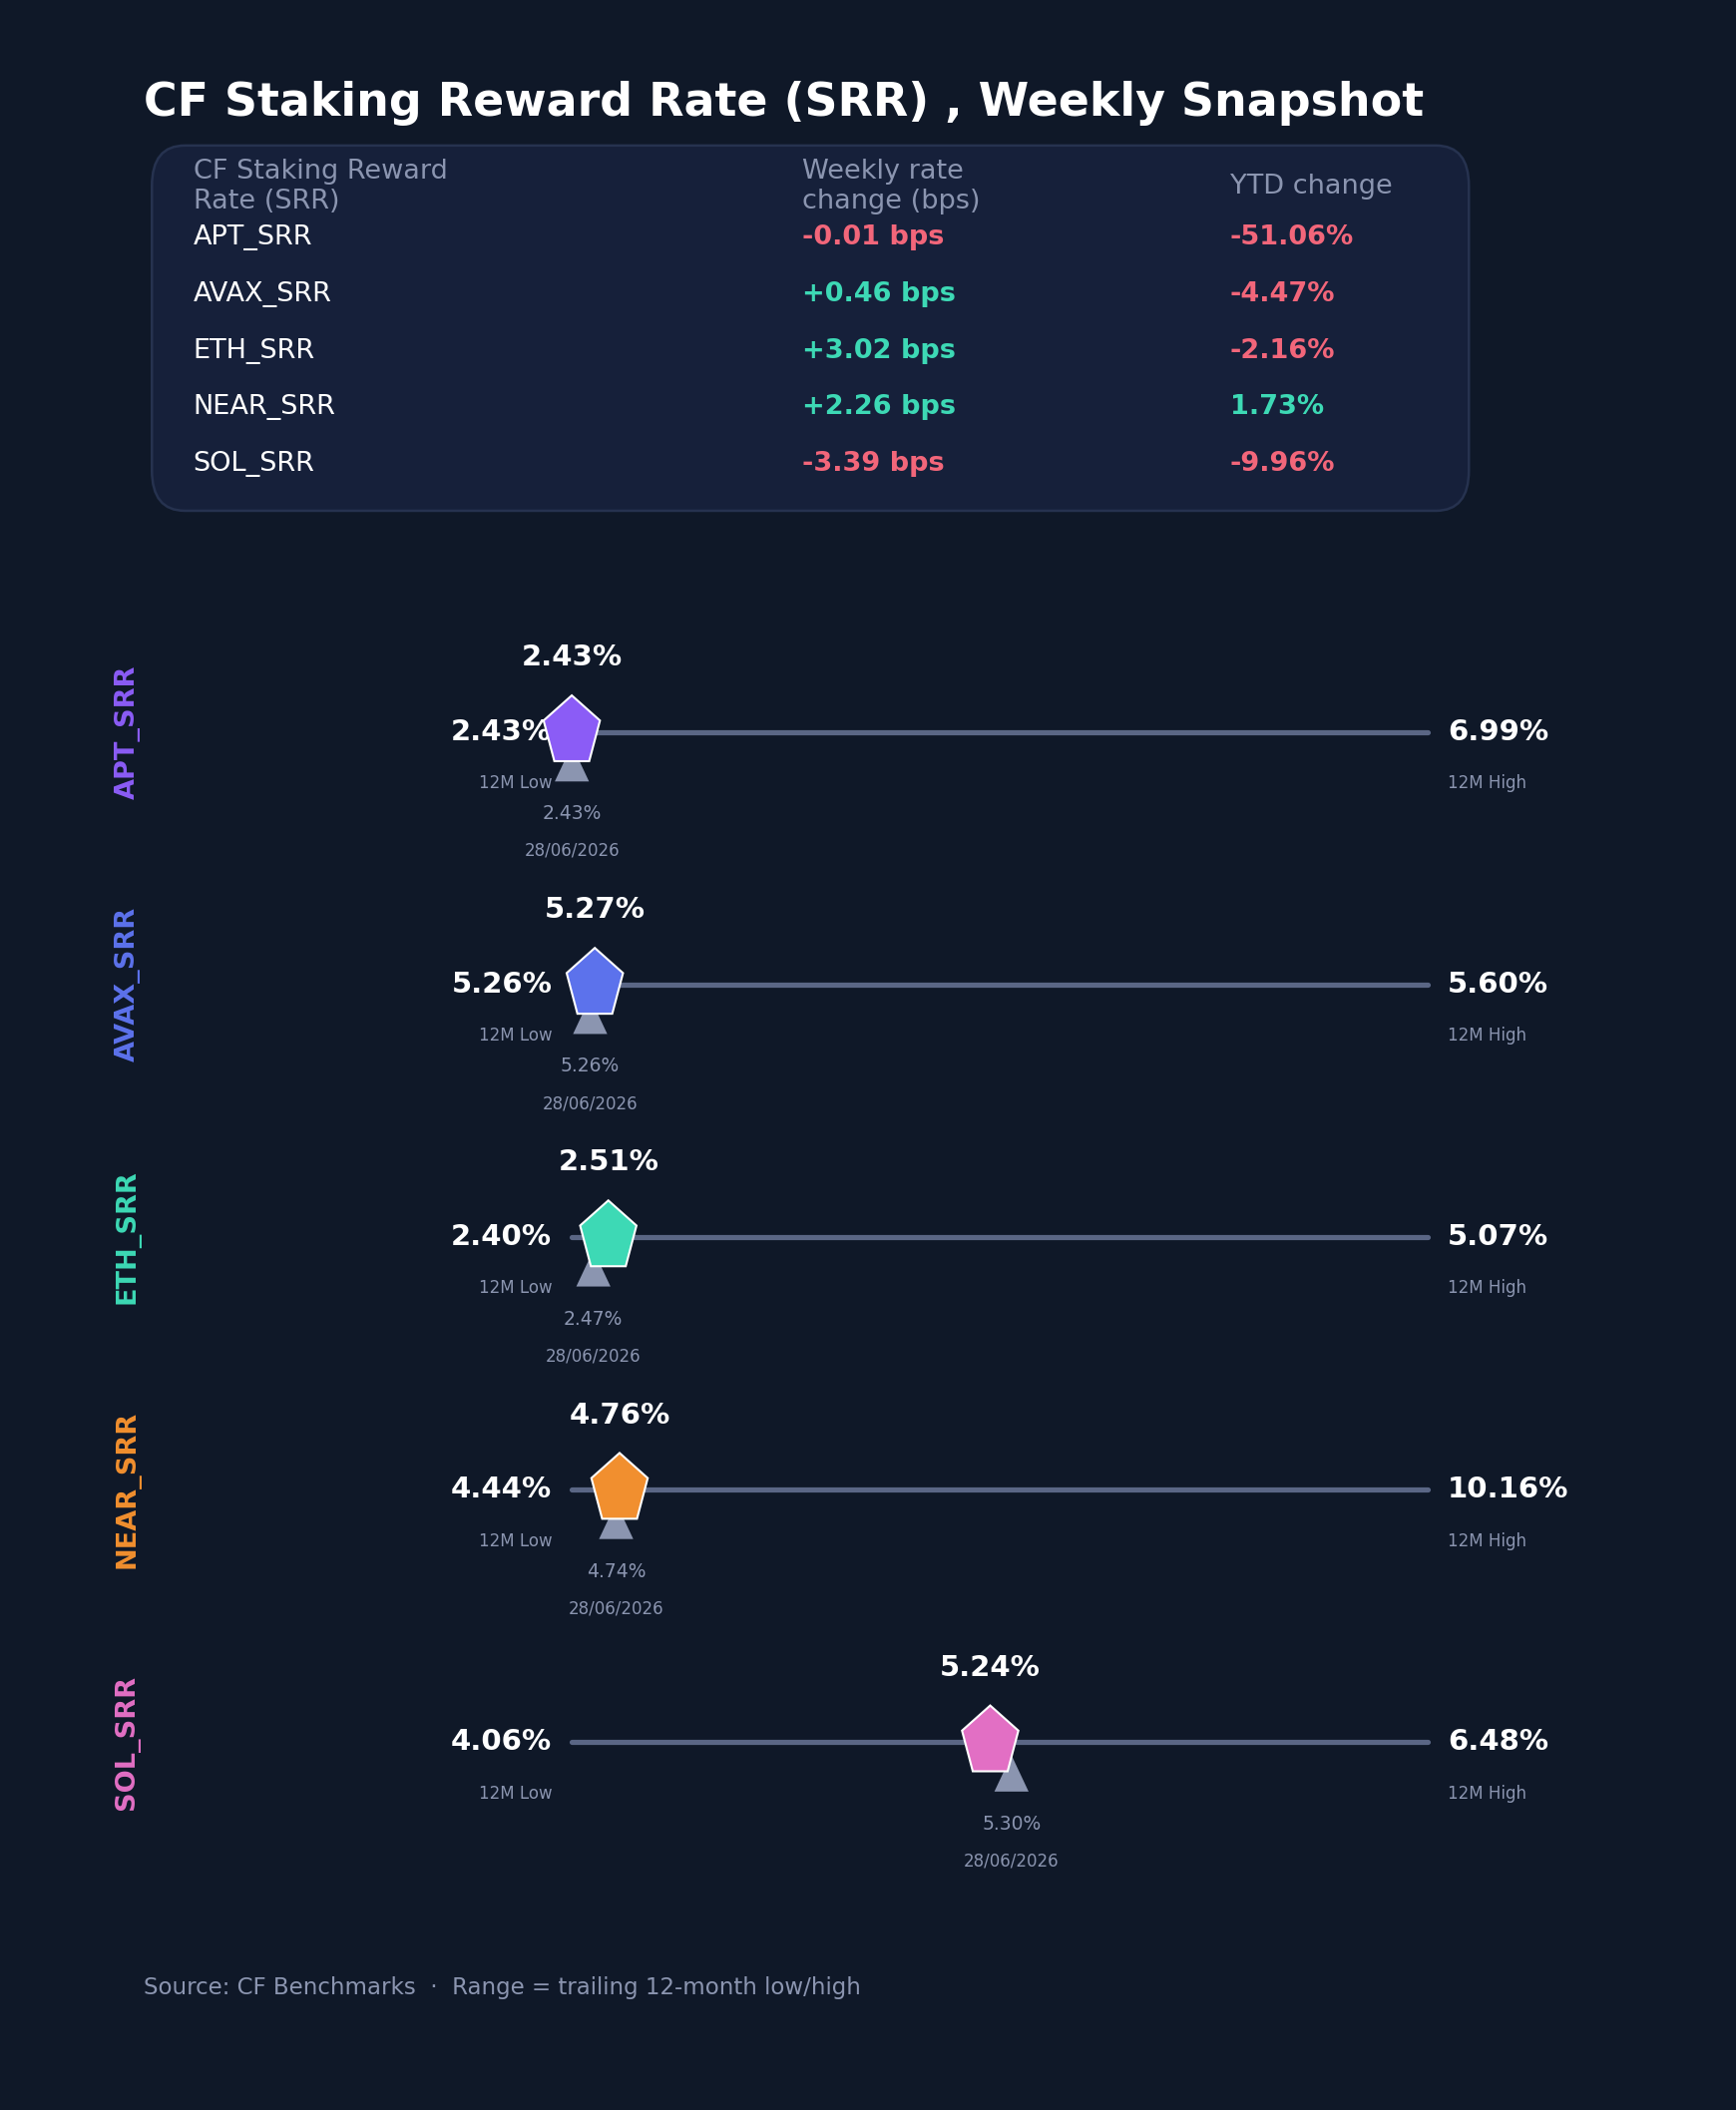
The CF Staking Series was quiet against the spot rebound, with weekly relative changes running from SOL Staking's -0.6% to ETH Staking's +1.2%, and the quiet is structural: reward rates are set by protocol issuance and validator participation, not by price, so a macro repricing passes through spot without touching carry. ETH Staking led, its reward rate moving from 2.4827% to 2.5129% between June 29th and July 5th, a +3.0 bps change that extends the recovery from the 2.3987% 12-month low set earlier this year. NEAR Staking added 0.5% with its rate up 2.3 bps, from 4.7401% to 4.7627%. AVAX Staking was near flat at +0.1%, the rate edging from 5.2617% to 5.2663%, a +0.5 bps move that keeps it pinned near the bottom of its narrow 5.2569% to 5.6045% 12-month band, and APT Staking was unchanged at -0.0%, its rate moving from 2.4290% to 2.4289% and still sitting at the floor of its 12-month range. SOL Staking was the only meaningful decliner at -0.6%, the reward rate falling from 5.2786% to 5.2447%, or -3.4 bps. Reward-rate changes spanned -3.4 bps to +3.0 bps in a week when spot returns reached double digits, with current rates running from APT's 2.4289% to AVAX's 5.2663%; the week's action stayed in price, not carry.
Interest Rate Analysis
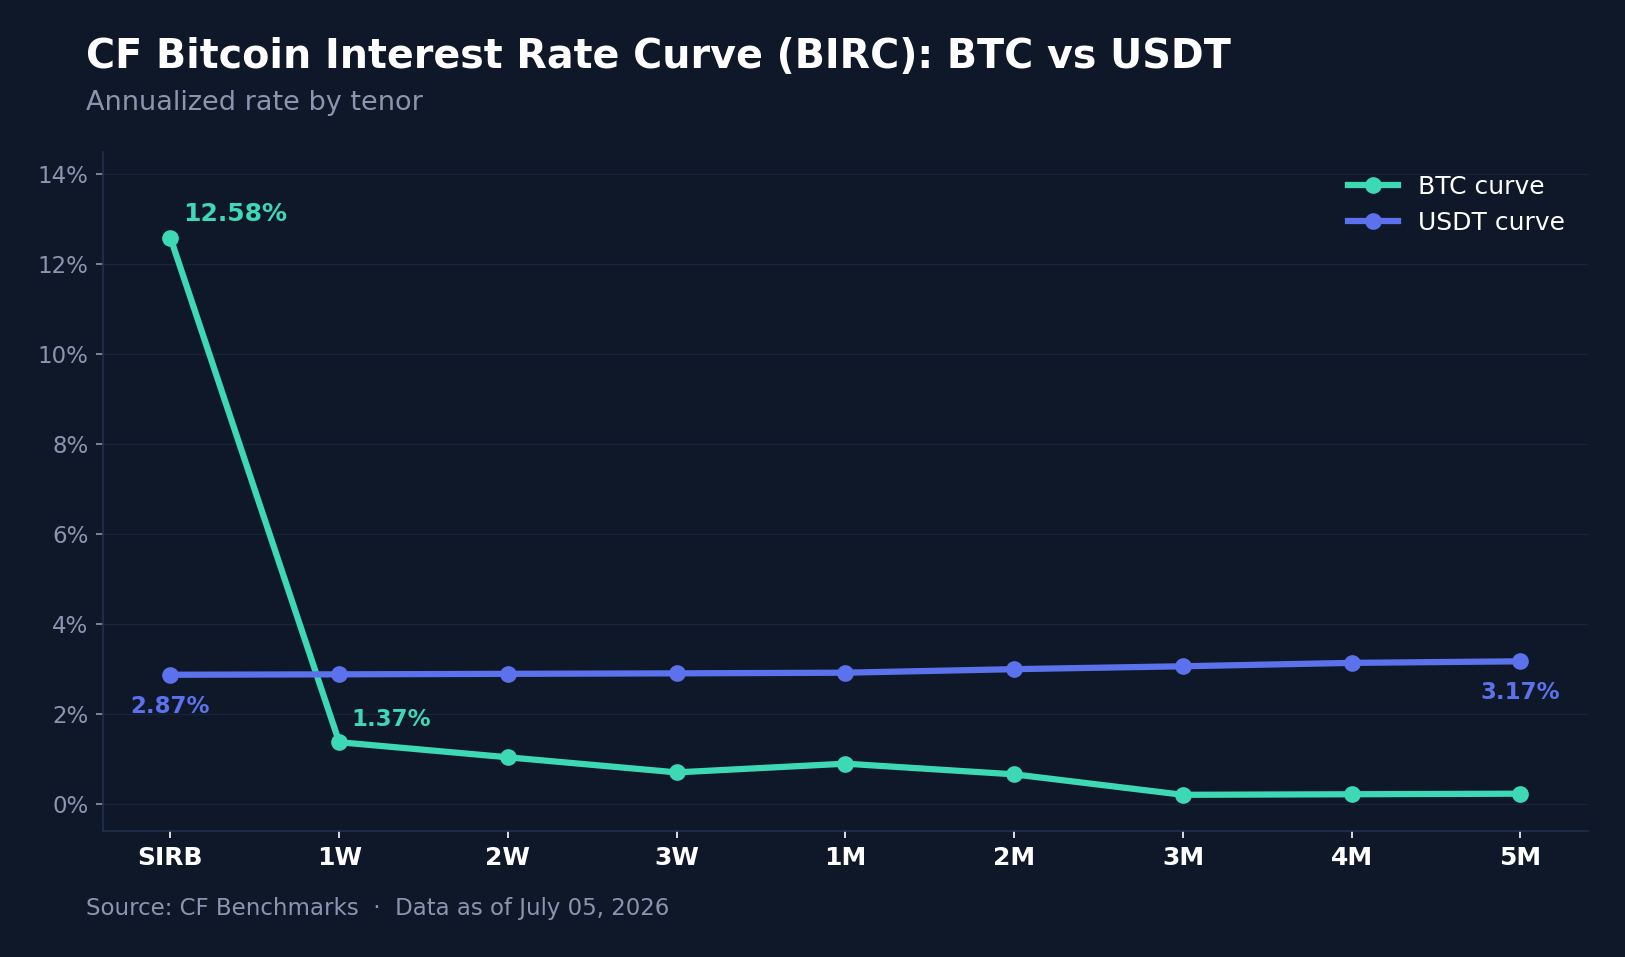
Funding conditions moved in opposite directions at the two ends of the CF Bitcoin Interest Rate Curve (BIRC). The Bitcoin Session Interest Rate (SIRB) eased from 13.0528% to 12.5756%, a -47.7 bps change, while every BTC term tenor firmed: 1W rose 67.0 bps to 1.3684%, 2W added 58.1 bps to 1.0331%, 3W 27.5 bps to 0.6978%, 1M 50.8 bps to 0.8917%, 2M 38.6 bps to 0.6541% and 3M 14.9 bps to 0.1994%. The USDT curve lifted almost uniformly: SIRB rose 20.2 bps to 2.8672%, 1W 20.0 bps to 2.8766%, 1M 19.4 bps to 2.9129%, 3M 17.7 bps to 3.0558% and 5M 20.9 bps to 3.1658%. Across both curves, tenor changes ranged from -47.7 bps to +67.0 bps, with the BTC curve supplying both extremes. The BTC front end remains the market's dislocation, a 12.58% session rate against term tenors below 1.4%, but the week narrowed it from both sides, and the two-sided move is what identifies the driver: the session premium exists because stressed positioning pays up for overnight borrow, so when the payrolls print took the stress out, the session rate bled lower while term carry repriced higher with the recovering spot market. USDT's parallel +18 to +21 bps shift, by contrast, is a clean pass-through of the firmer dollar-rates backdrop, the shape of a curve responding to funding costs rather than positioning. The BTC curve was the idiosyncratic one this week, and its normalization ran in the direction an unwind of the July 1st stress build-up would predict.
Closing Synthesis
Taken together, the week reads as one trade expressed across every series we track: hike risk built into July 1st, then a soft payrolls print took it out, and each series moved the way that single repricing implies. Spot rebounded with the diversified cap indices ahead of free-float, the payments-led Non-Programmable block topped the DACS table on a catalyst with a stated transmission channel, implied volatility compressed as the insured tail shrank, and BTC funding normalized from both ends of a stressed curve. The exceptions fit the same read: Cardano's outlier week was name-specific, and the factor set's negative skew shows defensive exposures being unwound rather than fresh accumulation.
The information contained within is for educational and informational purposes ONLY. It is not intended nor should it be considered an invitation or inducement to buy or sell any of the underlying instruments cited including but not limited to cryptoassets, financial instruments or any instruments that reference any index provided by CF Benchmarks Ltd. This communication is not intended to persuade or incite you to buy or sell security or securities noted within. Any commentary provided is the opinion of the author and should not be considered a personalised recommendation. Please contact your financial adviser or professional before making an investment decision.
Note: Some of the underlying instruments cited within this material may be restricted to certain customer categories in certain jurisdictions.
Factor Friday - October 9, 2026
Size led CF Benchmarks' factor table for a second week at 2.58% as the Market fell 4.98%. Size held after QNT's reversal, though its cohort spread narrows sharply without three outlier tokens, and Downside Beta and Liquidity gave back part of last week's gains.

Mark Pilipczuk
Small Cap Tokens Outperform in September
The CF Free-Float Broad Cap Index rose 10.28% in September as Bitcoin supplied 59% of the gain while trailing the index. Returns across the Capitalization Series ran from +7.74% for Ultra Cap 5 to +14.01% for Emerging Crypto, which holds no Bitcoin, as altcoins outpaced Bitcoin.
Mark Pilipczuk
CF Digital Asset Index Family Multi Asset Series – Extraordinary Rebalance Announcement
CF Digital Asset Index Family Multi Asset Series - Extraordinary Rebalance Announcement
CF Benchmarks
By clicking Accept, you consent to CF Benchmarks's use of cookies.
Visit Cookie Settings to learn how CF Benchmarks uses cookies and to adjust your preferences.