
Jul 03, 2023
Monthly Market Recap - June 2023
This report aims to provide the reader with a quick overview of the blockchain economic categories influencing recent market performance, gain insights into institutional investors' capital allocation in digital assets, and understand how crypto is affected by the broader market landscape.
Key takeaways for the month:
- Markets are showing renewed optimism in response to several premier asset managers pursuing spot Bitcoin ETF approvals. This has triggered an aggressive upward retracement in the price of Bitcoin, allowing it to break out of its downward channel and surpass the $30,000 threshold. This positive price momentum has also benefited other major cryptocurrencies, with Ether climbing back above the $1,900 mark.
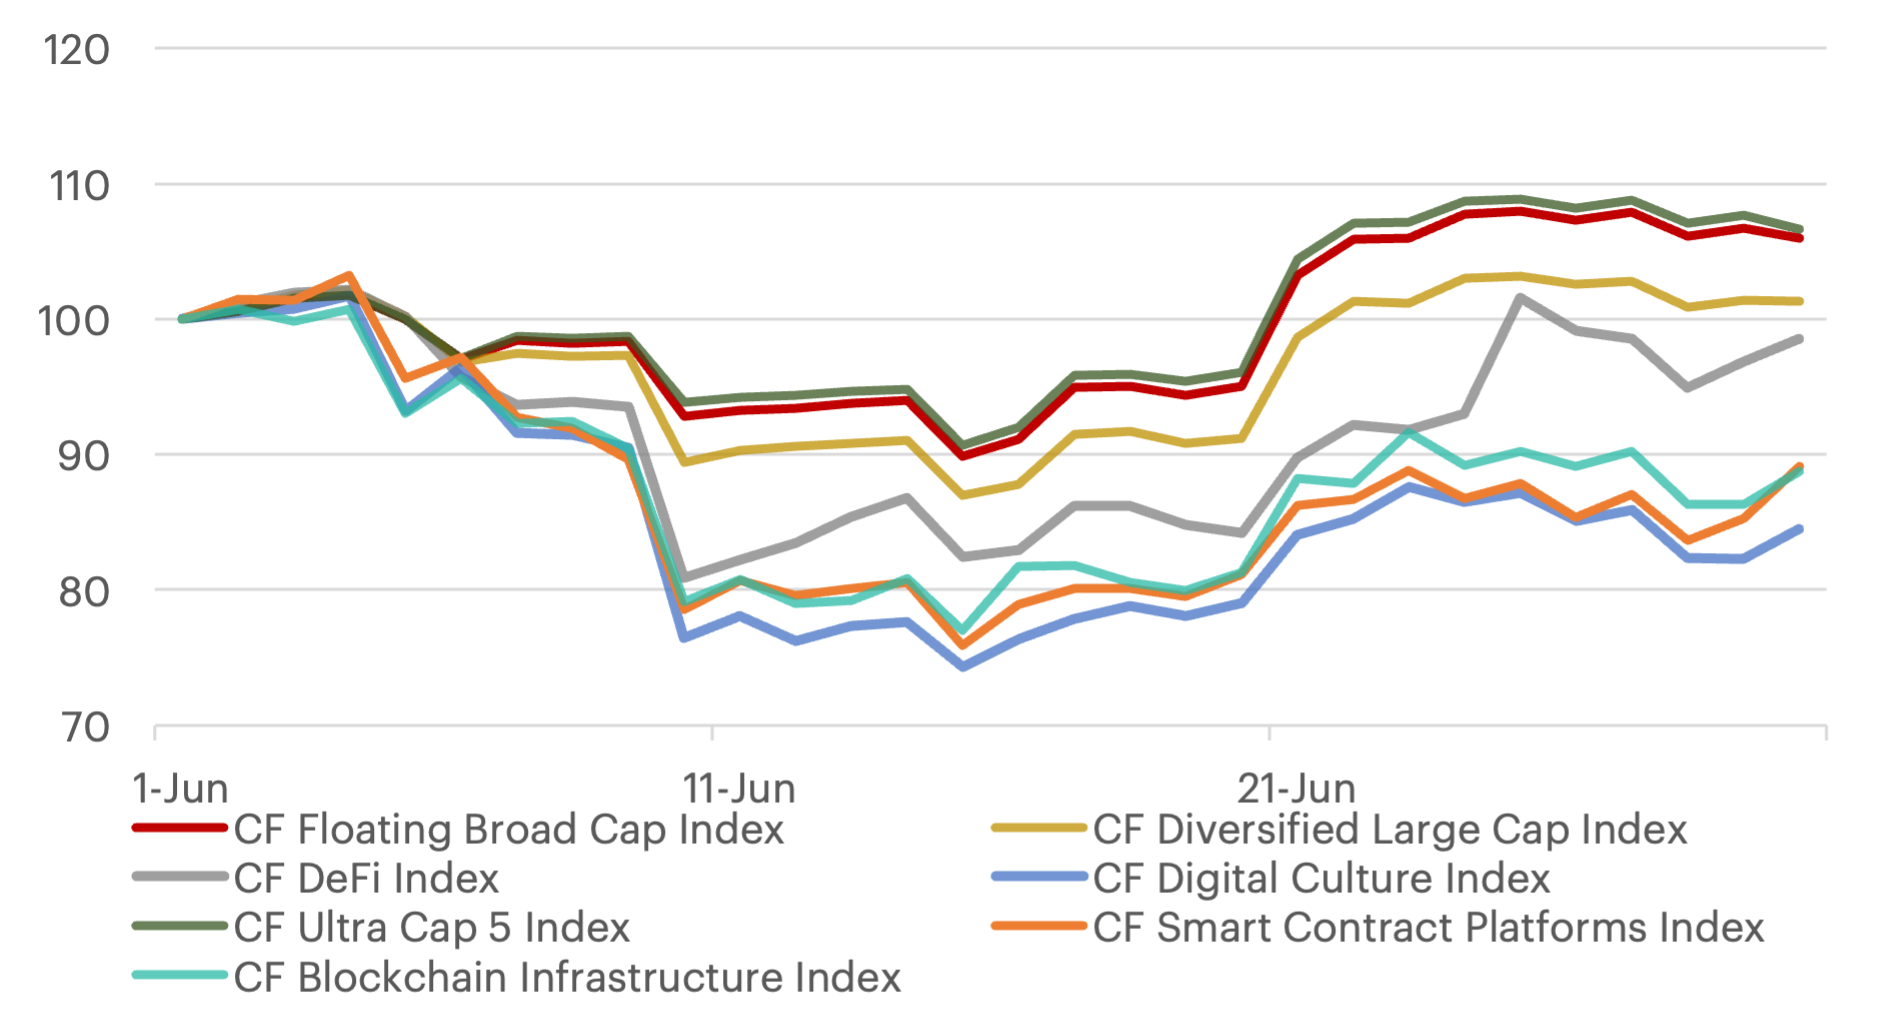
- Bitcoin dominance has allowed the CF Ultra Cap 5 Index to maintain its relative strength over the rest of our flagship indices, rising over 6.7% for the month.
- The prospect of a U.S. spot Bitcoin ETF has profoundly impacted fund flows, causing Bitcoin fund inflows to soar to levels last seen in May 2022. In addition, open interest for BTC futures has surged by over 60%, reaching a record level of nearly 19K contracts. This marks the largest relative monthly increase since October 2021.
Monthly Index Performance
To read the complete report, kindly click on the provided link. Additionally, please do not forget to subscribe to our latest news and research for the most relevant institutional insights on digital assets.
The information contained within is for educational and informational purposes ONLY. It is not intended nor should it be considered an invitation or inducement to buy or sell any of the underlying instruments cited including but not limited to cryptoassets, financial instruments or any instruments that reference any index provided by CF Benchmarks Ltd. This communication is not intended to persuade or incite you to buy or sell security or securities noted within. Any commentary provided is the opinion of the author and should not be considered a personalised recommendation. Please contact your financial adviser or professional before making an investment decision.
Note: Some of the underlying instruments cited within this material may be restricted to certain customer categories in certain jurisdictions.
Notice of the Demising of CF IoTeX-Dollar Spot Rate
Notice of the Demising of CF IoTeX-Dollar Spot Rate

CF Benchmarks
Pricing the Perp DEX Leader: A Valuation Framework for Hyperliquid
Hyperliquid returns ~83 cents of every fee dollar to HYPE holders via buybacks, far more than Coinbase or Robinhood turn into profit. On fully diluted supply it trades near 61x earnings; our modeling assumes growing market share and puts fair value near $106, about 89% above the June 10 price.
Mark Pilipczuk
Announcement of Consultation on Changes to the CME CF Real Time Indices Methodology
Announcement of Consultation on Changes to the CME CF Real Time Indices Methodology
CF Benchmarks
By clicking Accept, you consent to CF Benchmarks's use of cookies.
Visit Cookie Settings to learn how CF Benchmarks uses cookies and to adjust your preferences.