
Jun 29, 2026
Implied Volatility Premiums Rise as Macro Risks Loom
Weekly Index Highlights, June 29, 2026
Persistent inflation concerns weighed on risk sentiment last week. Thursday's May Personal Consumption Expenditures (PCE) report set the direction: core inflation held at 0.3% month over month, but the annual core rate firmed to 3.4% year over year, its highest since October 2023, and headline PCE reached 4.1% year over year on an energy-led print. The reading confirmed the prior week's hawkish Federal Reserve hold and narrowed the path to rate cuts. Digital assets fell into the release and extended lower after it, alongside a seventh straight session of US spot Bitcoin and Ether ETF redemptions and a roughly $1.26bn cross-market liquidation on June 26th. All seven CME CF Single Asset names fell, a drawdown consistent with traders pricing tighter monetary policy, not weaker crypto fundamentals.
Market Performance Update
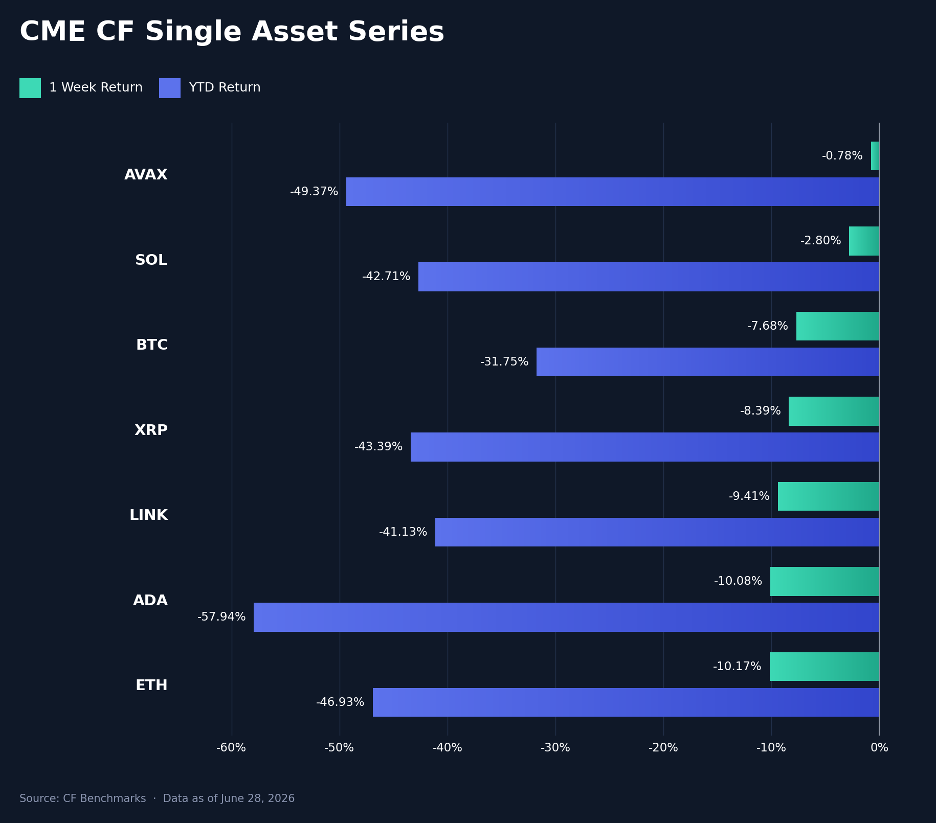
Every major token fell last week. Avalanche (AVAX) held up best at -0.8% week-on-week (w/w), then Solana (SOL) at -2.8%, Bitcoin (BTC) at -7.7%, and the longer tail lower still: XRP -8.4%, Chainlink (LINK) -9.4%, Cardano (ADA) -10.1% and Ether (ETH) -10.2%. The weekly range from AVAX's -0.8% to ETH's -10.2% was a 9.4 percentage point (pp) spread across the seven names. The May PCE print framed the move for the majors, and beta concentrated in the highest-sensitivity names: ETH and ADA led the decline, while BTC's -7.7% left mega-cap exposure at the firmer end. SOL and AVAX fell least, an inversion of the prior week, when AVAX was the weakest large cap at -9.3% and SOL the firmest at +0.2%. Year-to-date (YTD) losses now run from BTC's -31.8% to ADA's -57.9%, with ETH at -46.9% and AVAX at -49.4%, leaving the set deeper in its 2026 drawdown.
Volatility Analysis
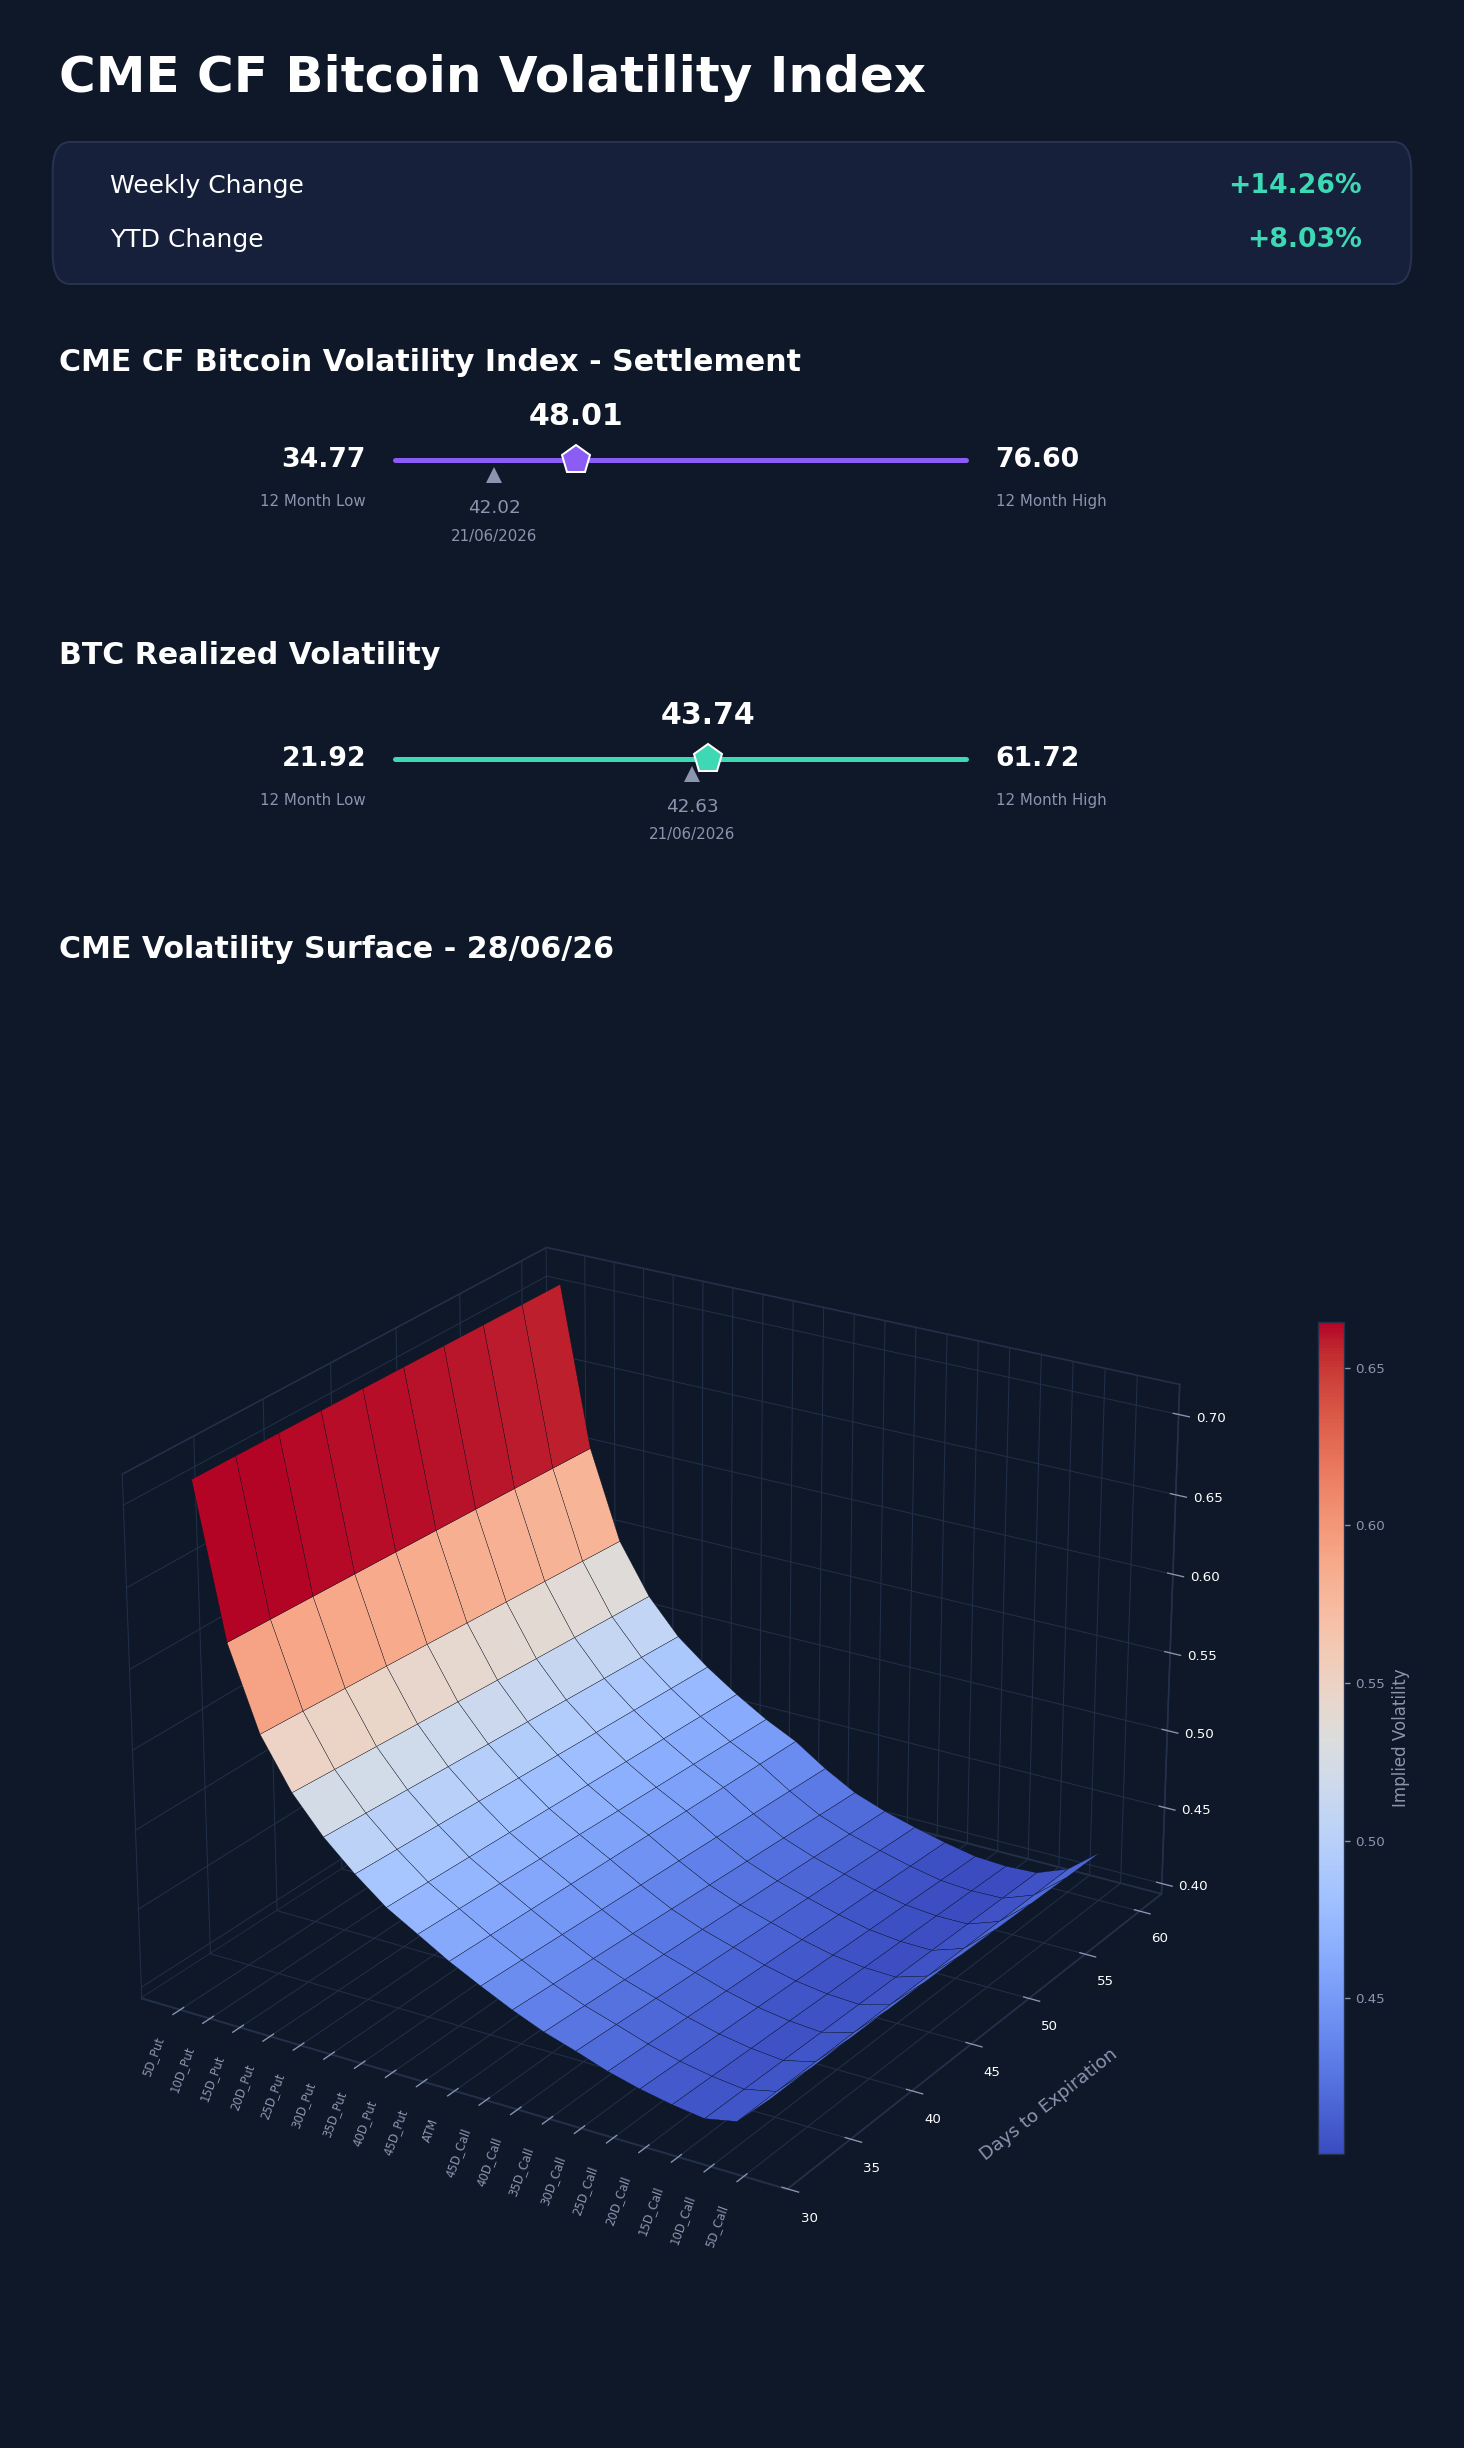
Bitcoin's implied volatility rose while realized volatility held flat, rebuilding a forward premium. The CME CF Bitcoin Volatility Index - Settlement (BVXS) rose from 42.02 a week earlier to 48.01 at the June 28th close, up 5.99 vol. points; within the business week it climbed from 40.66 at the Monday June 22nd open to 47.45 at the Friday June 26th close. Thirty-day realized volatility ended at 43.74 against 42.63 a week earlier, up 1.12 vol. points. That left implied volatility 4.27 vol. points above realized at the June 28th close, against a 0.61 vol. point discount a week earlier, a 4.87 vol. point swing into premium. BVXS sat 13.24 vol. points above its trailing 12-month low of 34.77 and 28.59 below its 76.60 high; realized volatility stood 21.83 vol. points above its 21.92 low. Implied volatility rose 14.3% on the week while realized held flat, widening the implied-to-realized gap to 4.27 vol. points. Higher implied against flat realized points to demand for forward protection, with options buyers paying up ahead of the move.
Market Cap Index Performance
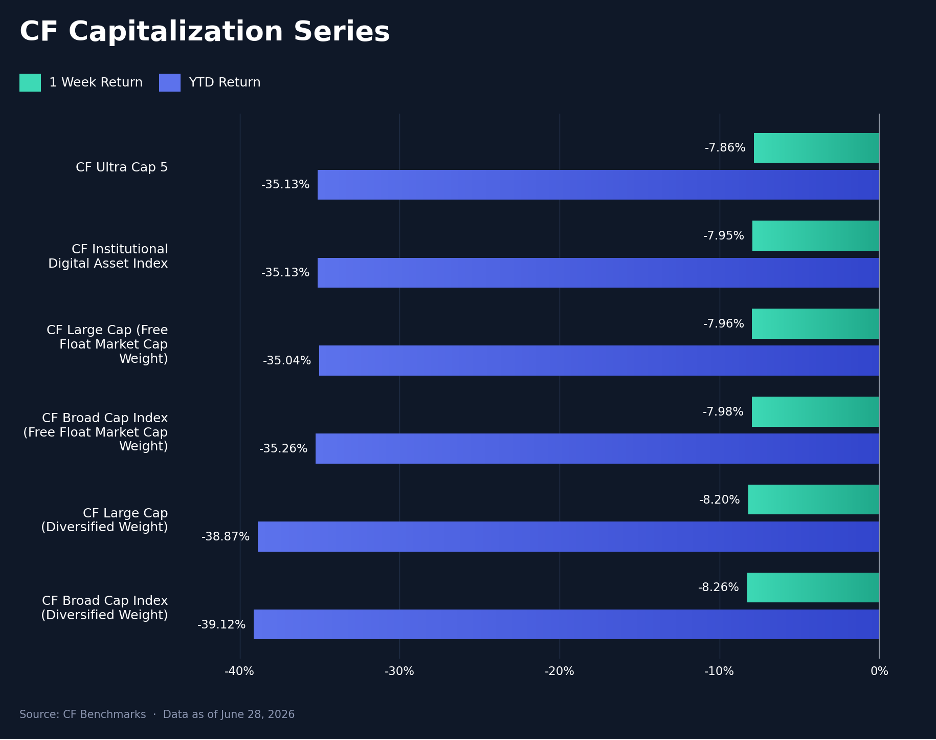
The CF Capitalization indices fell together in a tight band. CF Ultra Cap 5 declined 7.86% w/w, the CF Institutional Digital Asset Index 7.95%, the CF Large Cap (Free Float Market Cap Weight) 7.96% and the CF Broad Cap Index (Free Float Market Cap Weight) 7.98%; diversified-weight exposure fell a little more, with the CF Large Cap (Diversified Weight) down 8.20% and the CF Broad Cap Index (Diversified Weight) down 8.26%. The six indices sat in a -7.86% to -8.26% band, a 0.41 pp spread, and the 0.31 pp gap between the broad diversified index and the large-cap free-float measure was the only sign of weaker breadth below the mega-cap layer. The selloff hit all six indices within that narrow band, alongside a seventh consecutive session of US spot Bitcoin and Ether ETF redemptions, consistent with demand leaving across the series rather than a single name. YTD, diversified-weight indices near -39.0% sit about 3.9 pp below the free-float large-cap measures near -35.1%, the cumulative cost of a thinner tail through 2026.
Factors Analysis
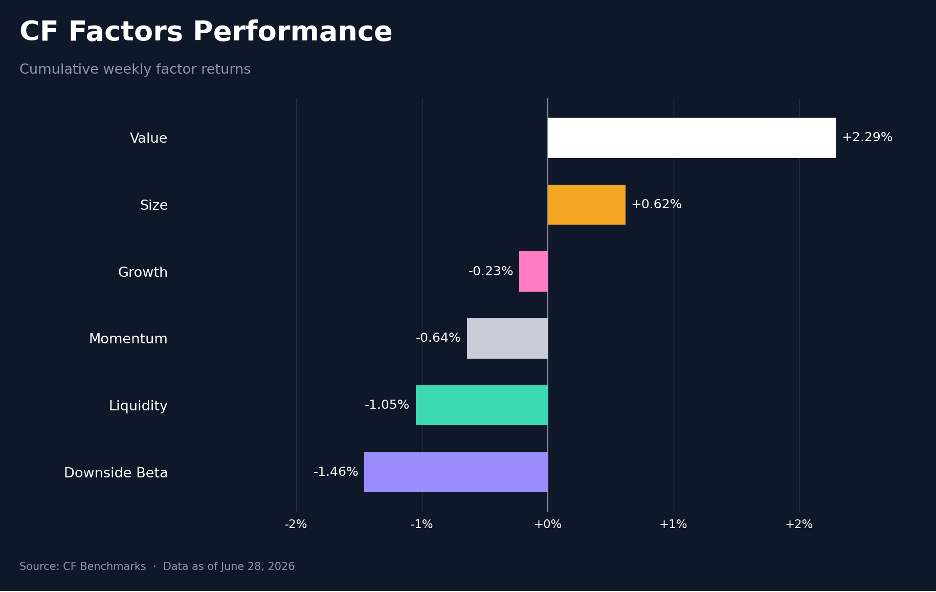
Cumulative factor returns rotated toward defensive styles, with Value the strongest of the six. Value printed 2.3% after 2.6% a week earlier, holding the top of the set, and Size improved to 0.6% from -0.4%, a 1.1 pp gain. The cyclical and beta-sensitive factors fell: Growth reversed from 3.3% to -0.2%, a 3.6 pp swing and the largest move in the set; Downside Beta fell from 0.6% to -1.5%, a 2.1 pp move; and Liquidity moved from 0.7% to -1.1%, a 1.7 pp shift. Momentum stayed negative at -0.6%, up from -1.8%. Weekly factor returns ran from Downside Beta's -1.5% to Value's 2.3%, a 3.8 pp spread, narrower than the prior week. Downside Beta at the bottom of the set is the factor signature of a selloff led by high-beta names, and Growth's drop from the prior week's lead was the clearest style reversal of the week.
Read our latest weekly crypto factors report: Factor Friday - June 26, 2026
Classification Series Analysis
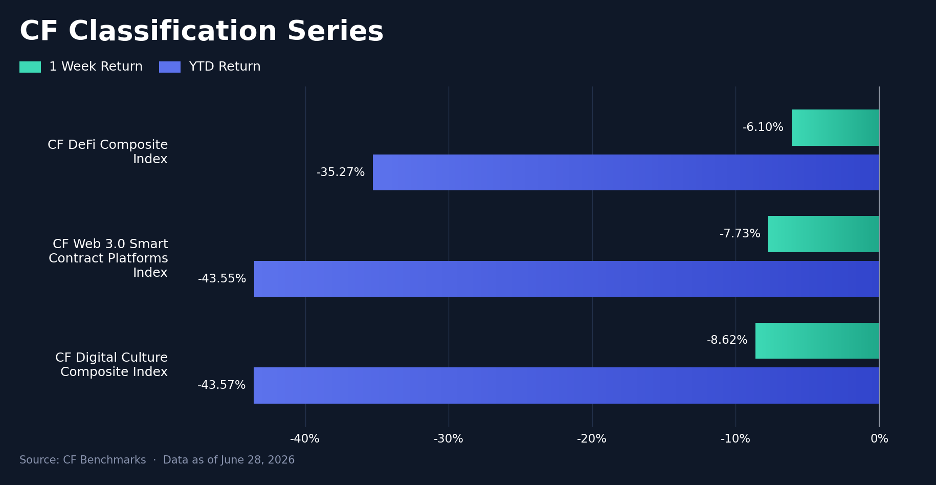
Across the CF Classification Series, all three themes fell, and DeFi fell least. The CF DeFi Composite Index declined 6.1% w/w (YTD -35.3%), ahead of the CF Web 3.0 Smart Contract Platforms Index at -7.7% (YTD -43.6%) and the CF Digital Culture Composite Index at -8.6% (YTD -43.6%). DeFi outperformed Web 3.0 by 1.6 pp and Digital Culture by 2.5 pp on the week, and its -6.1% return beat Bitcoin's -7.7% by 1.6 pp, the one theme to outperform the largest single asset. That margin came from two Finance constituents, AAVE and JTO, covered in the sector section; the rest of the DeFi index fell with the market. Web 3.0 and Digital Culture took the deepest thematic losses and carry YTD drawdowns of -43.6% each.
Sector Analysis
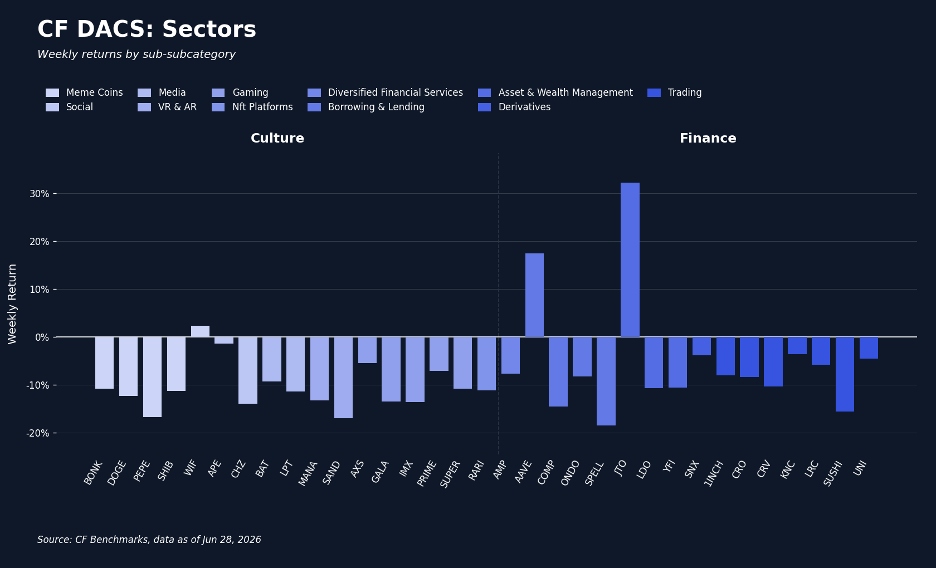
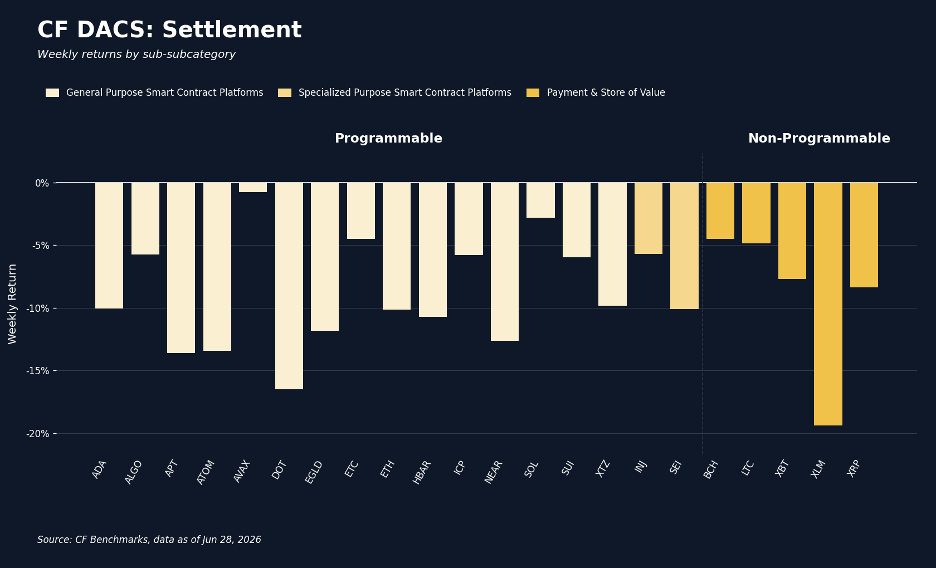
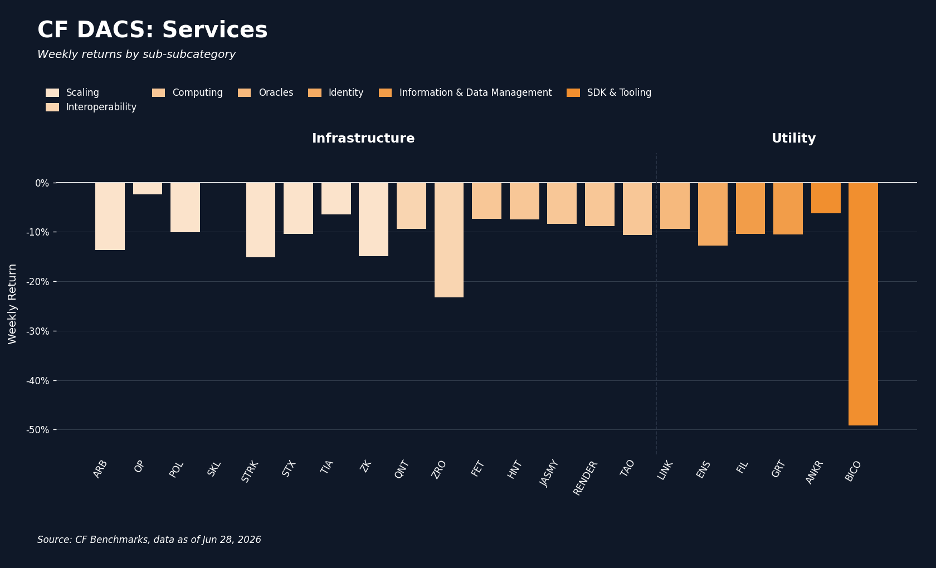
Sector performance across the CF Digital Asset Classification Structure (CF DACS) was negative in aggregate and wide beneath the surface. The Finance Sub-Category led at -5.1% w/w, ahead of Programmable at -8.8%, Non-Programmable at -9.0%, Infrastructure at -9.9% and Culture at -10.5%; Utility was the weakest at -16.4%, an 11.3 pp Finance-to-Utility spread. Finance's lead came from two names. Jito (JTO) rose 32.2%, repricing through the week around its announced JTX self-custody trading terminal and token buyback program. Aave (AAVE) rose 17.4% after founder Stani Kulechov previewed the Aavenomics 3.0 automated buyback mechanism on June 25th and confirmed it live on June 27th. Those two offset Finance laggards SPELL (-18.5%) and COMP (-14.6%). The widest single move sat in Utility, where Biconomy (BICO) fell 49.1%, giving back a June 20th doubling; that print against JTO's +32.2% left an 81.3 pp spread across DACS constituents. The rest of the drawdown was undifferentiated: XLM (-19.4%) was the weakest Non-Programmable name, ZRO (-23.3%) the weakest in Infrastructure, DOT (-16.5%) the weakest Programmable platform, and SAND (-17.1%) and PEPE (-16.7%) the deepest Culture losses, none on a token-specific event.
CF Staking Series
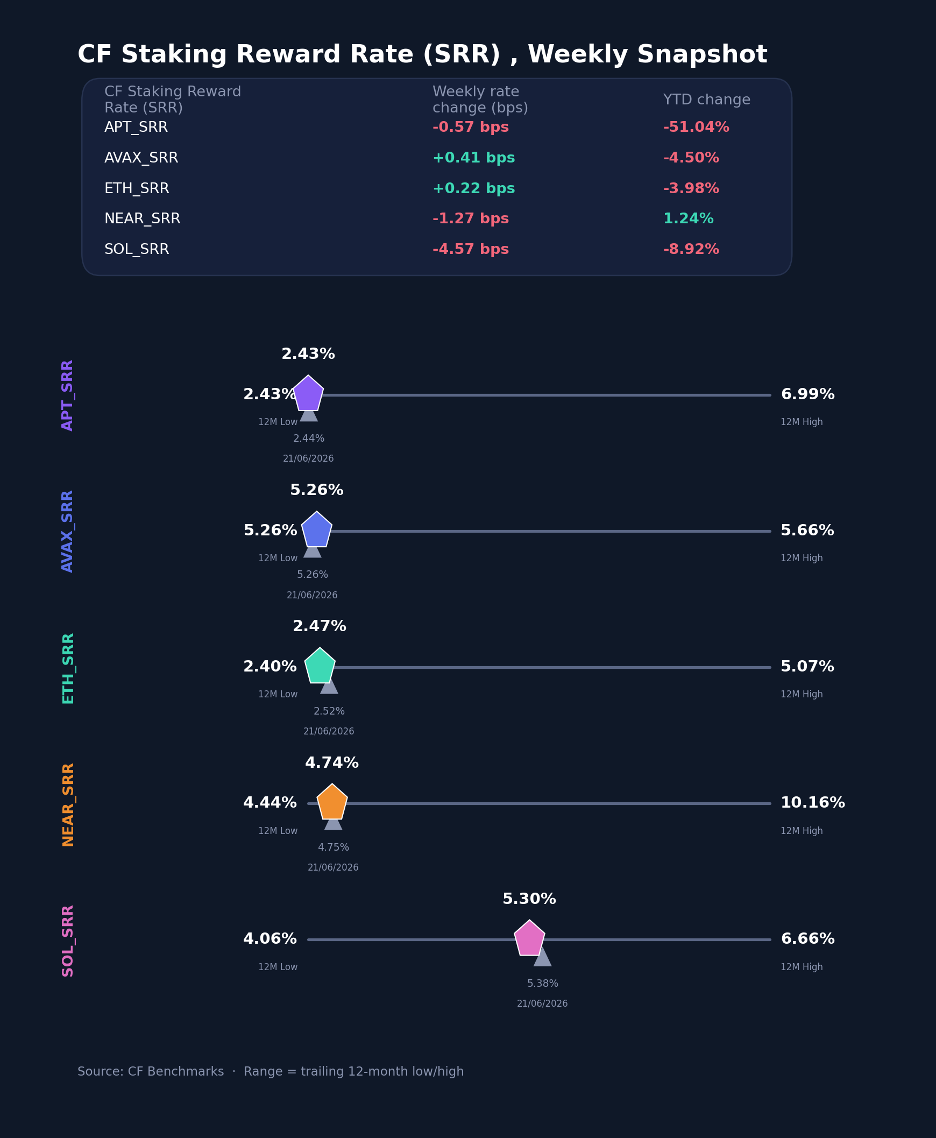
Within the CF Staking Series, relative index returns stayed close to flat, well above the spot losses in the same assets. APT Staking rewards declined -0.2%, easing from 2.4354% to 2.4296%, a -0.6 bps change. AVAX Staking gained +0.1%, its reward rate up from 5.2606% to 5.2644%, a 0.4 bps change. ETH Staking gained +0.1%, while its reward rate fell from 2.5198% to 2.4664%, a -5.3 bps move. NEAR Staking fell -0.3%, its reward rate down from 4.7538% to 4.7399%, a -1.4 bps change. SOL Staking dropped -0.9%, the largest move of the five, with the largest reward-rate decline, from 5.3784% to 5.3050%, a -7.3 bps move. Reward-rate changes ran from -7.3 bps to 0.4 bps, with SOL accounting for most of the range; reward-rate levels ran from APT's 2.4296% to SOL's 5.3050%.
Interest Rate Analysis
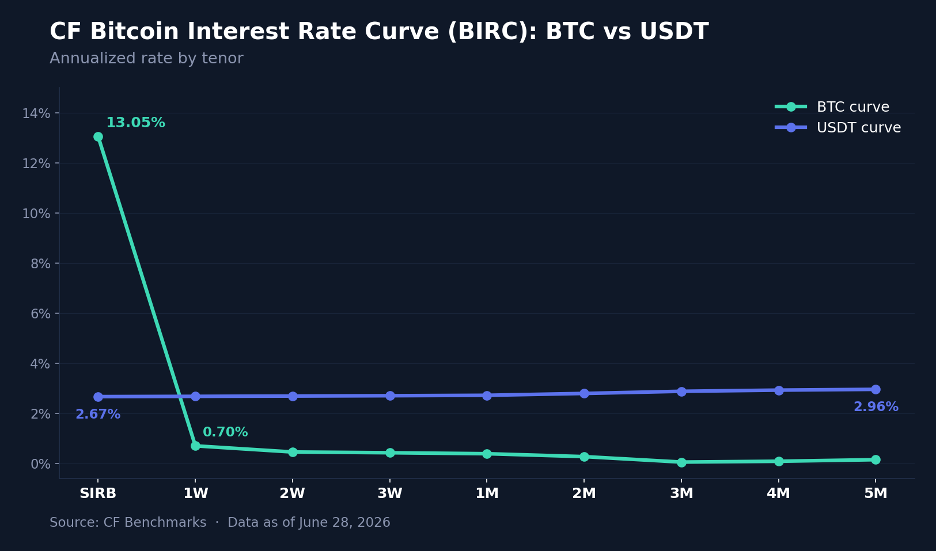
Funding conditions ended the week with the Bitcoin overnight benchmark down and the BTC term curve lower, against a flat USDT curve. BTC SIRB, the session rate, fell from 14.11% to 13.05%, a -106.1 bps change, while the BTC 1W tenor rose from 0.37% to 0.70%, up 32.7 bps. The belly of the BTC curve fell: 1M -45.6 bps, 2M -53.1 bps and 3M -19.4 bps, while the back end rose, 4M +8.3 bps and 5M +14.5 bps. The USDT curve barely moved: USDT SIRB eased 1.4 bps to 2.67%, the front end moved less than 1.5 bps, and the back end rose 6.3 bps at 4M and 6.9 bps at 5M. Across both curves, tenor changes ran from -106.1 bps to 32.7 bps. The overnight benchmark down 106.1 bps with the 1-week up 32.7 bps and the belly lower is the funding signature of a positioning unwind, with term carry little changed; the same deleveraging that hit spot showed up in the BTC front end, while the USDT curve held.
Closing Synthesis
The week was macro-led and uniform. A hotter annual inflation print landed during record ETF redemptions and a roughly $1.26bn liquidation, and the capitalization indices, the classification themes and most DACS sub-categories fell within a few points of each other. The exceptions were narrow: Value and lower-beta exposure in the factor set, the DeFi index held up by AAVE and JTO, and SOL and AVAX at the firmer end of the single-asset set. BVXS rebuilt a 4.27 vol. point premium over realized, and the BTC session rate fell 106.1 bps, both consistent with hedging and deleveraging into the inflation print. The week reads as macro-driven de-risking with a few idiosyncratic gains, and the 2026 drawdown is intact.
The information contained within is for educational and informational purposes ONLY. It is not intended nor should it be considered an invitation or inducement to buy or sell any of the underlying instruments cited including but not limited to cryptoassets, financial instruments or any instruments that reference any index provided by CF Benchmarks Ltd. This communication is not intended to persuade or incite you to buy or sell security or securities noted within. Any commentary provided is the opinion of the author and should not be considered a personalised recommendation. Please contact your financial adviser or professional before making an investment decision.
Note: Some of the underlying instruments cited within this material may be restricted to certain customer categories in certain jurisdictions.
Changes to the Token Market Price Benchmarks Series - Market Prices – 21 July 2026
The Administrator has confirmed changes to the Token Market Price Family for the period 14 July 2026 to 21 July 2026.

CF Benchmarks
Softer CPI Reprices July Hike Risk & Lifts Digital Assets
Digital assets extended their recovery over the past week as cooler US inflation prints repriced Fed expectations; the bid was broad across the large cap indices, growth factor leadership returned, stablecoin funding repriced lower, and stress stayed isolated in names hit by token-specific news.
Mark Pilipczuk
Notice of the Demising of CF Dai-Dollar Settlement Price and Spot Rate
The Administrator announces that it will demise the CF Dai-Dollar Settlement Price (DAIUSD_RR) and CF Dai-Dollar Spot Rate (DAIUSD_RTI) which are members of the CF Digital Asset Index Family.
CF Benchmarks
By clicking Accept, you consent to CF Benchmarks's use of cookies.
Visit Cookie Settings to learn how CF Benchmarks uses cookies and to adjust your preferences.