
Jun 08, 2026
Hot Data Fuels “Higher for Longer” Fears as Market Sell-Off Accelerates
Weekly Index Highlights, June 8, 2026
Digital assets sold off hard and broadly over the past week, and the through-line was macro. A run of upside US data, capped by a May employment report on June 5th that printed nonfarm payrolls of 172,000 against a consensus near 80,000, repriced the rates path toward higher-for-longer and pulled digital assets lower in near-unison. Asset class specific catalysts amplified the move: US spot Bitcoin exchange-traded funds (ETFs) ran a record multi-day net-outflow streak that reached roughly $4.3bn, and Strategy disclosed its first net Bitcoin sale since 2022. The signatures of a macro de-risking were everywhere: implied volatility jumped, low-beta factors led, smaller and higher-beta names underperformed, and the Bitcoin funding curve dislocated at the front end. Our read is that this was a rates-driven, complex-wide risk-off rather than anything crypto-idiosyncratic.
Market Performance Update
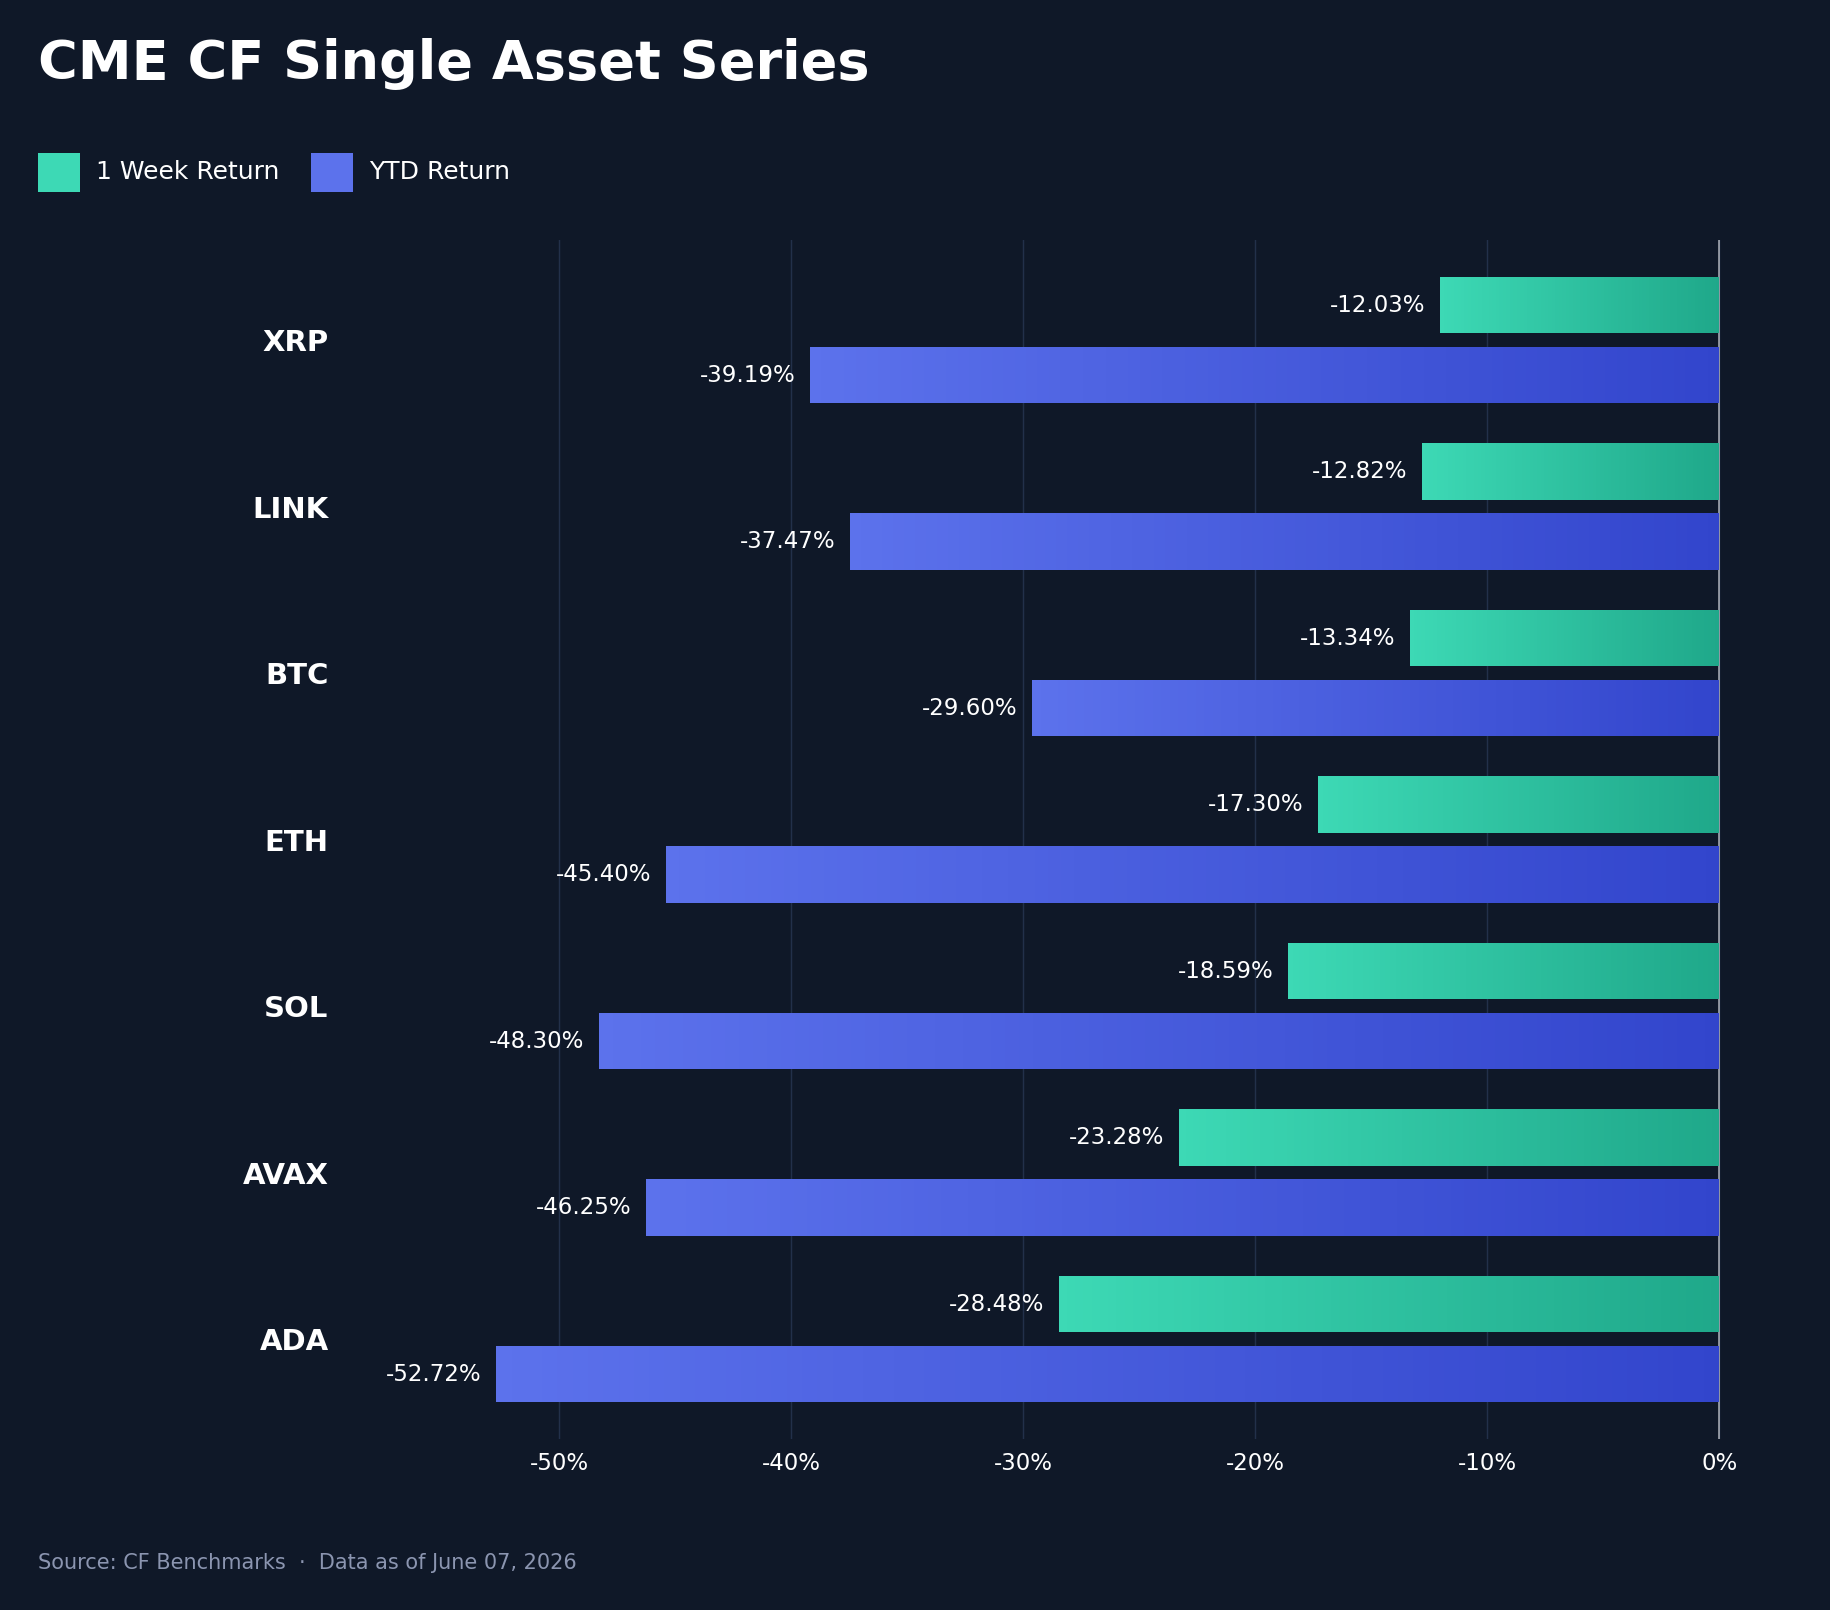
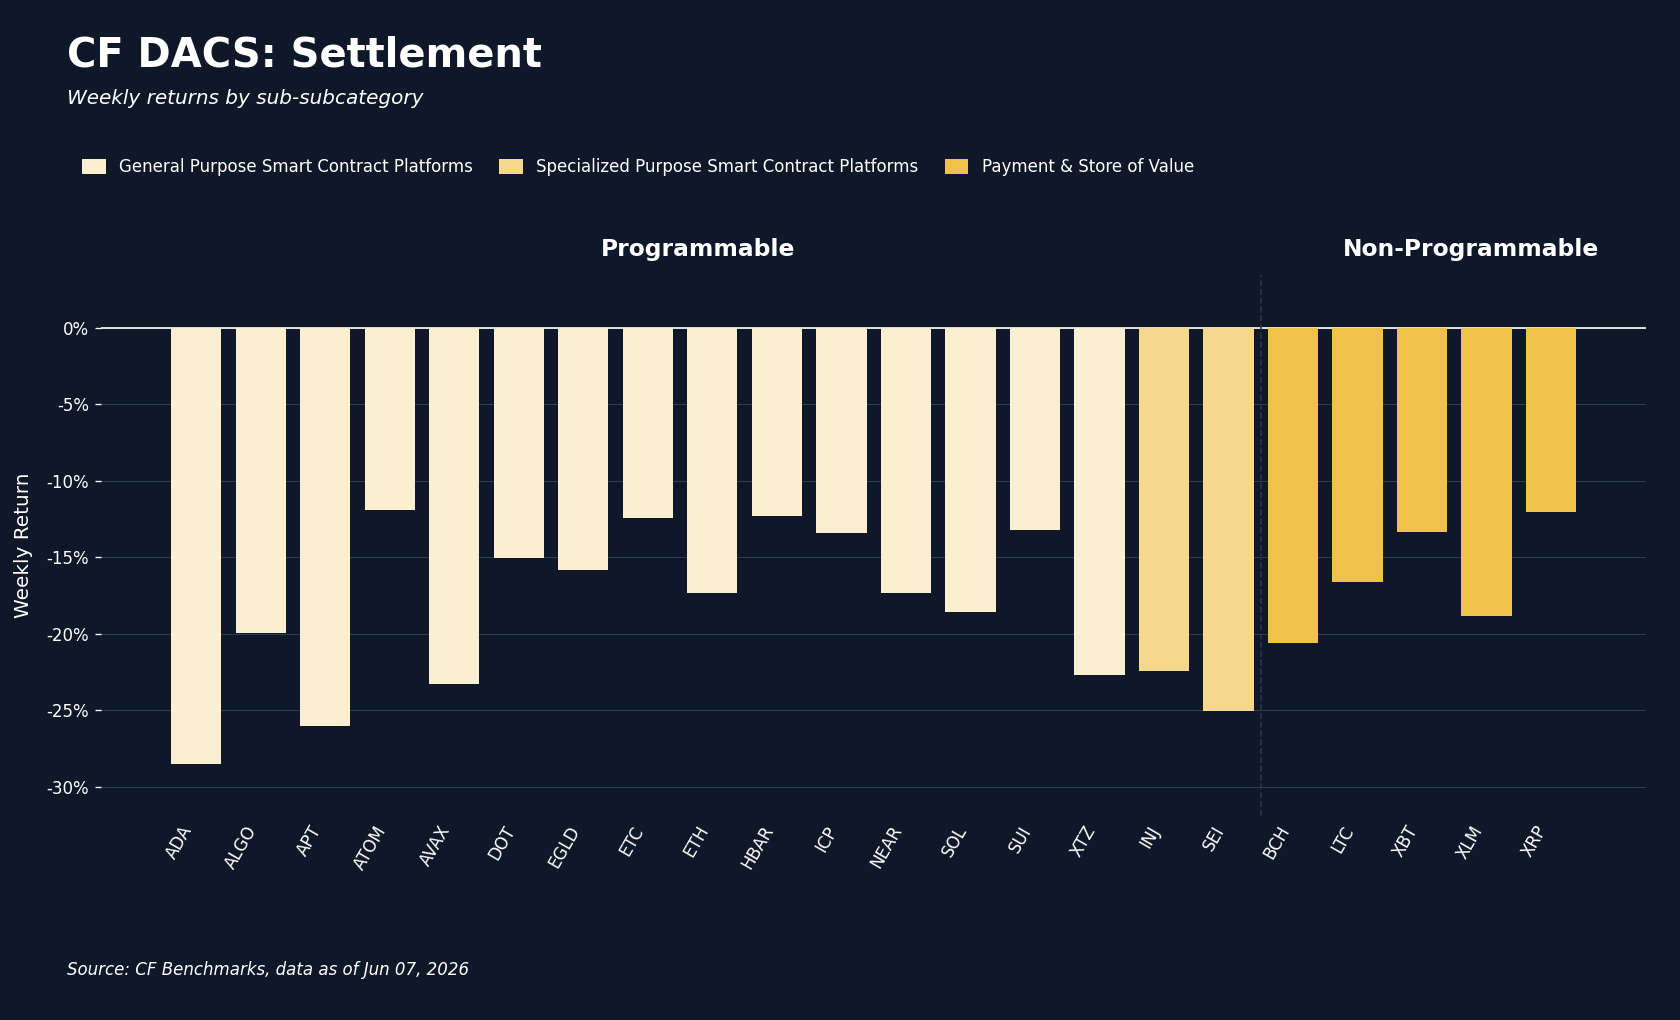
Every large-cap single asset fell by double digits on the week. Measured week-on-week (w/w), XRP (XRP) held up best at -12.0%, followed by Chainlink (LINK) at -12.8% and Bitcoin (BTC) at -13.3%; Ether (ETH) fell -17.3%, Solana (SOL) -18.6%, Avalanche (AVAX) -23.3%, and Cardano (ADA) -28.5%. The spread between the best and worst large cap was a 16.5 percentage point (pp) gap, but the more telling feature was the ordering: the lower-beta majors (XRP, LINK, BTC) cushioned the move while the higher-beta names (SOL, AVAX, ADA) bore the brunt, the pattern a higher-for-longer repricing tends to produce. The macro catalyst was concrete. A run of hot US data, ISM Manufacturing and Services, JOLTS job openings and ADP private payrolls, culminated in the May payrolls beat on June 5th; the 10-year Treasury yield rose to about 4.54% and the dollar firmed, and Bitcoin took its worst session of the week into and after the print, trading to an intraday low near $59,100, its weakest level since October 2024, with roughly $1.7bn of mostly long liquidations in the surrounding 24 hours. Two crypto-specific catalysts added to the pressure: Strategy's first disclosed Bitcoin sale since 2022, reported June 1st, and the record spot-ETF redemption streak. Year-to-date (YTD), the complex is now deeply negative, ranging from BTC at -29.6% to ADA at -52.7%.
Volatility Analysis
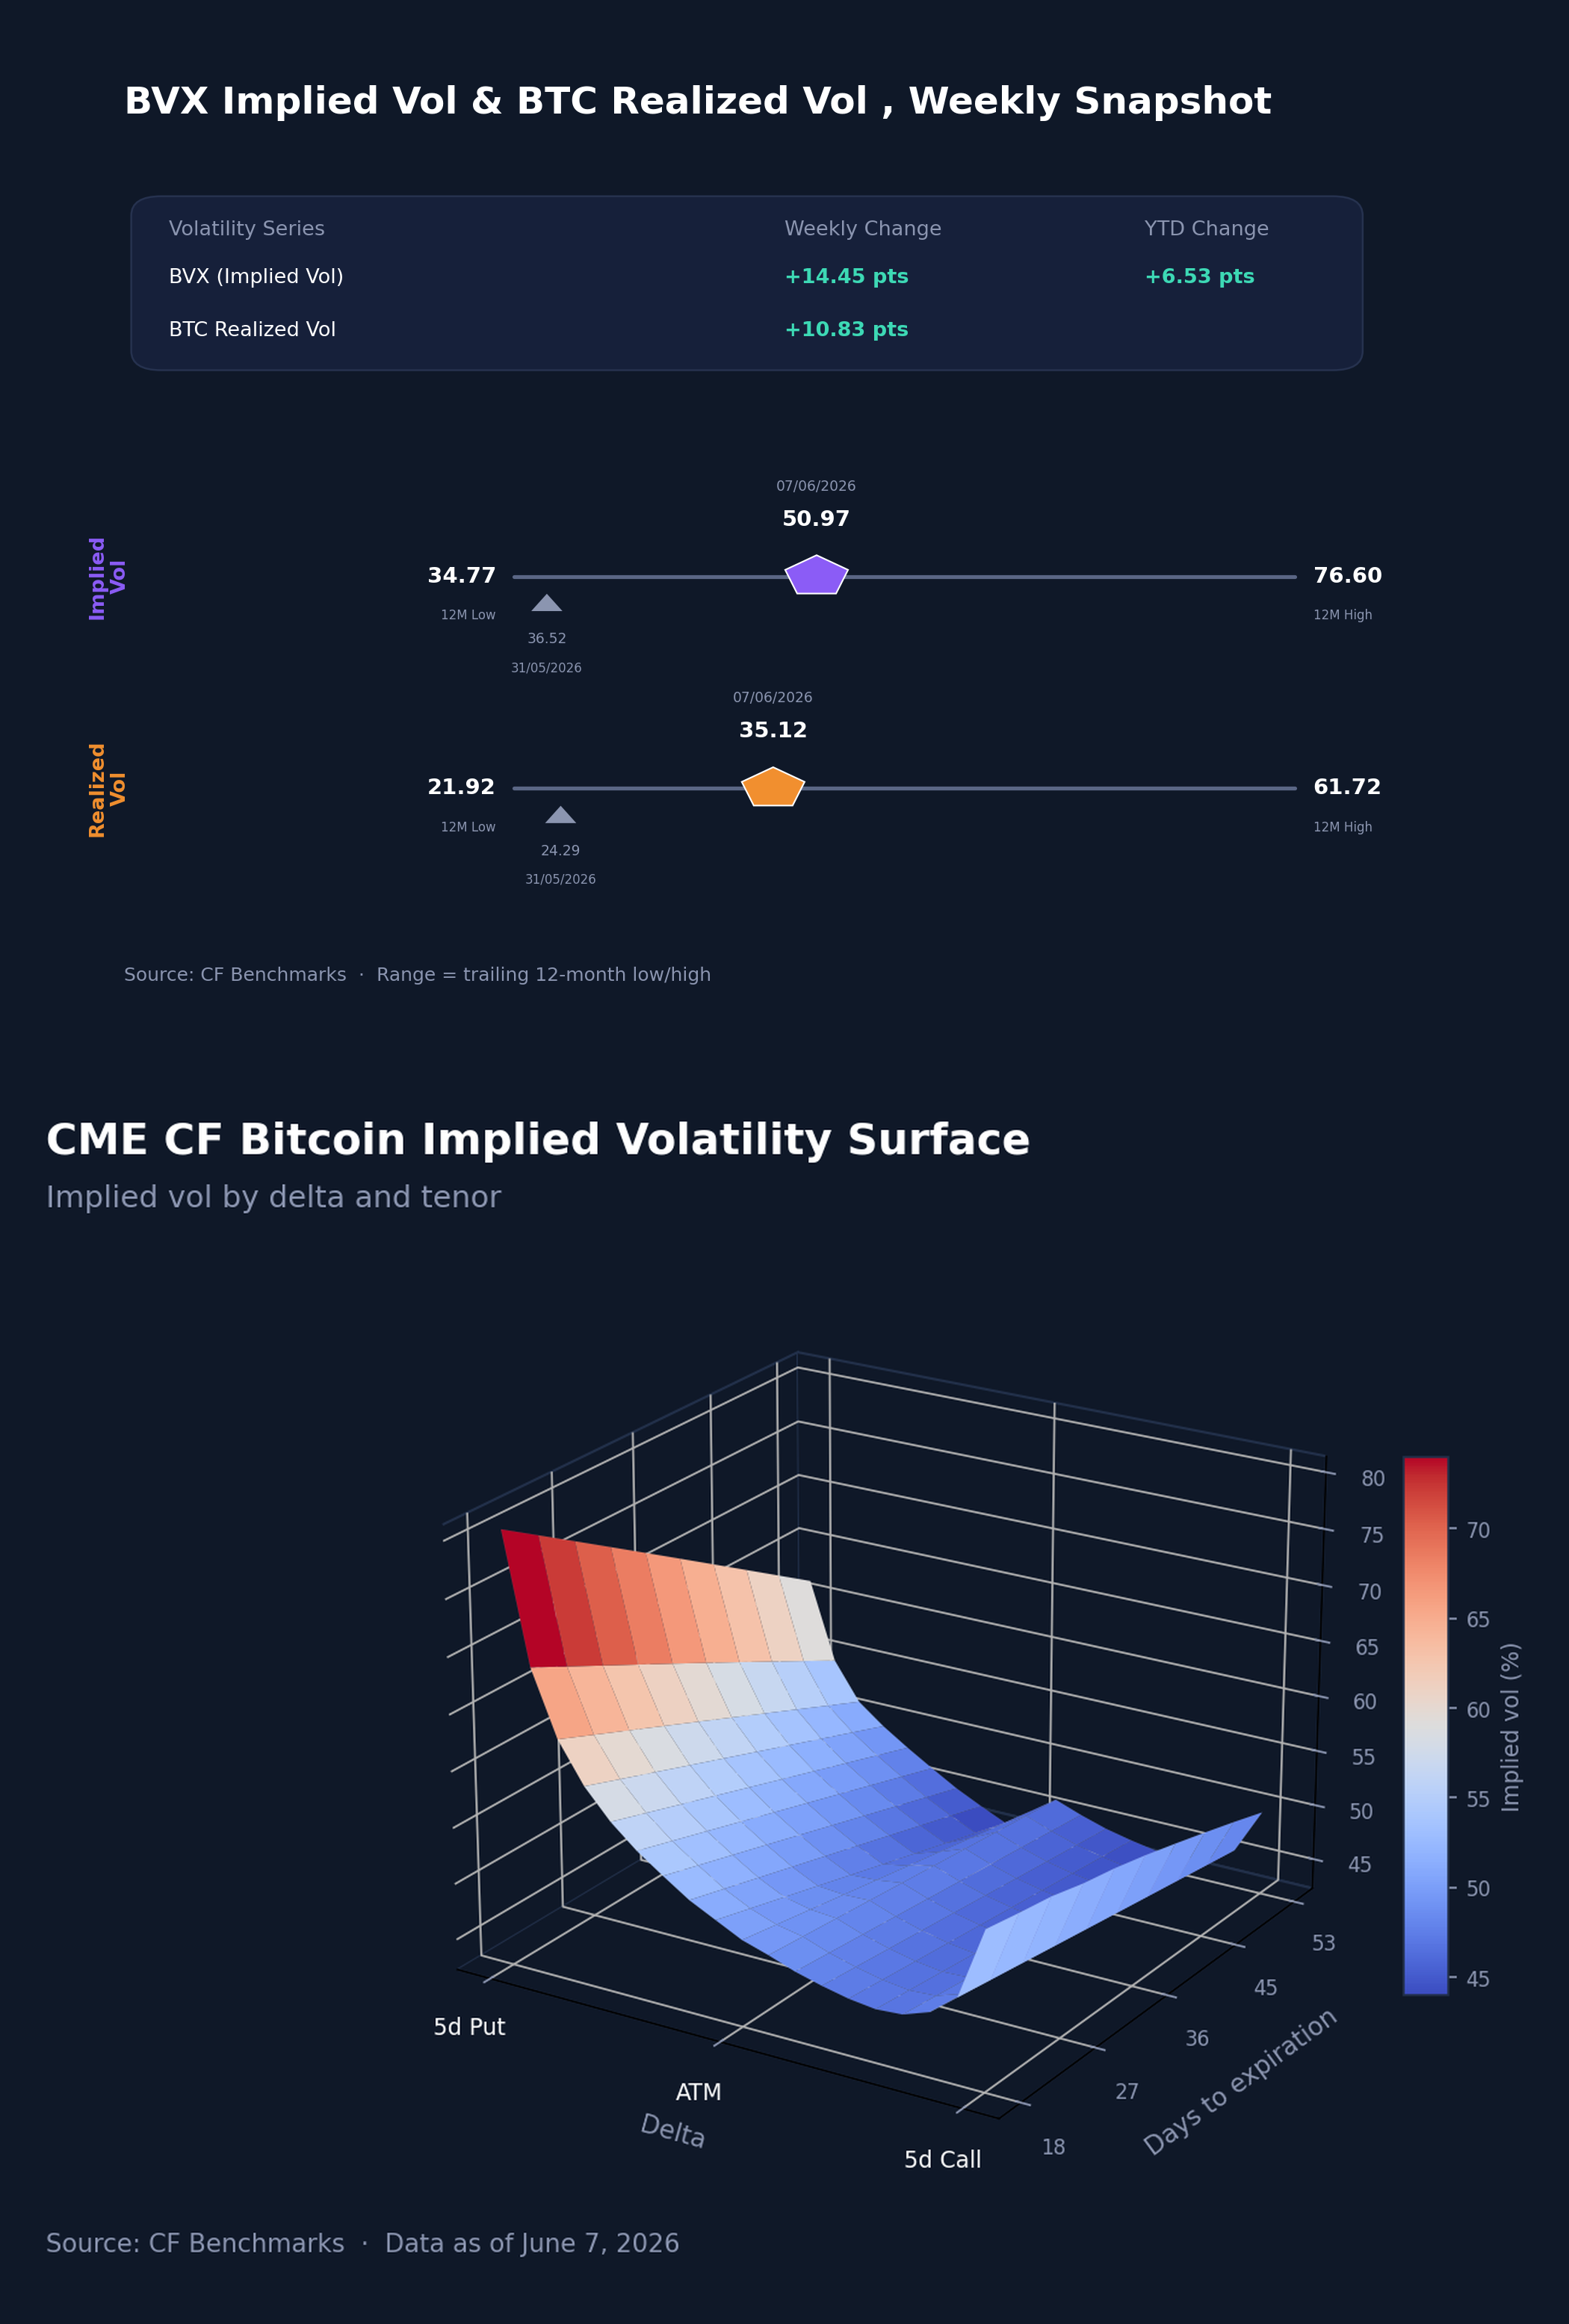
Volatility repriced sharply higher as the selloff accelerated. The CME CF Bitcoin Volatility Index Settlement (BVXS) rose from 36.52 a week earlier to 50.97, a 14.45 vol. point increase, while 30-day realized volatility climbed from 24.29 to 35.12, up 10.83 vol. points. Implied led realized: the implied-minus-realized spread widened from 12.23 to 15.85 points, the market paying up for protection into the macro risk event rather than simply catching up to it. The intraweek path tracked the data flow, with BVXS climbing from 38.67 on June 1st to a peak of 53.32 on Friday June 5th, the payrolls day, before easing to 50.97 by Sunday. For all the move, the level still sits within its range: implied volatility ended at 50.97 against a trailing 12-month band of 34.77 to 76.60, and realized at 35.12 against 21.92 to 61.72. The configuration is consistent with an orderly, macro-driven de-risking, elevated and rising, but short of the panic the upper end of the 12-month range would imply.
Market Cap Index Performance
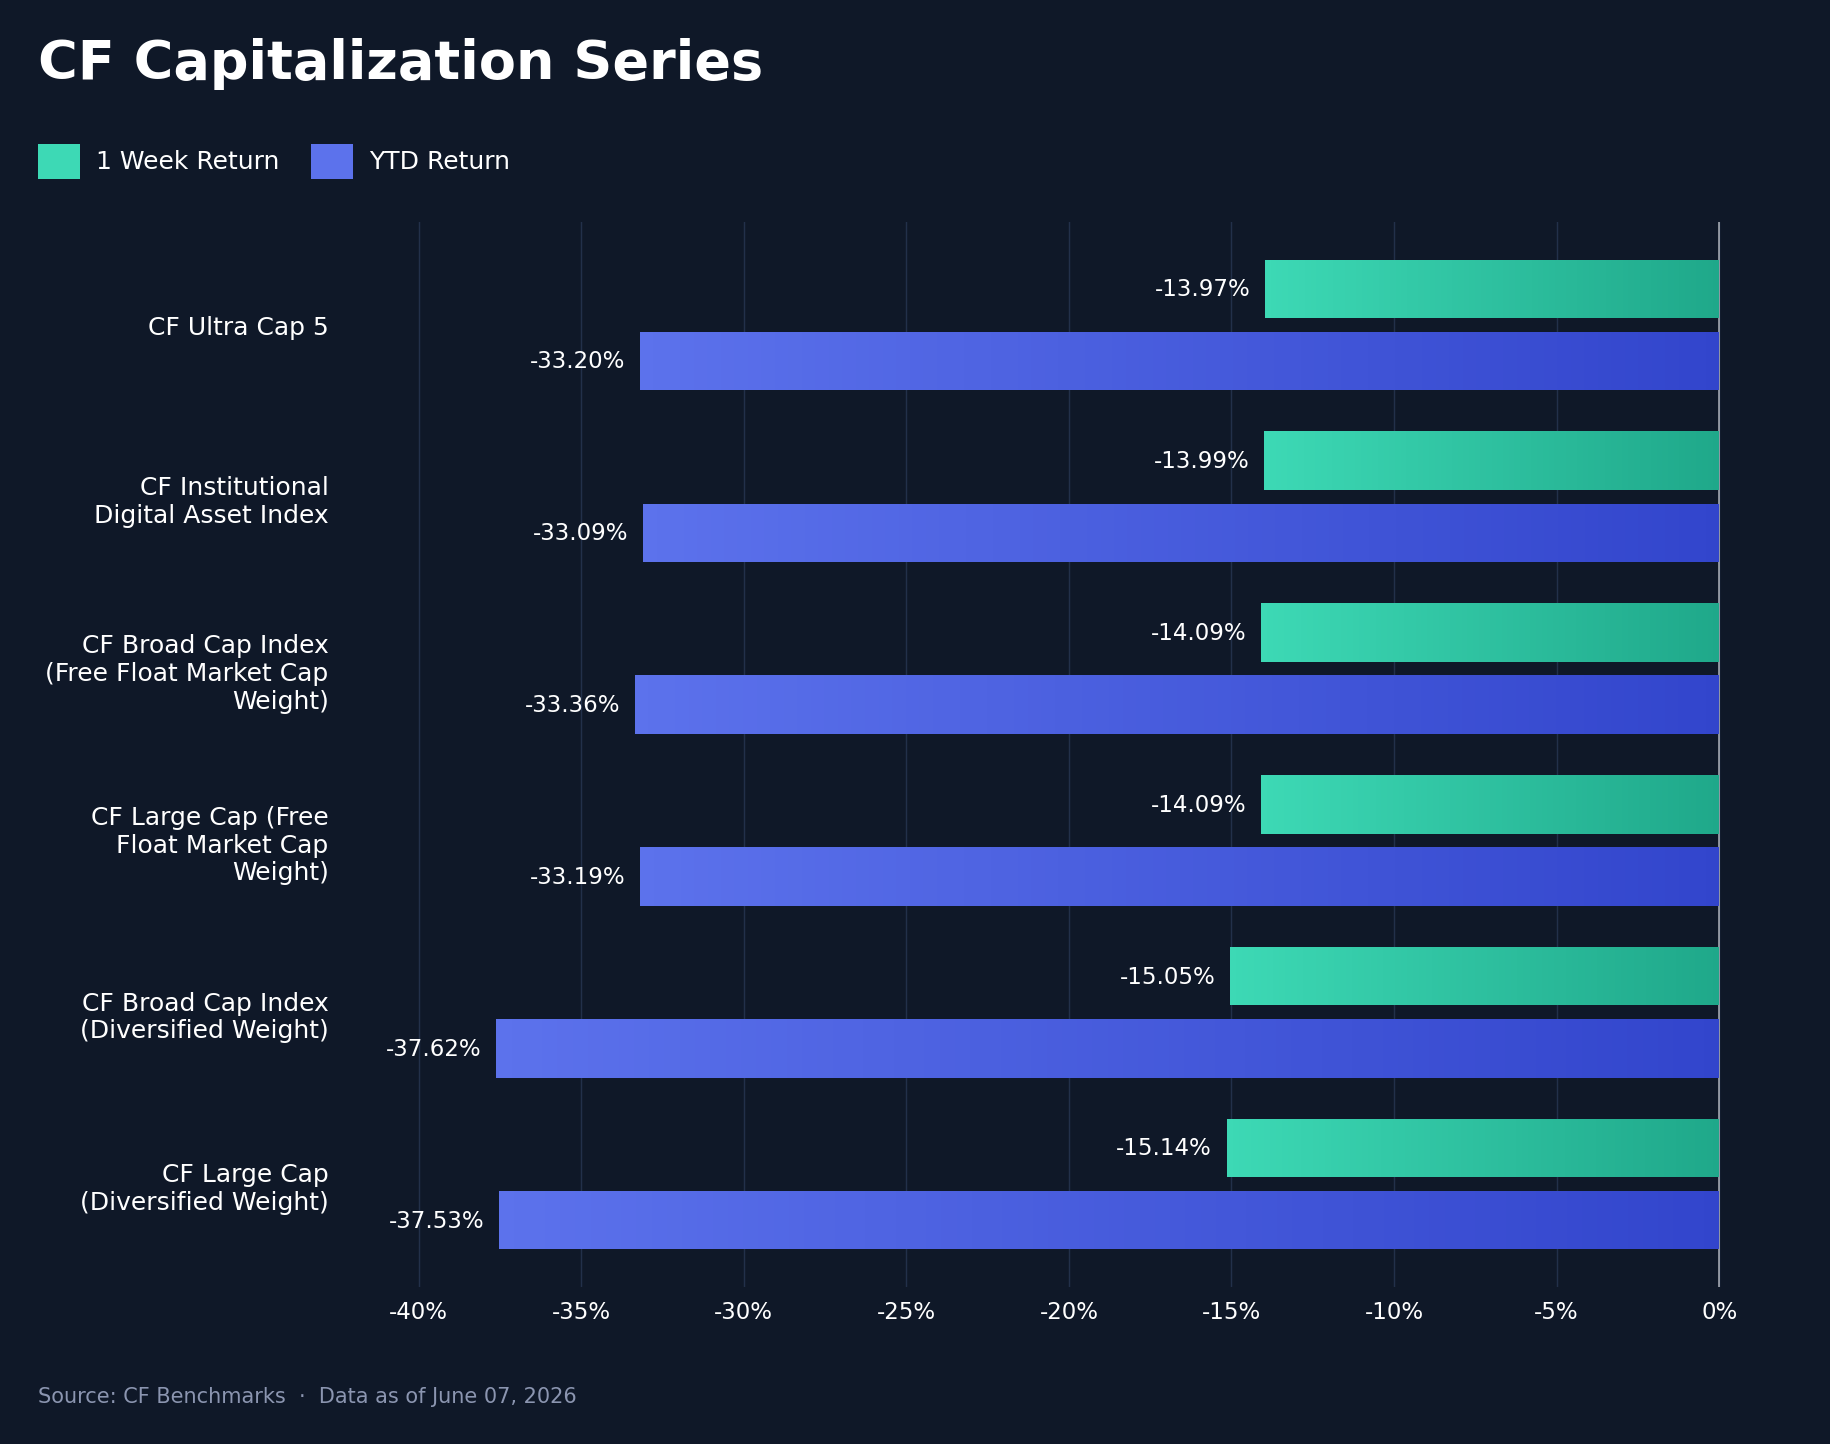
The drawdown was broad-based across the CF Capitalization Series, with all six headline indices clustered near -14% to -15% on the week. The free-float-weighted and concentrated indices held up marginally better, CF Ultra Cap 5 at -13.97% and the CF Institutional Digital Asset Index at -13.99%, with the CF Broad Cap and CF Large Cap free-float indices both at -14.09%; the diversified-weighted versions lagged, CF Broad Cap Diversified at -15.05% and CF Large Cap Diversified at -15.14%. That left the diversified indices trailing their free-float counterparts by roughly 1.0 pp, the signature of a beta event in which smaller and lower-weight constituents are hit hardest as financial conditions reprice. The macro impulse hit the whole complex rather than rotating within it: the same run of upside data surprises that lifted yields pressured the broad-cap indices in unison, and the crypto-specific flow reinforced the direction, with a record spot-ETF outflow streak of roughly $4.3bn and Strategy's disclosed Bitcoin sale adding selling across the complex rather than to a single name. On a YTD basis the series spans roughly -33% for the free-float and concentrated indices to about -37.5% for the diversified versions.
Factor Analysis
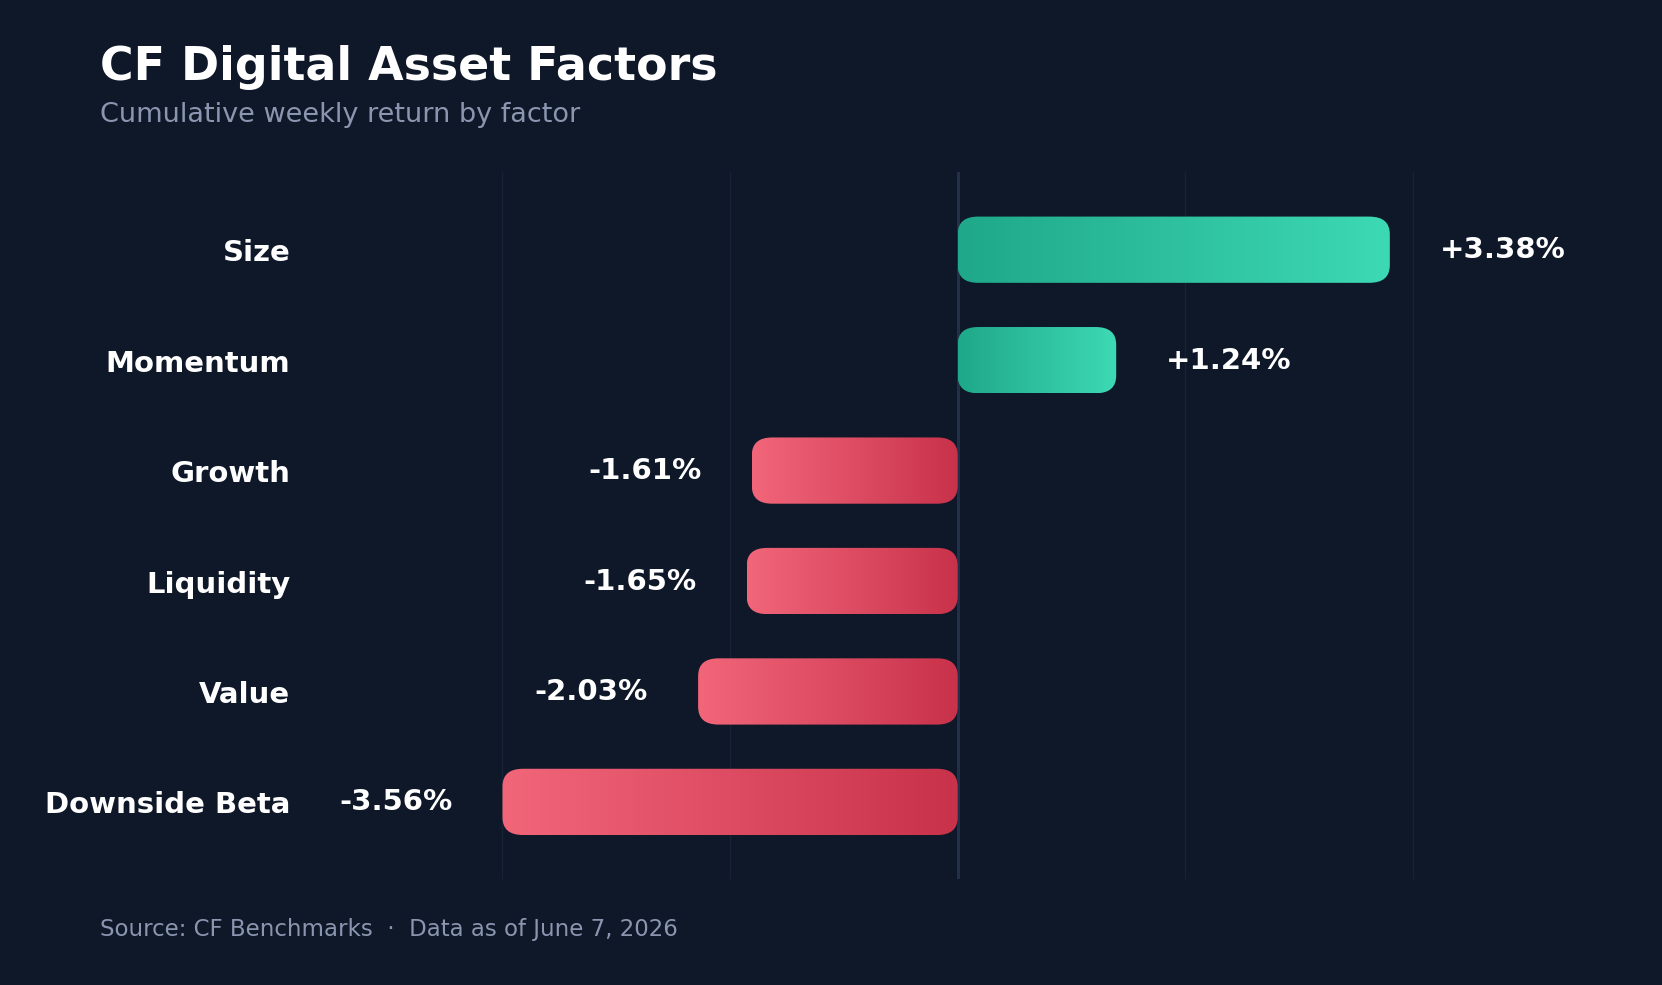
Factor performance carried the clearest fingerprint of a risk-off week. Of the six CF factors, only the two most defensive posted gains: Size at +3.4% and Momentum at +1.2%. The rest were negative, Growth -1.6%, Liquidity -1.7%, Value -2.0%, and Downside Beta the worst at -3.6%, a 6.9 pp spread between the best and worst factor. The rotation versus the prior week was the story. Downside Beta swung from +2.4% to -3.6%, a 6.0 pp reversal, as high-beta exposure was punished; Size flipped from -1.7% to +3.4%, a 5.1 pp swing into the lower-beta, larger names; and Growth and Momentum both improved off the prior week's losses. Taken together, the factor tape is textbook late-stage de-risking: leadership concentrated in low-beta and size, with the most cyclical, highest-beta exposures bearing the losses.
Read our latest weekly crypto factors report: Factor Friday - June 5, 2026
Classification Series Analysis
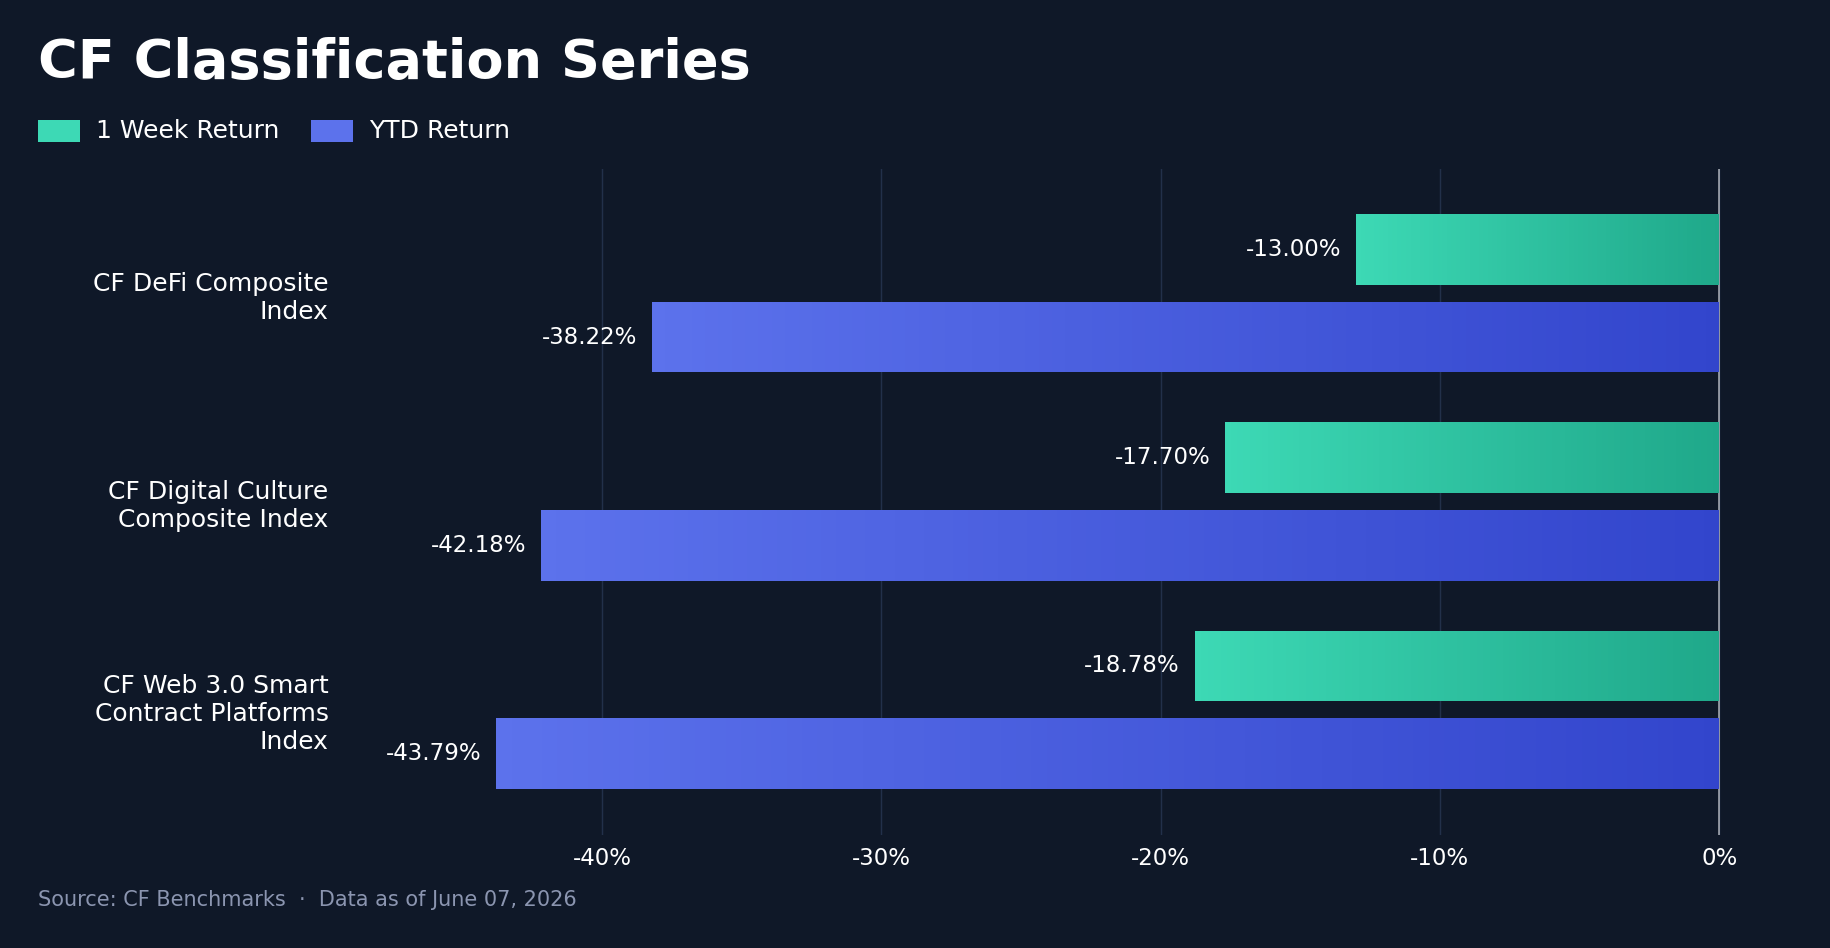
The classification composites told the same story through a sector-beta lens. The CF DeFi Composite Index was the most resilient at -13.0% w/w, ahead of the CF Digital Culture Composite Index at -17.7% and the CF Web 3.0 Smart Contract Platforms Index at -18.8%, a 5.8 pp gap between the best and worst composite. The leadership ordering is consistent with the single-asset and factor reads: the high-beta smart-contract platforms, home to the large layer-1 tokens that led on the way up, gave back the most, while DeFi's relative resilience reflected pockets of idiosyncratic strength. Year-to-date, the three composites remain deeply negative, from DeFi at -38.2% to Web 3.0 Smart Contract Platforms at -43.8%.
Sector Analysis
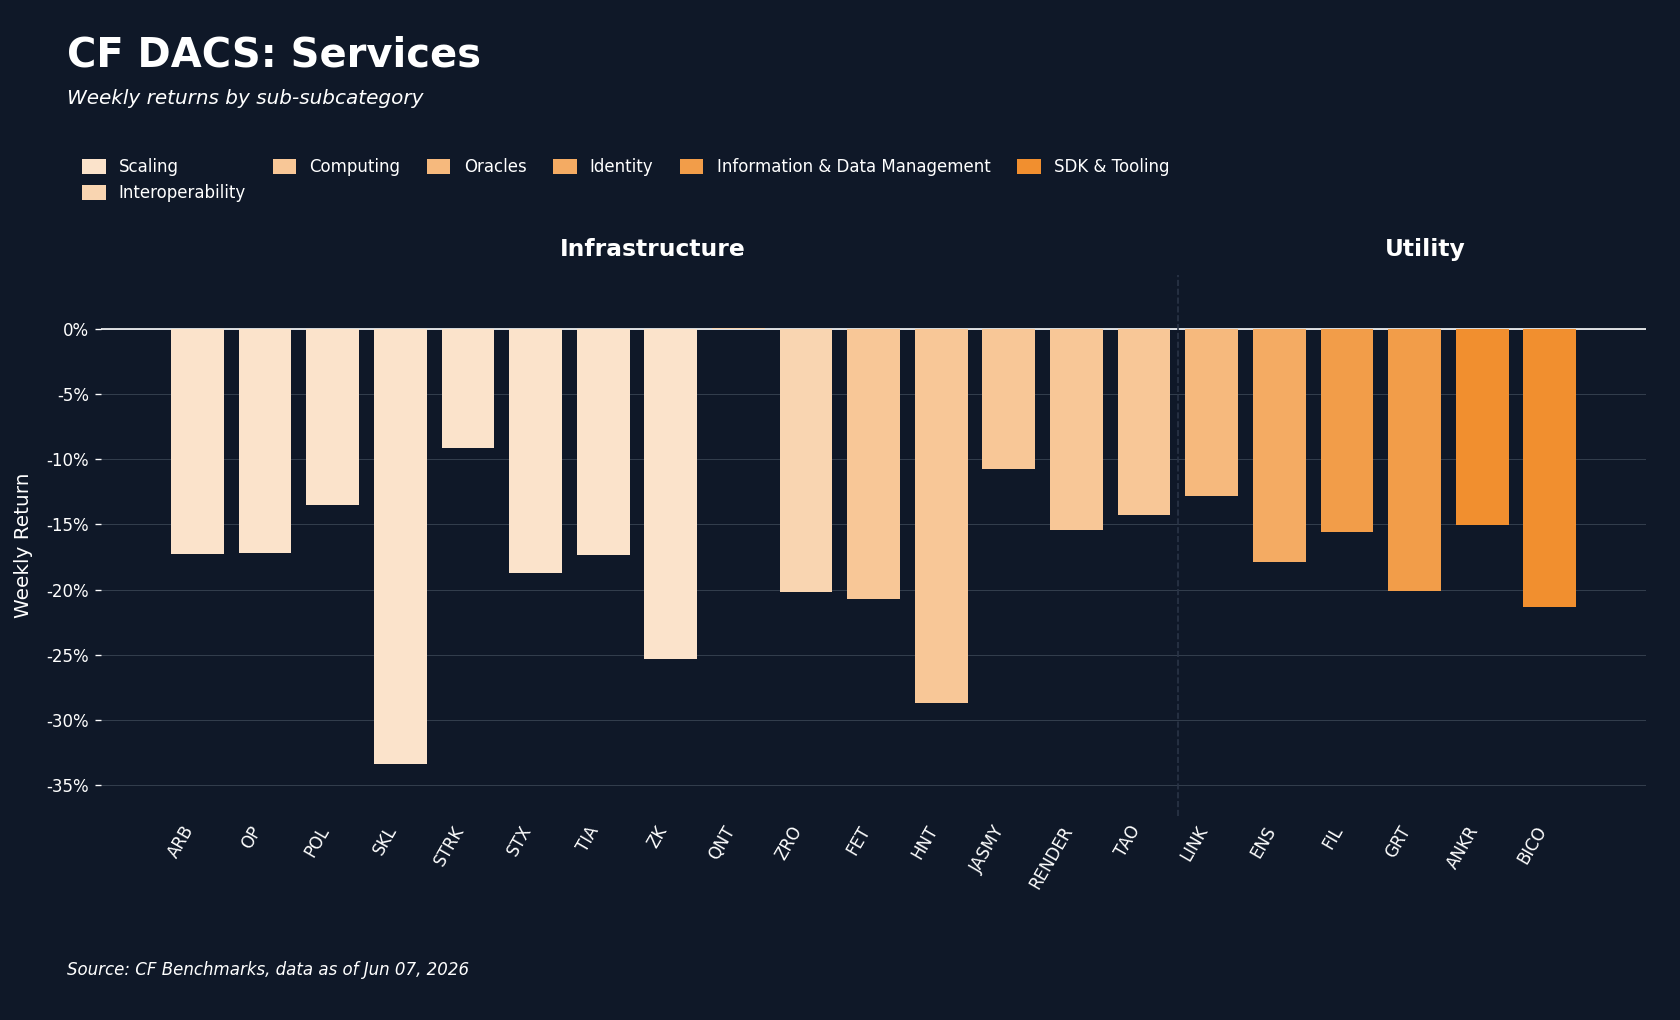
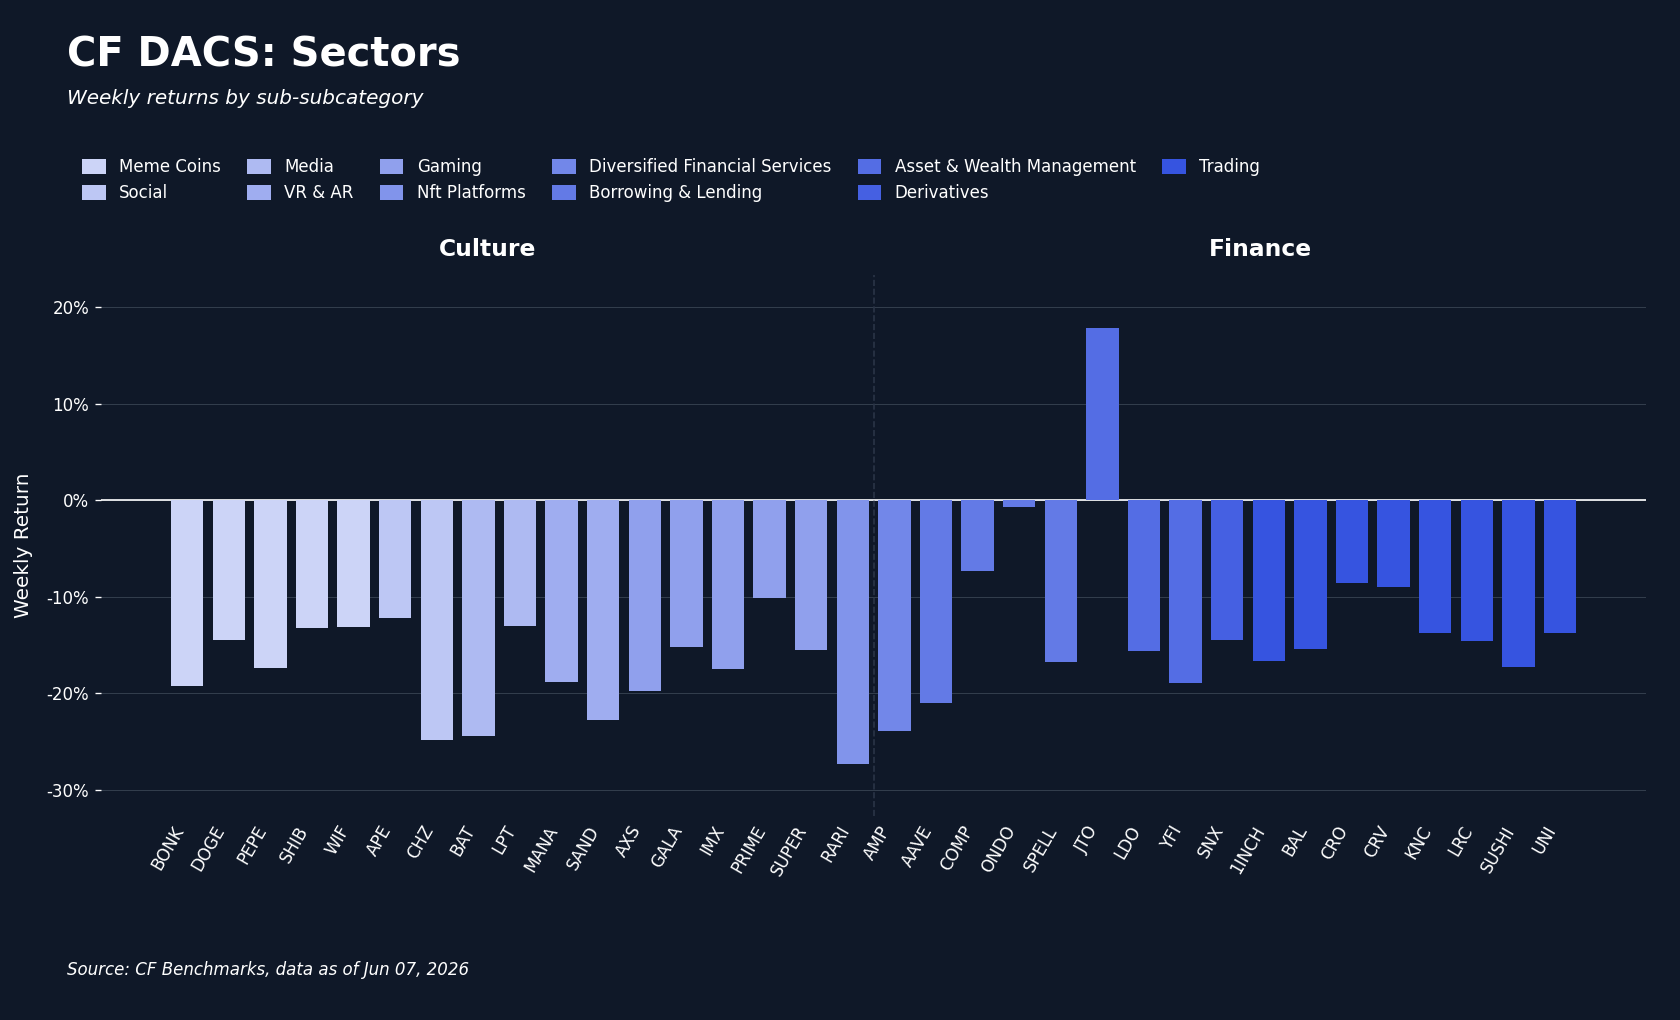
Across the CF DACS Sub-Categories the losses were broad but uneven. Finance was the most resilient sector at -12.4% on the week, followed by Non-Programmable at -16.3%, Utility at -17.1%, Infrastructure at -17.4%, and Culture at -17.6%; Programmable was the weakest at -18.5%, leaving a 6.2 pp spread between the best and worst sub-category. The dispersion at the constituent level was far wider, and it was here that the week's one clear industry catalyst showed up. Jito (JTO) was the standout gainer, up 17.9% w/w in Finance, after Jito's head of governance laid out a 'Jito economy' and buyback narrative on June 1st that framed JTO as the network's value-accrual asset funded by revenue rather than emissions, a move that coincided with an 18% intraday gain in the token. We read that strength as catalyst-specific and concentrated in the one name: Finance as a sector was still down -12.4% on the week, so the JTO move lifted a leader and the spread rather than the sub-category. At the other end, the heaviest constituents were SKALE (SKL) at -33.3% and Helium (HNT) at -28.7%, both in Infrastructure, alongside Cardano (ADA) at -28.5% in Programmable. The full constituent range, from JTO at +17.9% to SKL at -33.3%, was a 51.2 pp spread, the widest in the complex and a reminder that even a broad beta selloff leaves room for idiosyncratic winners.
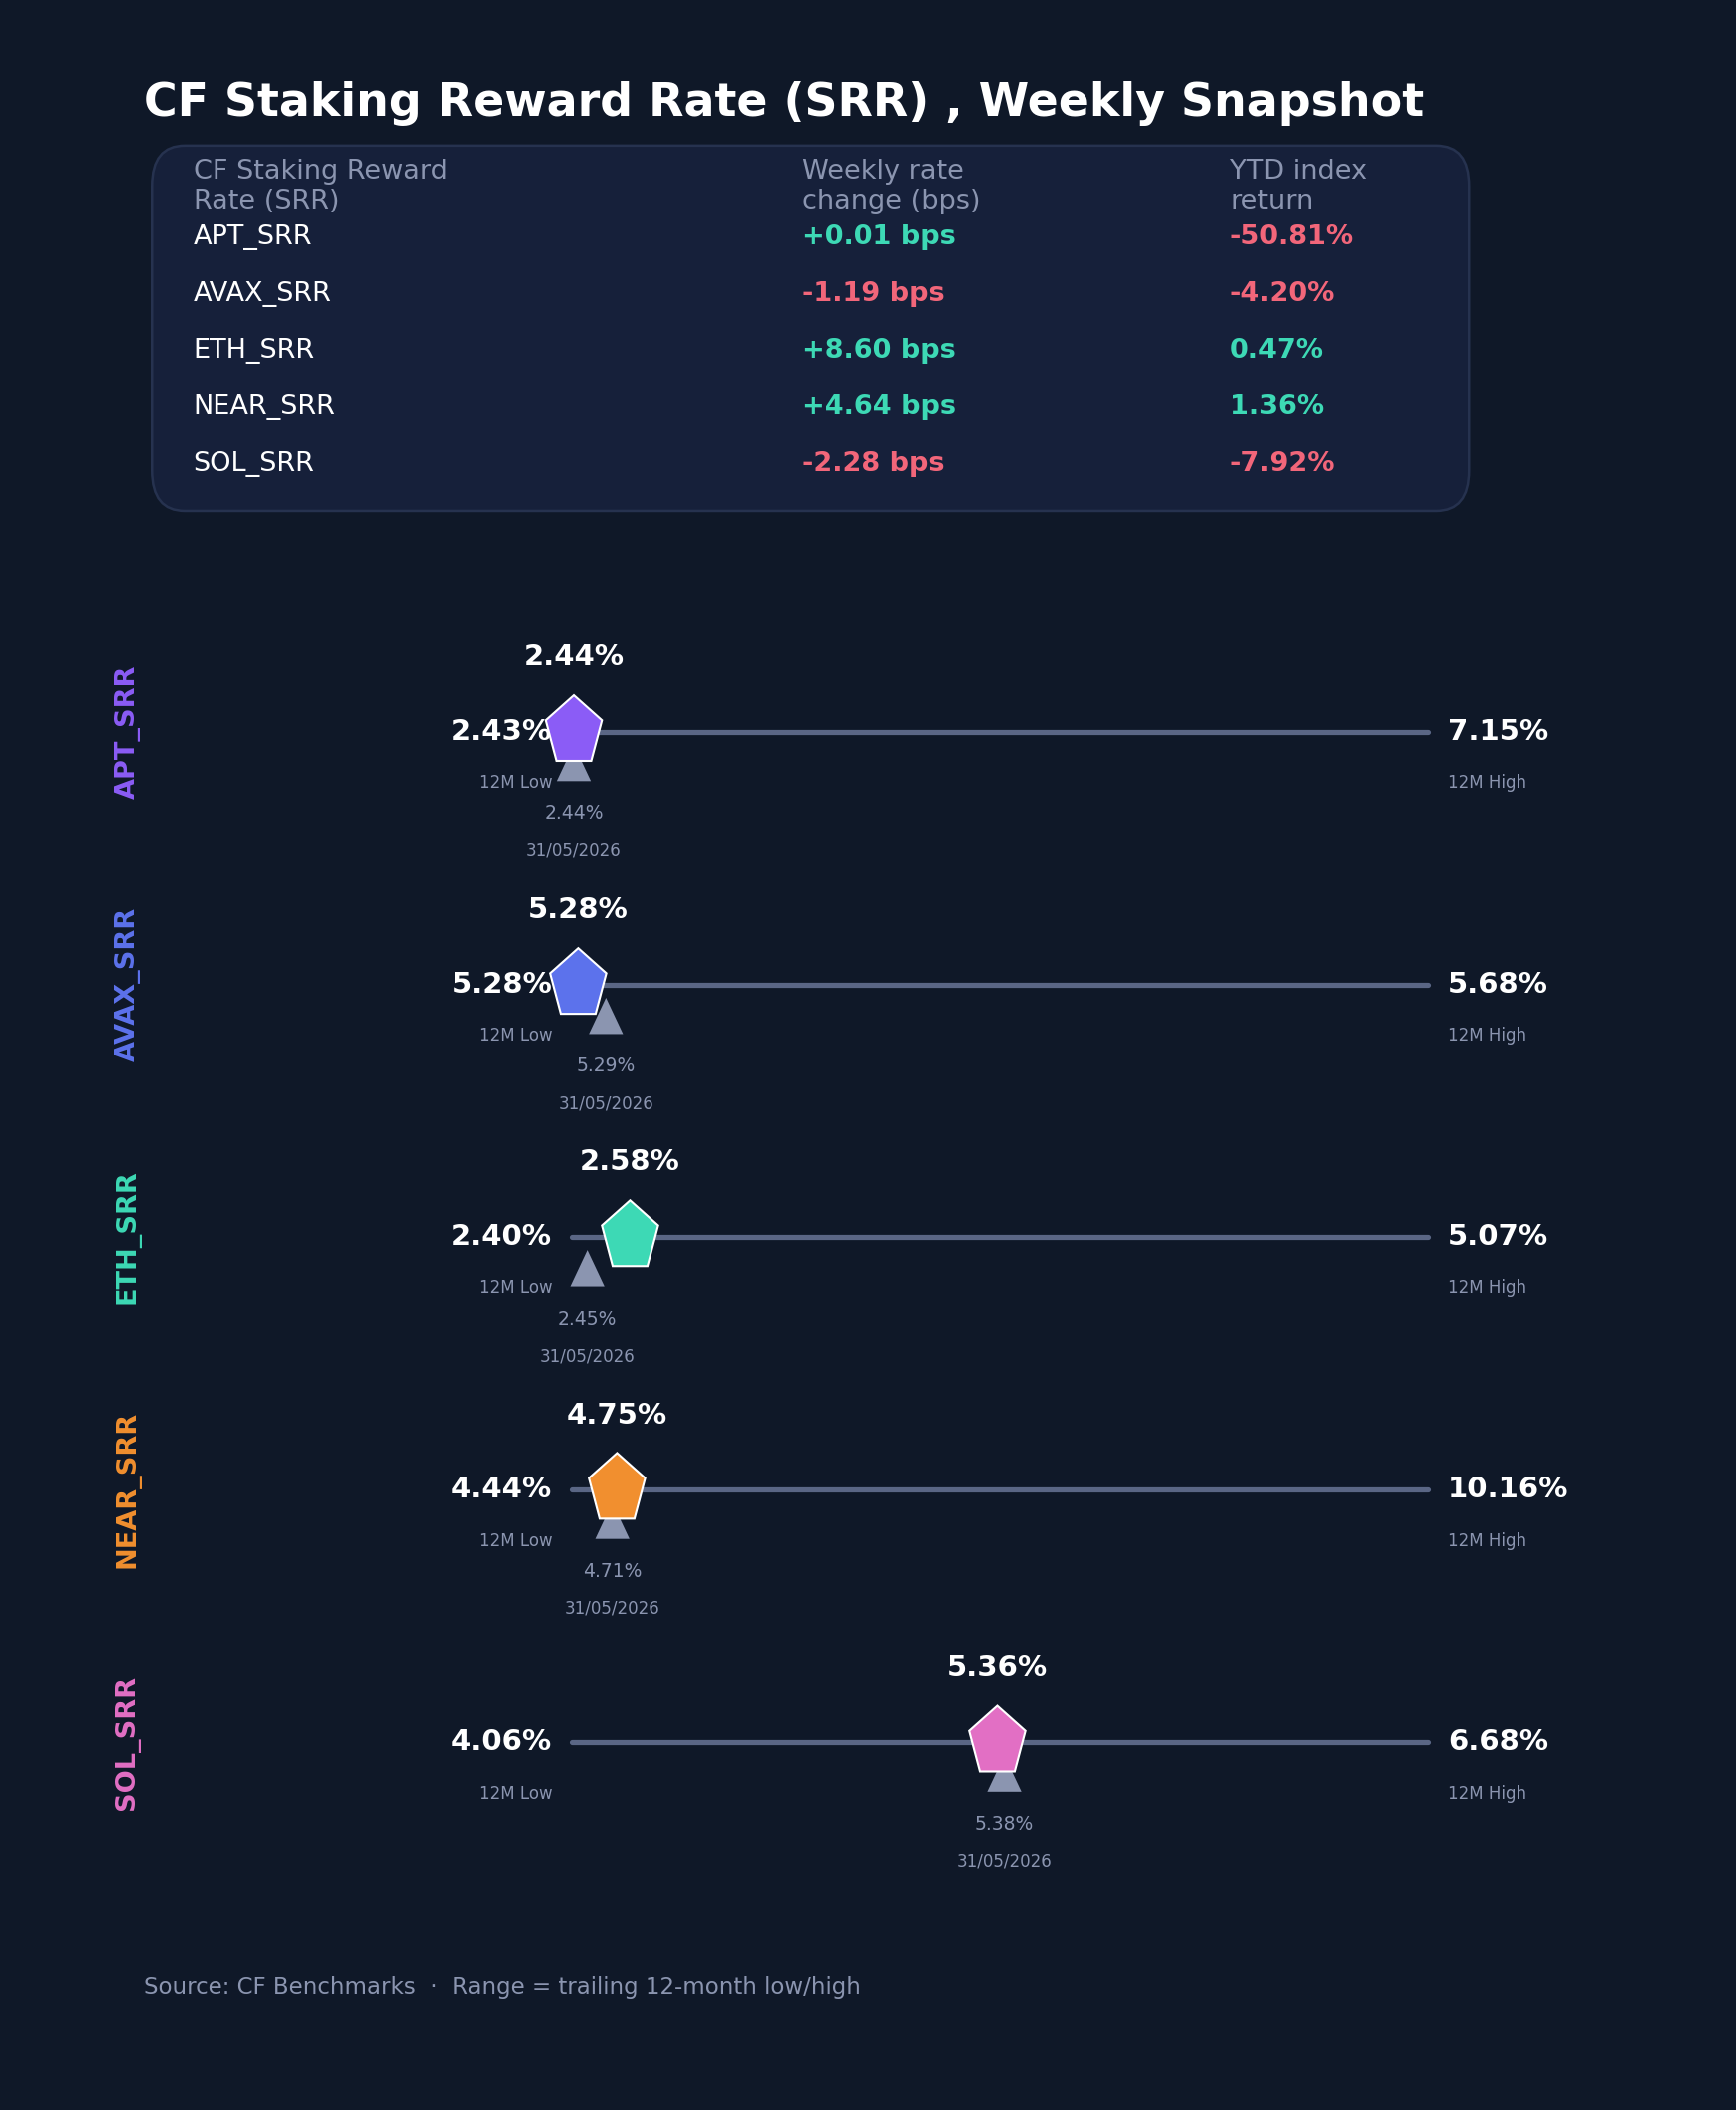
CF Staking Series
Staking returns and reward rates were muted relative to the spot selloff, moving on their own idiosyncratic factors rather than the macro tape. On a relative index basis, Ether (ETH) led at +3.4% on the week, with Near (NEAR) +1.0%, Aptos (APT) flat, Avalanche (AVAX) -0.2%, and Solana (SOL) -0.4%. Reward rates moved modestly: ETH's reward rate firmed the most, rising about 8.6 basis points (bps) to 2.5806%, and NEAR rose about 4.6 bps to 4.7454%, while SOL eased about 2.3 bps to 5.3632% and AVAX about 1.2 bps to 5.2810%; APT was essentially unchanged near 2.4414%. That left the reward-rate range across the set running from roughly 2.44% on APT to about 5.36% on SOL, with the weekly changes spanning a narrow band of roughly +8.6 to -2.3 bps. The takeaway is that the staking complex was a sideshow to the week's macro-driven price action.
Interest Rate Analysis
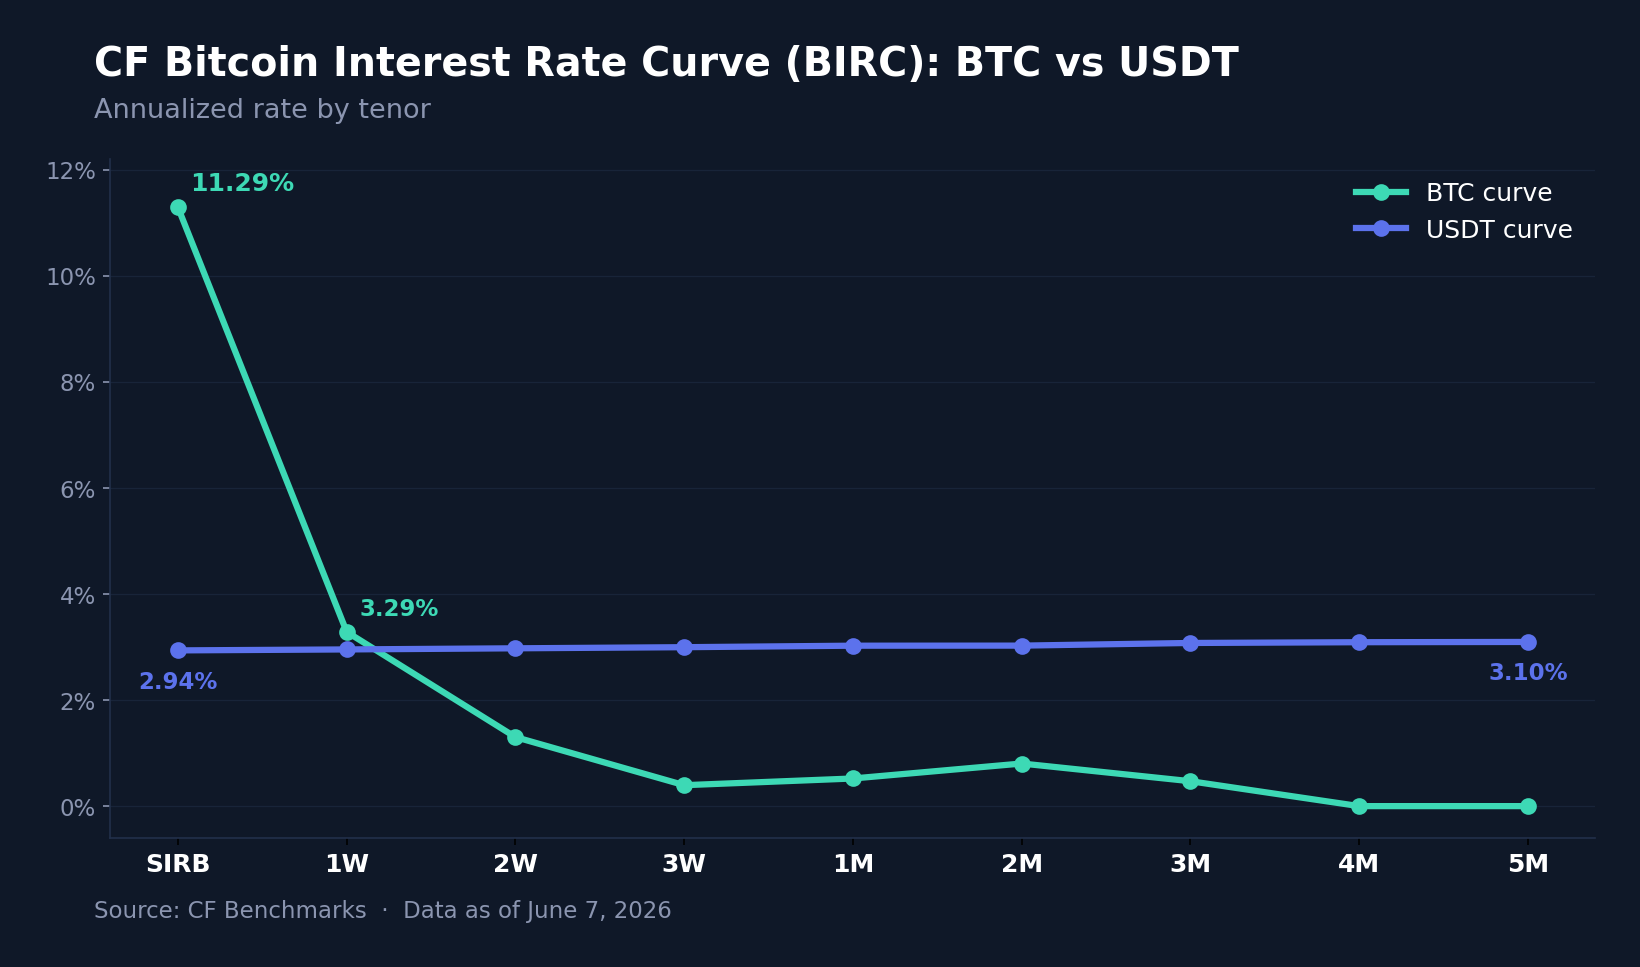
The funding curves closed the loop on the week's de-risking, and the action was all in Bitcoin's front end. On the CF Bitcoin Interest Rate Curve (BIRC), the BTC session rate (SIRB) blew out to 11.2888%, a 495 bps jump on the week, and the 1-week rate rose 49 bps to 3.2851%, even as term rates collapsed: the 2-week fell 64 bps to 1.3013%, the 3-week 69 bps to 0.3946%, and the 1-month through 3-month tenors all sat below 1%. The result was a deeply inverted, front-loaded BTC curve, a classic positioning unwind in which the cost of immediate borrowing spikes while term carry signals little. The USDT curve, by contrast, was calm and idiosyncratically stable: it ran gently upward from 2.9362% at the session to 3.0762% at three months, with tenor changes of just +3 to +12 bps. The divergence is the point. The same de-risking impulse that hit spot showed up as a Bitcoin front-end dislocation, SIRB at 11.29% against USDT's 2.94%, an 8.4 pp gap at the front, while stablecoin funding barely moved. Across both curves, tenor changes ranged from -69 bps to +495 bps, virtually all of it in the BTC session rate.
Bottom Line
Taken together, the week reads as one coherent macro event. A higher-for-longer repricing on hot US data, amplified by record ETF redemptions and Strategy's first Bitcoin sale since 2022, pulled the whole complex lower as a beta event: the highest-beta single assets and smart-contract platforms led the declines, diversified indices lagged their free-float counterparts, implied volatility outran realized, factor leadership rotated into low-beta and size, and Bitcoin's funding curve dislocated at the front end. The lone exception, Jito's catalyst-driven gain, was the kind of idiosyncratic bright spot that proves the rule. We read the regime as a rates-driven de-grossing rather than a crypto-specific shock, broad, orderly, and concentrated where beta is highest.
The information contained within is for educational and informational purposes ONLY. It is not intended nor should it be considered an invitation or inducement to buy or sell any of the underlying instruments cited including but not limited to cryptoassets, financial instruments or any instruments that reference any index provided by CF Benchmarks Ltd. This communication is not intended to persuade or incite you to buy or sell security or securities noted within. Any commentary provided is the opinion of the author and should not be considered a personalised recommendation. Please contact your financial adviser or professional before making an investment decision.
Note: Some of the underlying instruments cited within this material may be restricted to certain customer categories in certain jurisdictions.
Changes to the Token Market Price Benchmarks Series - Market Prices – 21 July 2026
The Administrator has confirmed changes to the Token Market Price Family for the period 14 July 2026 to 21 July 2026.

CF Benchmarks
Softer CPI Reprices July Hike Risk & Lifts Digital Assets
Digital assets extended their recovery over the past week as cooler US inflation prints repriced Fed expectations; the bid was broad across the large cap indices, growth factor leadership returned, stablecoin funding repriced lower, and stress stayed isolated in names hit by token-specific news.
Mark Pilipczuk
Notice of the Demising of CF Dai-Dollar Settlement Price and Spot Rate
The Administrator announces that it will demise the CF Dai-Dollar Settlement Price (DAIUSD_RR) and CF Dai-Dollar Spot Rate (DAIUSD_RTI) which are members of the CF Digital Asset Index Family.
CF Benchmarks
By clicking Accept, you consent to CF Benchmarks's use of cookies.
Visit Cookie Settings to learn how CF Benchmarks uses cookies and to adjust your preferences.