
Jul 01, 2026
Hawkish Fed & Geopolitical Fragility Broaden Drawdown
Key takeaways for the month
Macro, geopolitical, and policy crosscurrents in June were dominated by a hawkish Federal Reserve, a hot inflation print, and fragile Iran diplomacy, extending May's pullback into a broad and steep drawdown across digital assets. May CPI, released in mid-June, rose 4.2% year over year, its highest reading in more than three years, while core inflation held softer and kept the reacceleration debate alive. At Chair Kevin Warsh's first meeting on June 17, the FOMC held the policy rate at 3.50% to 3.75% on a 12-to-0 vote, and the updated projections erased the prior indication of a 2026 cut and flipped toward a hike, pushing any easing into 2027. On the geopolitical front, U.S. and Iranian officials reached a preliminary framework on June 15 and signed the Islamabad Memorandum on June 17 to wind down the conflict, though later talks in Switzerland stalled over the Strait of Hormuz and uranium enrichment, leaving crude volatile. Digital asset funds extended their outflows to roughly $4.1 billion, the largest monthly total of 2026, with Bitcoin funds accounting for close to $4.0 billion. As rate-cut hopes faded and the war premium stayed unresolved, investors remained defensive.
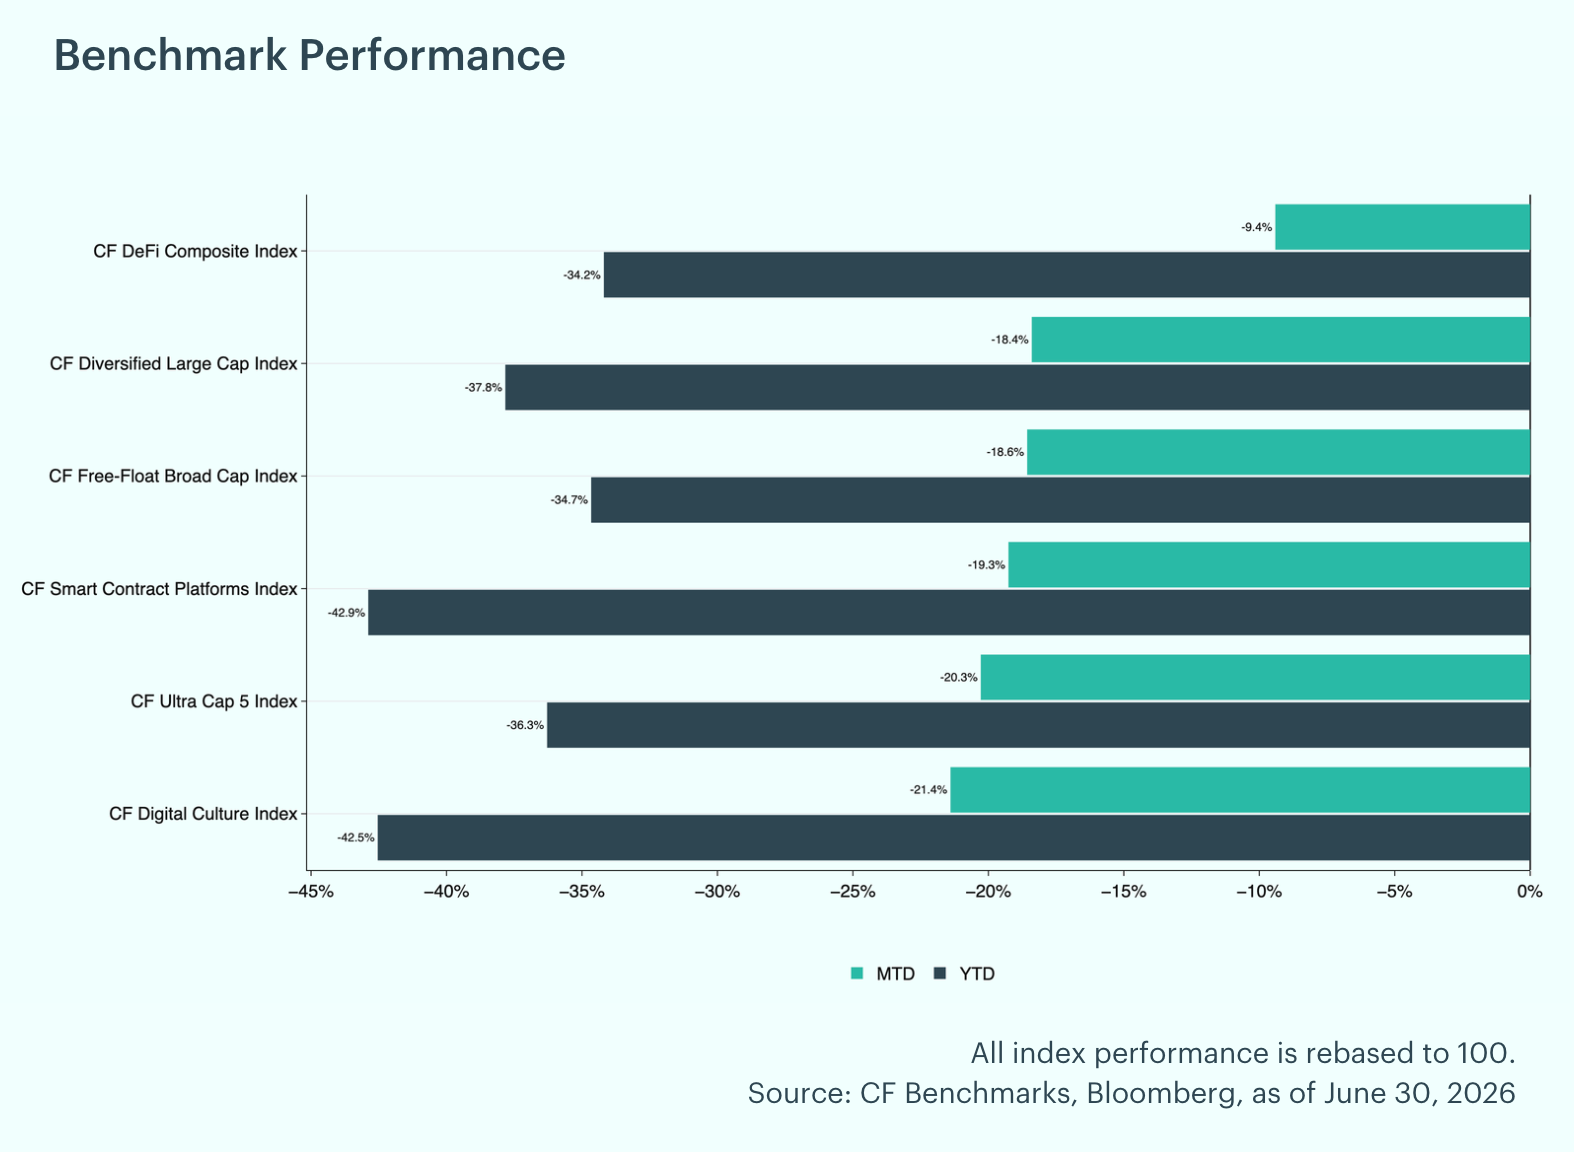
Broad and Steep Pullback Across the Market: June extended and deepened May's decline, with every CF Benchmarks index posting a steep monthly loss. The CF DeFi Composite Index proved most resilient, off about 9.4% month-to-date, followed by the CF Diversified Large Cap Index at an 18.5% decline. The CF Free-Float Broad Cap Index fell 18.6%, the CF Smart Contract Platforms Index 19.2%, and the CF Ultra Cap 5 Index 20.3%, while the CF Digital Culture Index lagged at 21.3%. On a year-to-date basis, drawdowns deepened to a 34% to 43% range, with the CF Digital Culture Index down the most at roughly 43%.
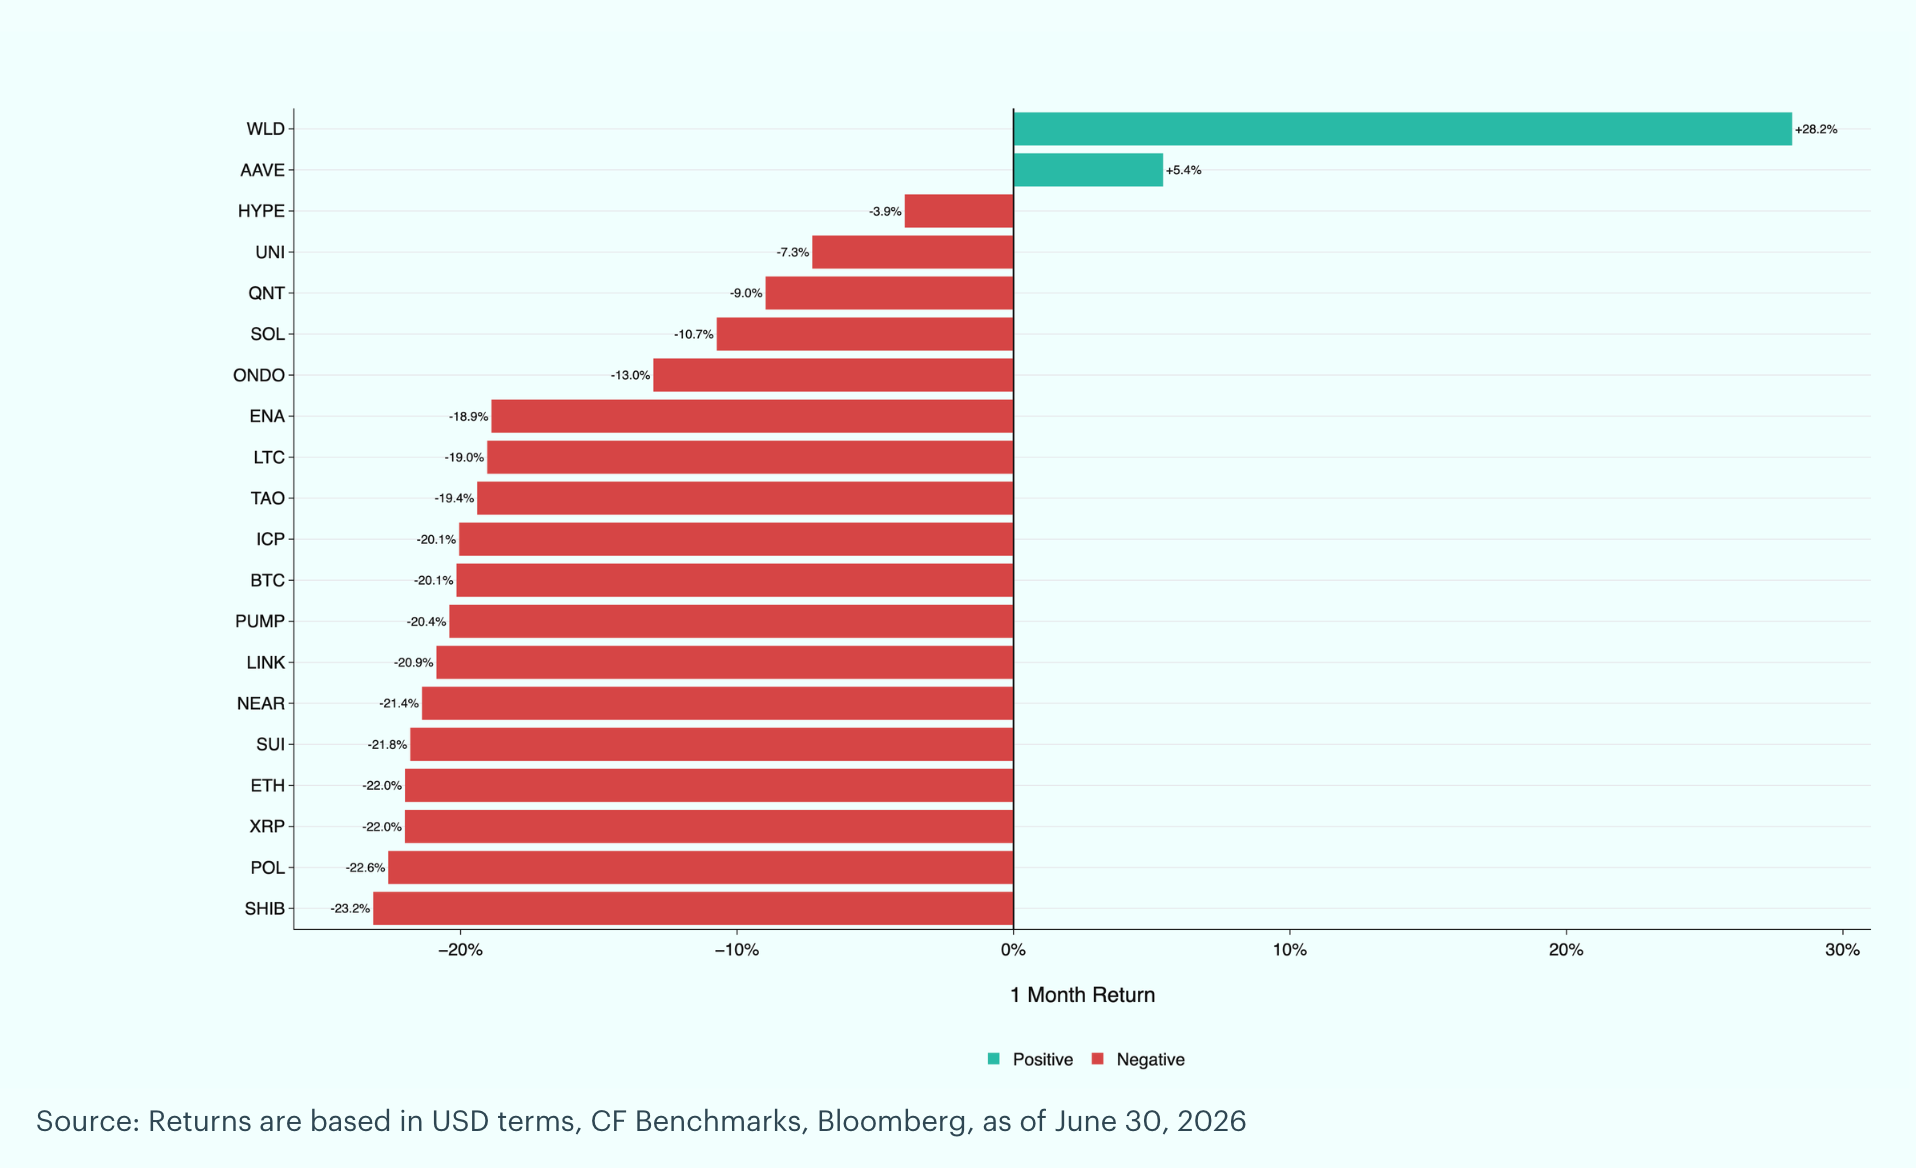
Individual Movers: Worldcoin (WLD) led the major crypto-pairs in June with a 28.2% month-over-month gain, the largest in the group, after Eightco Holdings disclosed a 283.45 million WLD treasury position, roughly 8.4% of circulating supply, on June 15. Aave (AAVE) followed at +5.4%, aided by Standard Chartered initiating coverage on June 24 with a 3,500 dollar long-term price target that lifted institutional DeFi sentiment. Hyperliquid (HYPE) held up best among the rest, easing just 3.9% as spot HYPE ETFs drew continued inflows even as the market absorbed a token unlock on June 6. On the downside, Shiba Inu (SHIB) was the weakest major in the top 20 at -23.2%, its worst month of 2026, as meme coins and small-cap tokens bore the brunt of a defensive rotation. Polygon (POL) fell 22.6% as Ethereum layer-2s continued to underperform, and XRP declined 22.0% even though Ripple secured a MiCA license on June 23.
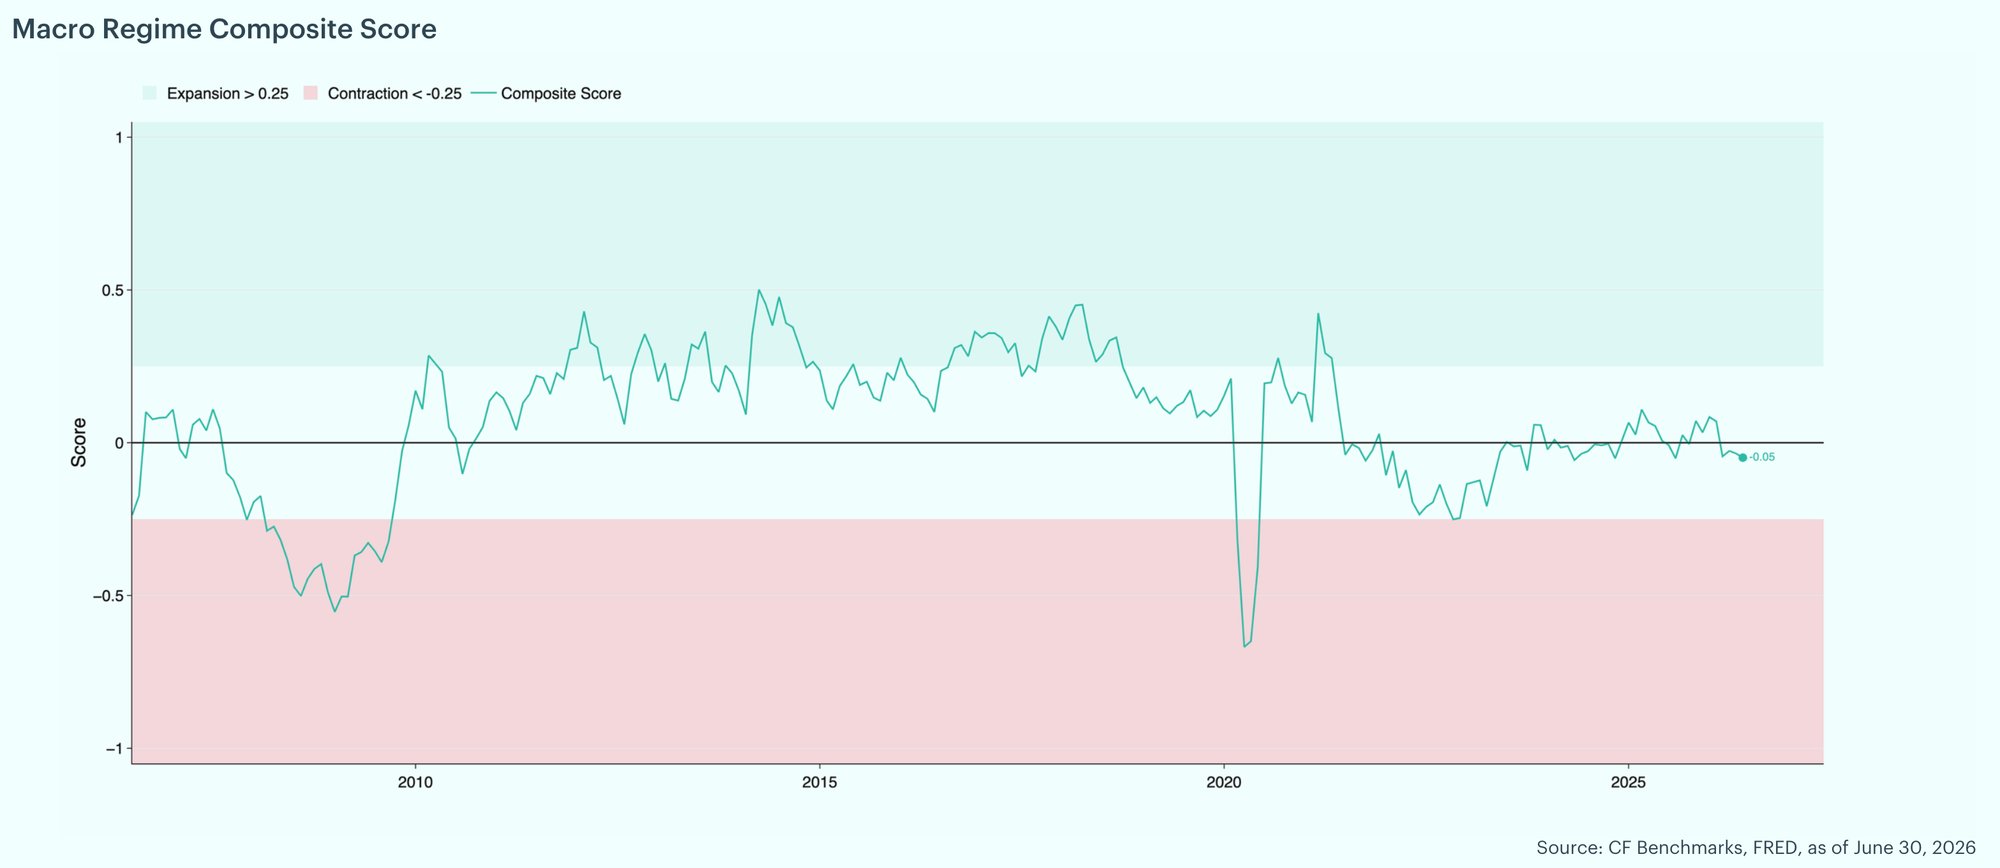
Late-Cycle Macro Holds in Neutral: The CF Benchmarks Macro Regime Composite Score sat essentially at zero, near -0.05, within the neutral zone (expansion above +0.25, contraction below -0.25). The cycle read flat and late stage, with firmer business surveys and still accommodative financial conditions on one side, and softening housing and consumer demand, a contractionary reading from the Brave-Butters-Kelley leading index, and a renewed inflation impulse on the other. The manufacturing pipeline firmed, as the orders-to-inventories spread widened to roughly +10.0 on a year-over-year basis from about +1.1 and the ISM Manufacturing PMI rose to 55.7 from 55.1, while input-price pressure eased as the ISM Manufacturing Prices Paid index fell to 82.1 from 84.6. Liquidity and real activity held rather than turned, with real M2 money supply growth firming to +1.4% year over year, up 0.4 percentage points month-over-month, and the Weekly Economic Index steady near 2.5%. Signs of strain persisted in services and labor, as the ISM Services Prices Paid index rose to 71.3 and the U-6 underemployment rate held elevated at 8.1%. Core PCE inflation firmed to 3.4% year over year, and housing starts fell to about 1.18 million (SAAR) from 1.39 million, pointing to a thinner supply pipeline that tends to keep shelter costs firm.
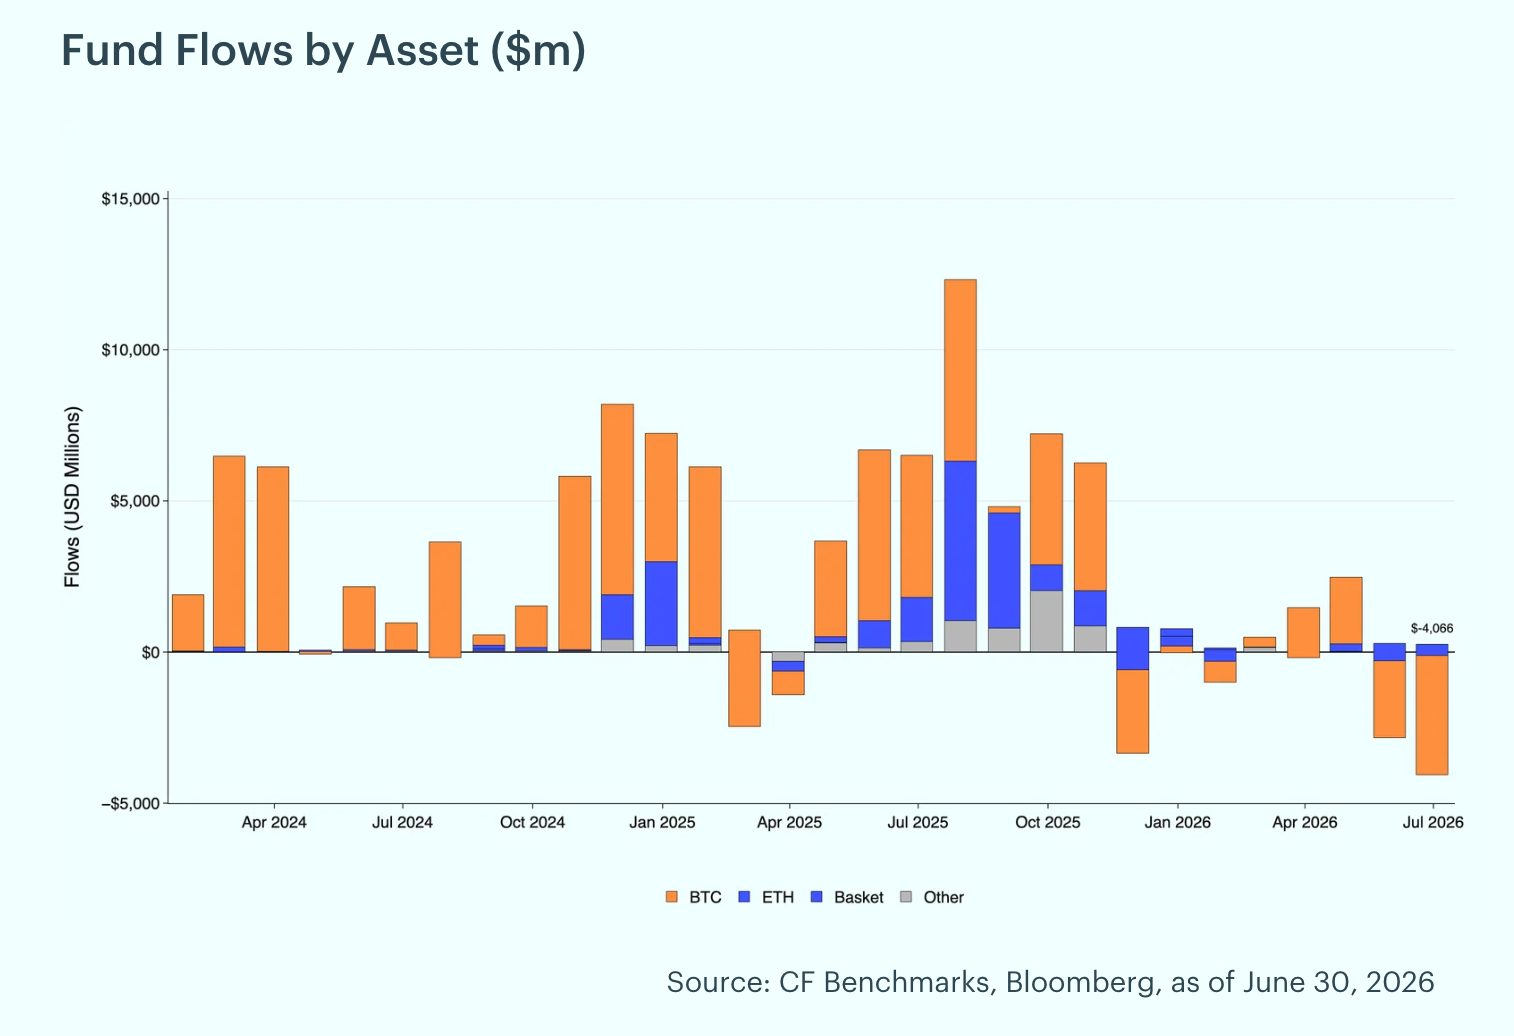
Fund Flows Deepen to a Fresh 2026 High: Digital asset funds extended their net outflows in June, shedding roughly $4.1 billion after $2.8 billion of outflows in May. Bitcoin funds again led the selling with roughly $4.0 billion of outflows, and Ether funds lost $368 million, while Basket/Index funds drew $181 million of inflows and Other Single Crypto funds added $77 million. By region, the selling was concentrated in North America at roughly $4.0 billion of outflows, partly offset by $99 million of inflows into Europe.
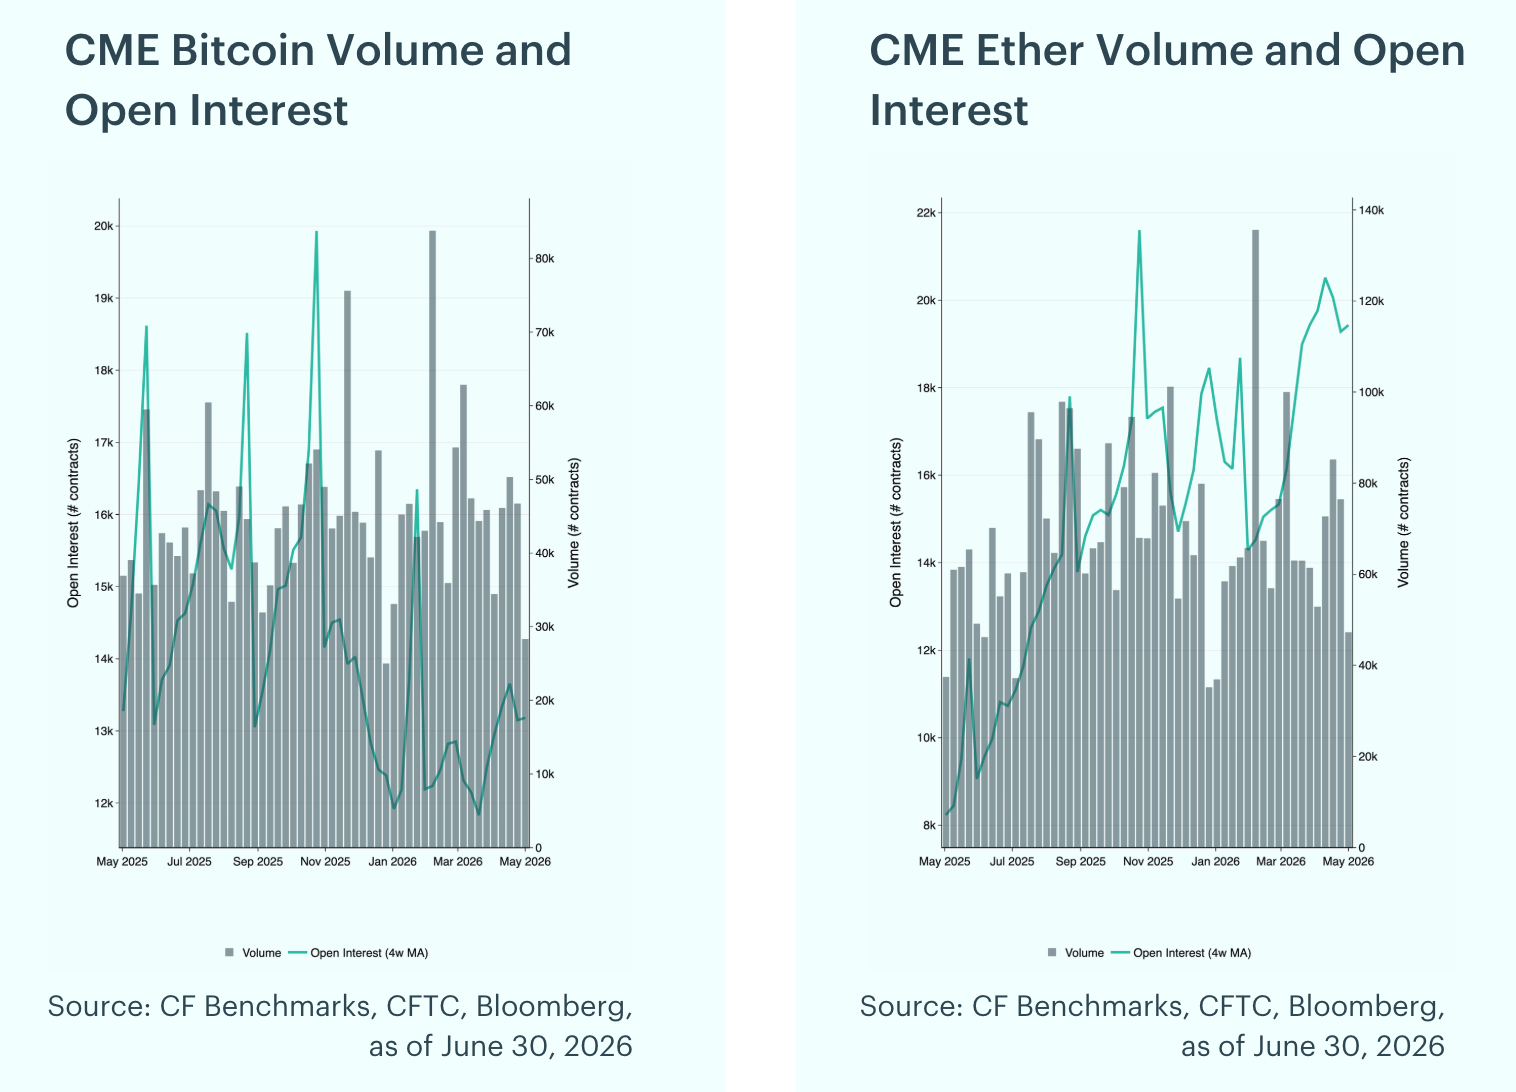
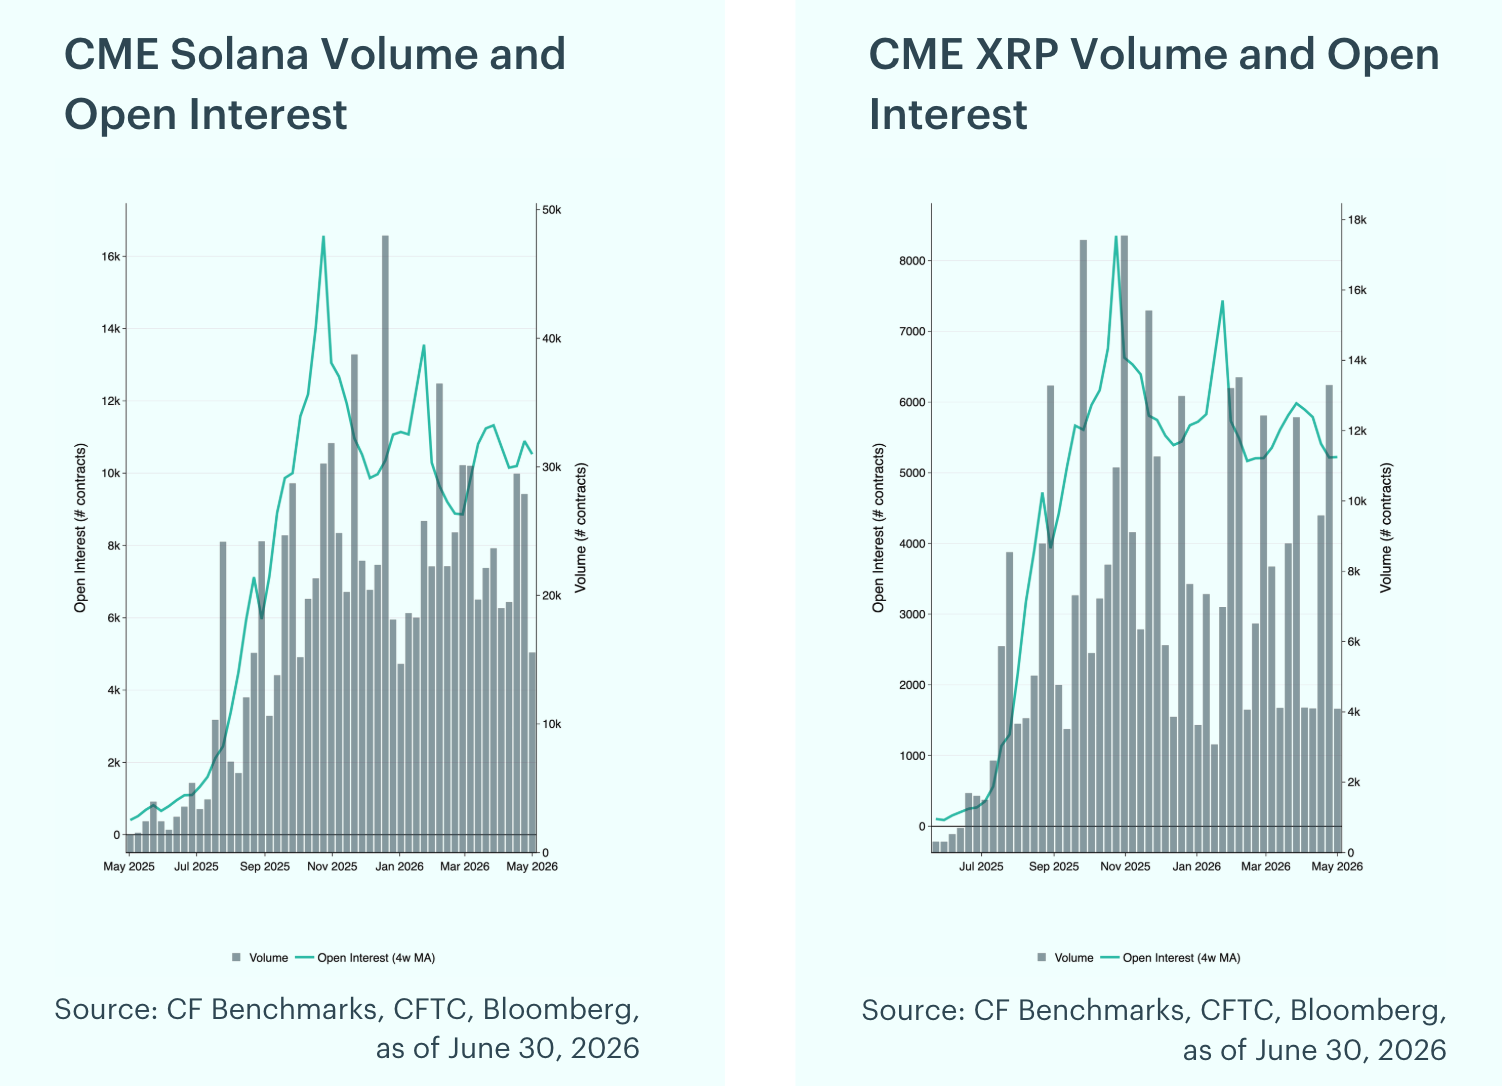
Futures Positioning Eases Further: CME futures positioning eased further in June. On a four-week moving average basis, CME Ether open interest fell 10.4% month-over-month to roughly 17,384 contracts, the steepest drop in the group, and Solana open interest declined 6.2% to about 8,030 contracts, while Bitcoin held near 11,686 contracts and XRP was little changed at 5,344 contracts. Peak weekly volumes rose from May, with Bitcoin at 59,866 contracts, Ether at 84,357, Solana at 19,015, and XRP at 12,080.
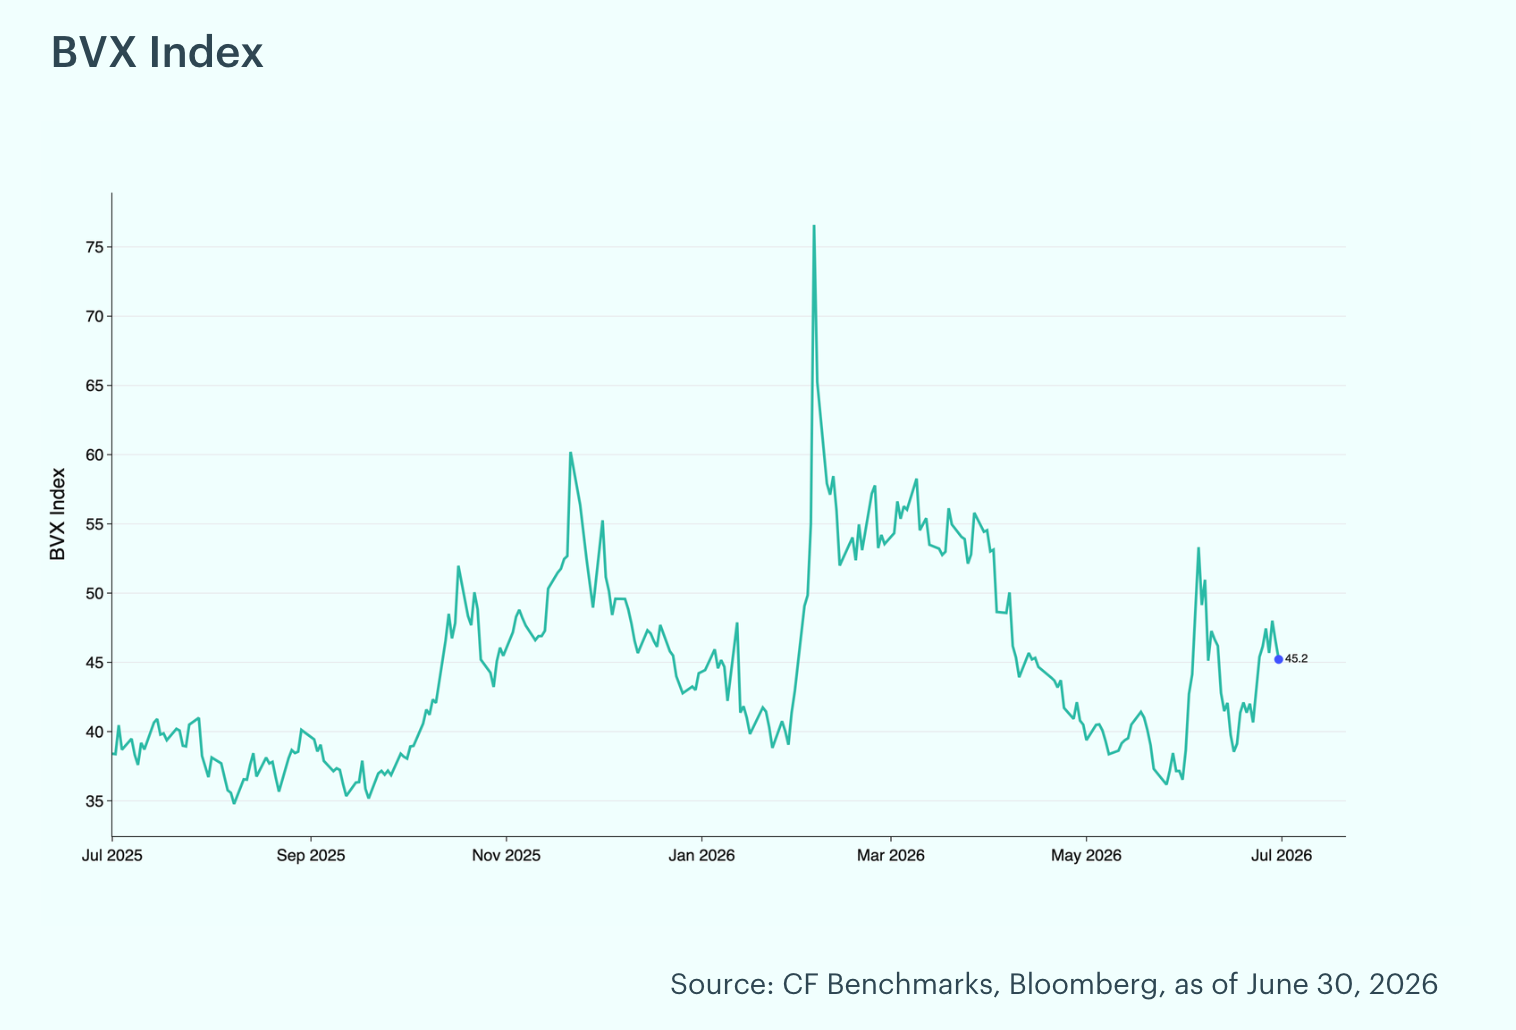
Bitcoin Volatility Rebounds: The CF Bitcoin Volatility Index Settlement Rate (BVXS) is a daily benchmark that provides a forward-looking, 30-day constant-maturity measure of implied volatility, derived from CFTC-regulated Bitcoin option contracts traded on the CME. The BVX reflects the fair strike of a variance swap. The BVX rose in June, trading in a 38.54 to 53.32 range and closing the month at 45.21, up 23.8% from 36.52 at the end of May and near the middle of its trailing-year range. The rolling 30-day z-score finished at 0.22 and turned positive during the month, ranging from -0.75 to 3.75, indicating implied volatility moved back in line with recent norms.
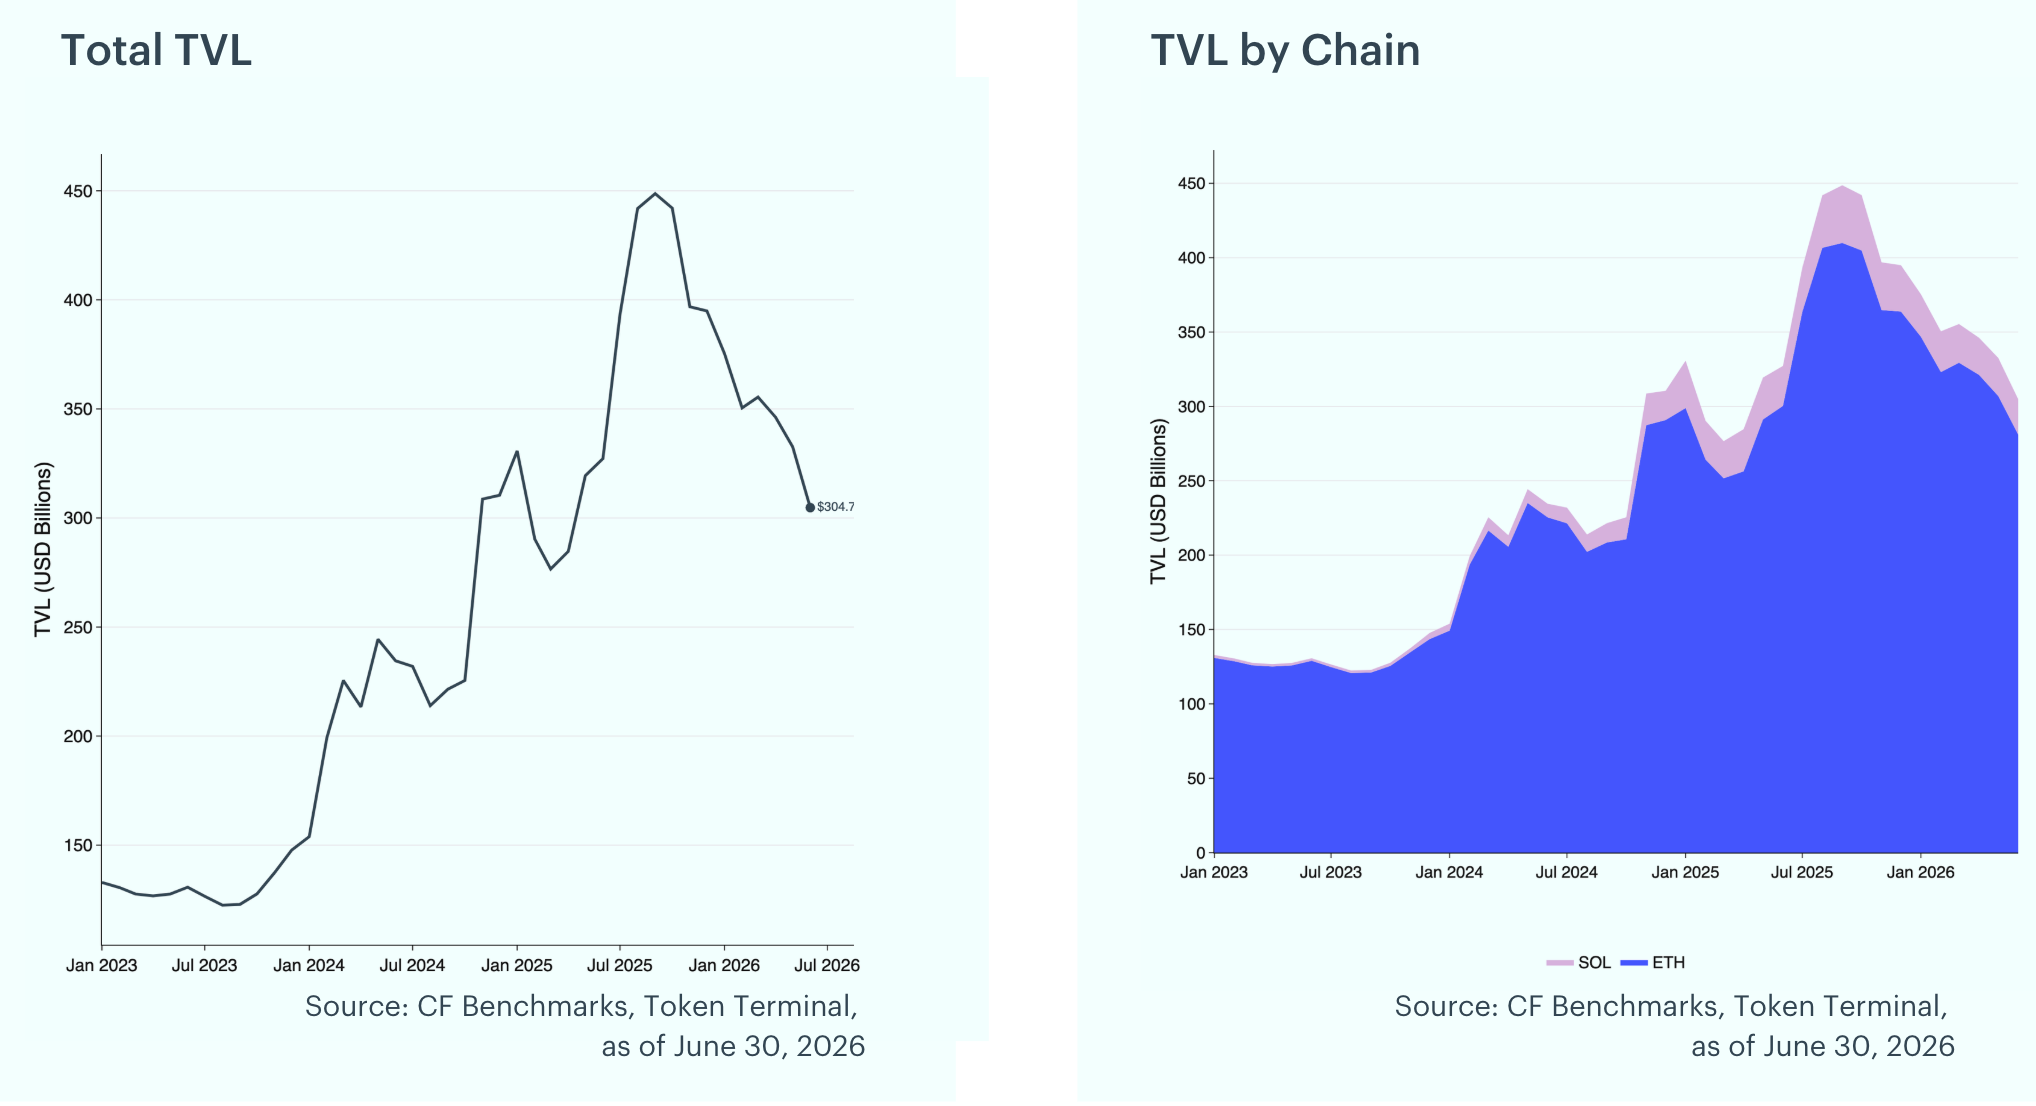
DeFi TVL Falls Further: Total Value Locked declined 8.4% in June to $304.7 billion, down from $332.6 billion in May. Ethereum TVL fell to $280.9 billion (-8.5%) while Solana TVL eased to $23.8 billion (-7.2%), leaving Ethereum at roughly 92% of the tracked total.
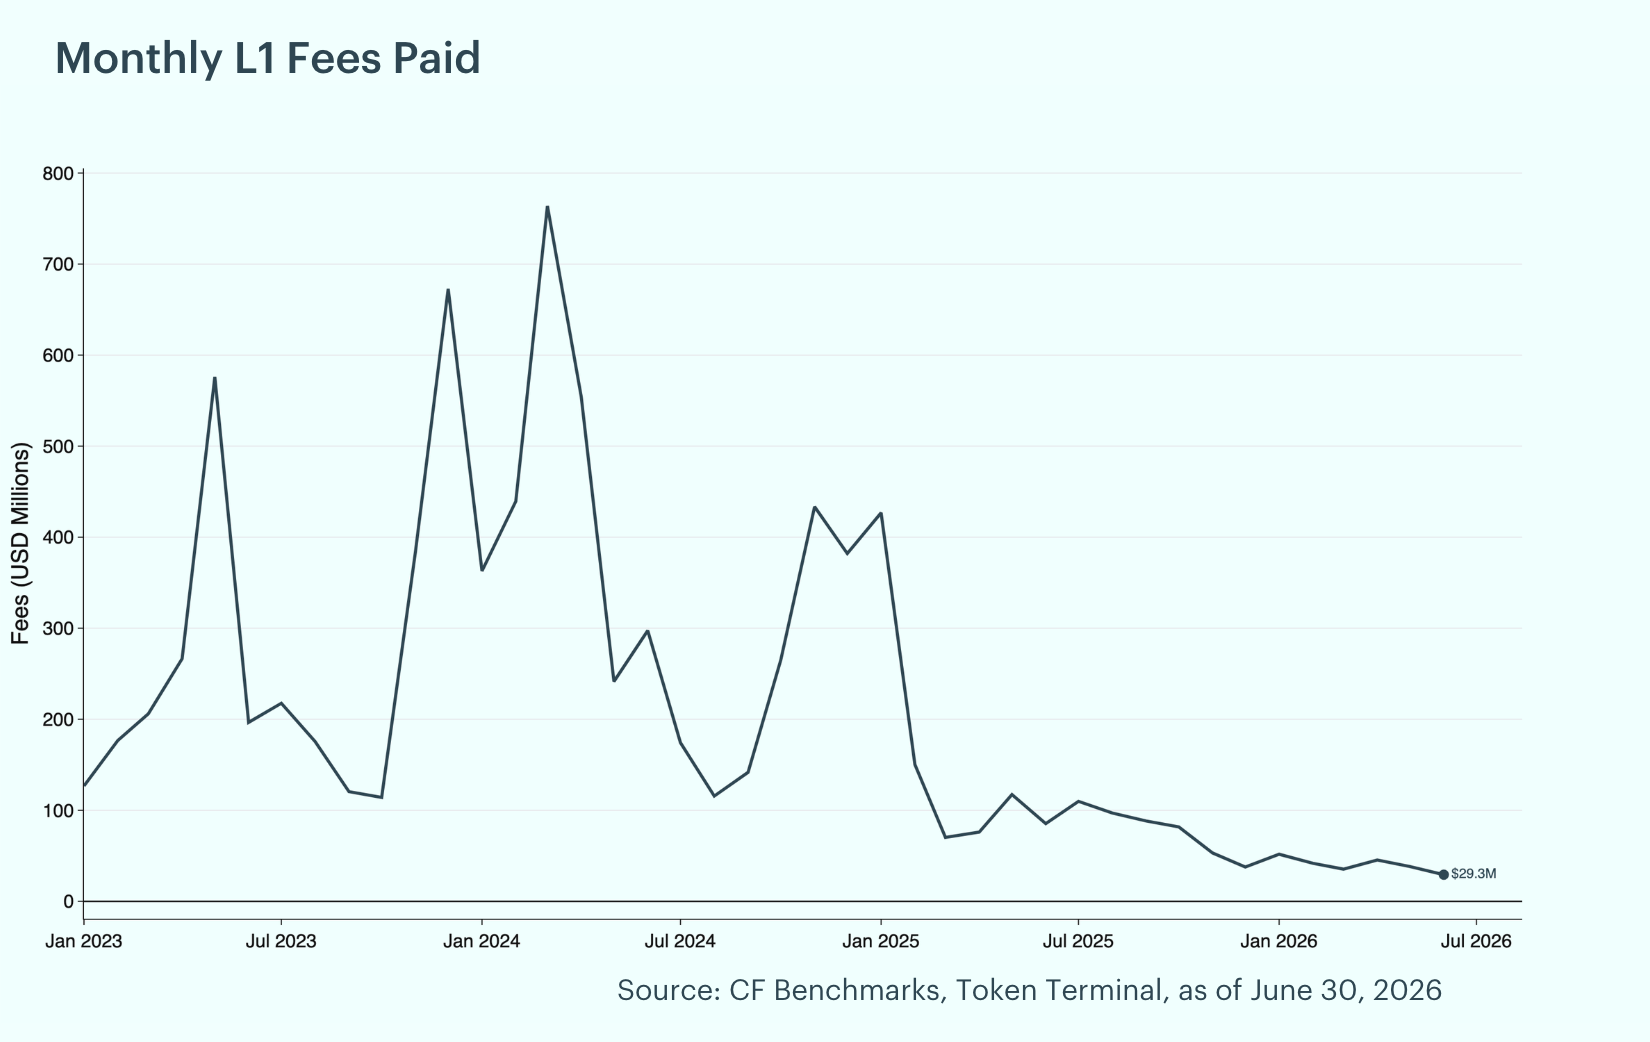
Layer-1 Fees Pull Back Further, Solana Takes the Lead: Total Layer-1 fees fell 23.5% month-over-month in June to $29.3 million from $38.2 million in May. Solana led with $11.5 million (39.3% of the total) despite a 20.0% drop, followed by Ethereum at $11.3 million (38.6%, down 32.2%) and Bitcoin at $6.3 million (21.4%, down 9.7%).
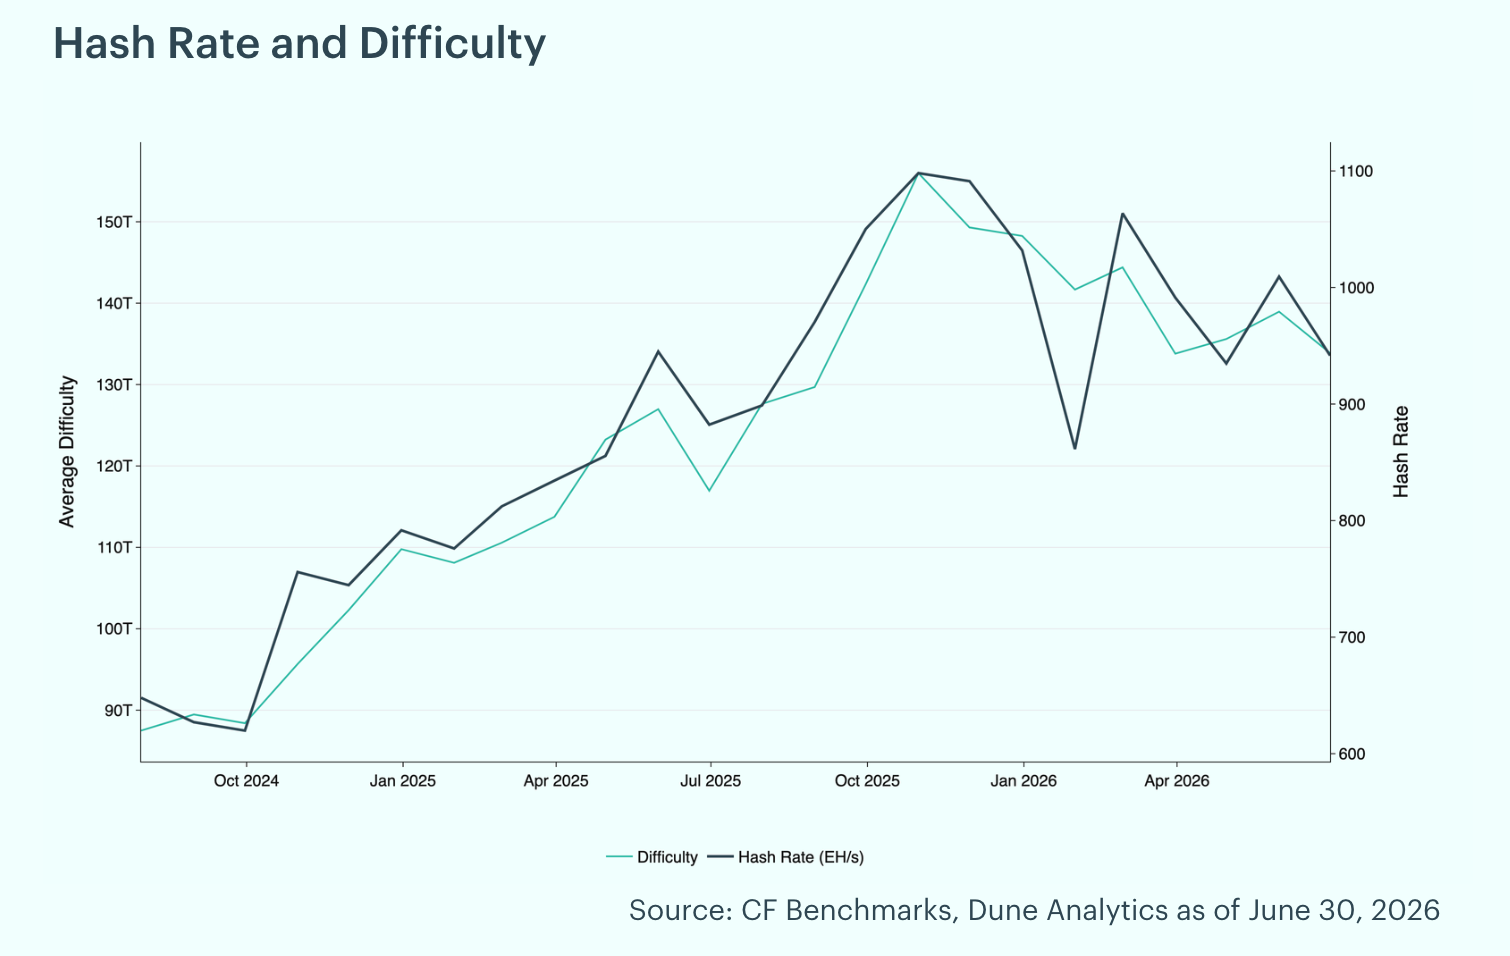
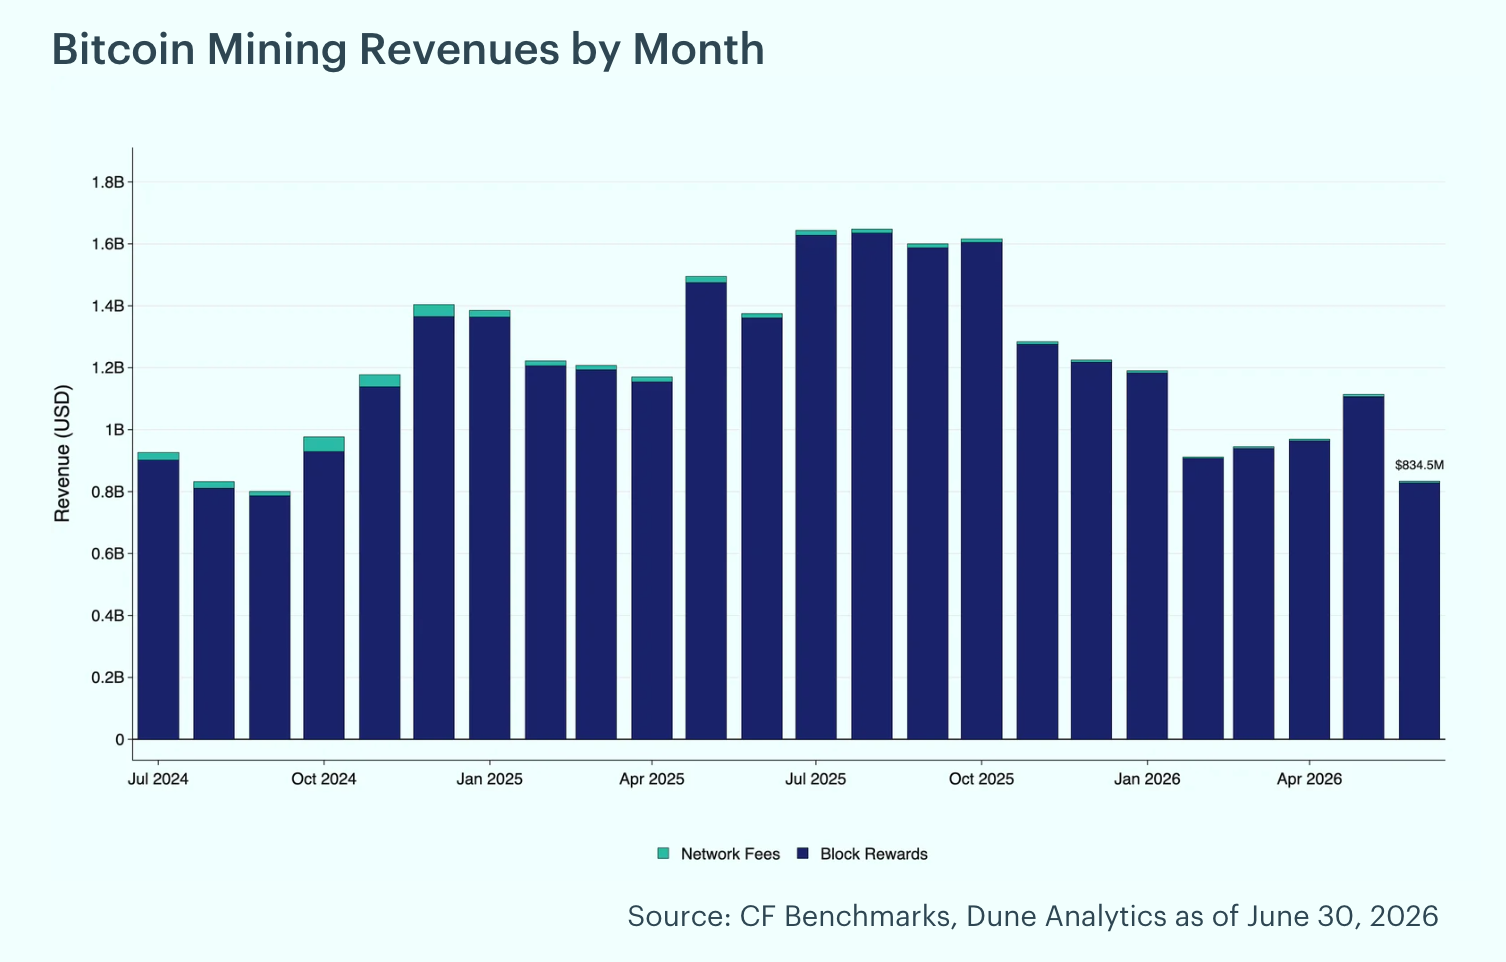
Hash Rate Eases, Mining Revenue Falls: Bitcoin's hash rate eased 6.7% in June, slipping to 942 exahashes per second from 1,009 EH/s at May's end. Mining difficulty, which measures the computational effort required to mine a new block and adjusts to maintain consistent block times, declined 3.7% to 133.9T as the network loosened alongside the pullback in hash power. Miners saw a 25.1% decrease in revenue, with total mining revenue of $834.5 million. Of the total rewards earned during the month, 0.7% came from transaction fees, with block rewards totaling $828.2 million and fees contributing $6.3 million. The decline was driven by the pullback in network hash rate alongside softer Bitcoin prices through the month.
To read the complete report, click here to view a PDF version. Additionally, please do not forget to subscribe to our latest news and research for the most relevant institutional insights on digital assets and the top digital assets by market cap.
The information contained within is for educational and informational purposes ONLY. It is not intended nor should it be considered an invitation or inducement to buy or sell any of the underlying instruments cited including but not limited to cryptoassets, financial instruments or any instruments that reference any index provided by CF Benchmarks Ltd. This communication is not intended to persuade or incite you to buy or sell security or securities noted within. Any commentary provided is the opinion of the author and should not be considered a personalised recommendation. Please contact your financial adviser or professional before making an investment decision.
Note: Some of the underlying instruments cited within this material may be restricted to certain customer categories in certain jurisdictions.
Changes to the Token Market Price Benchmarks Series - Market Prices – 21 July 2026
The Administrator has confirmed changes to the Token Market Price Family for the period 14 July 2026 to 21 July 2026.

CF Benchmarks
Softer CPI Reprices July Hike Risk & Lifts Digital Assets
Digital assets extended their recovery over the past week as cooler US inflation prints repriced Fed expectations; the bid was broad across the large cap indices, growth factor leadership returned, stablecoin funding repriced lower, and stress stayed isolated in names hit by token-specific news.
Mark Pilipczuk
Notice of the Demising of CF Dai-Dollar Settlement Price and Spot Rate
The Administrator announces that it will demise the CF Dai-Dollar Settlement Price (DAIUSD_RR) and CF Dai-Dollar Spot Rate (DAIUSD_RTI) which are members of the CF Digital Asset Index Family.
CF Benchmarks
By clicking Accept, you consent to CF Benchmarks's use of cookies.
Visit Cookie Settings to learn how CF Benchmarks uses cookies and to adjust your preferences.