
Sep 04, 2026
Factor Friday - September 4, 2026
Downside Beta Leads as Size Reverses
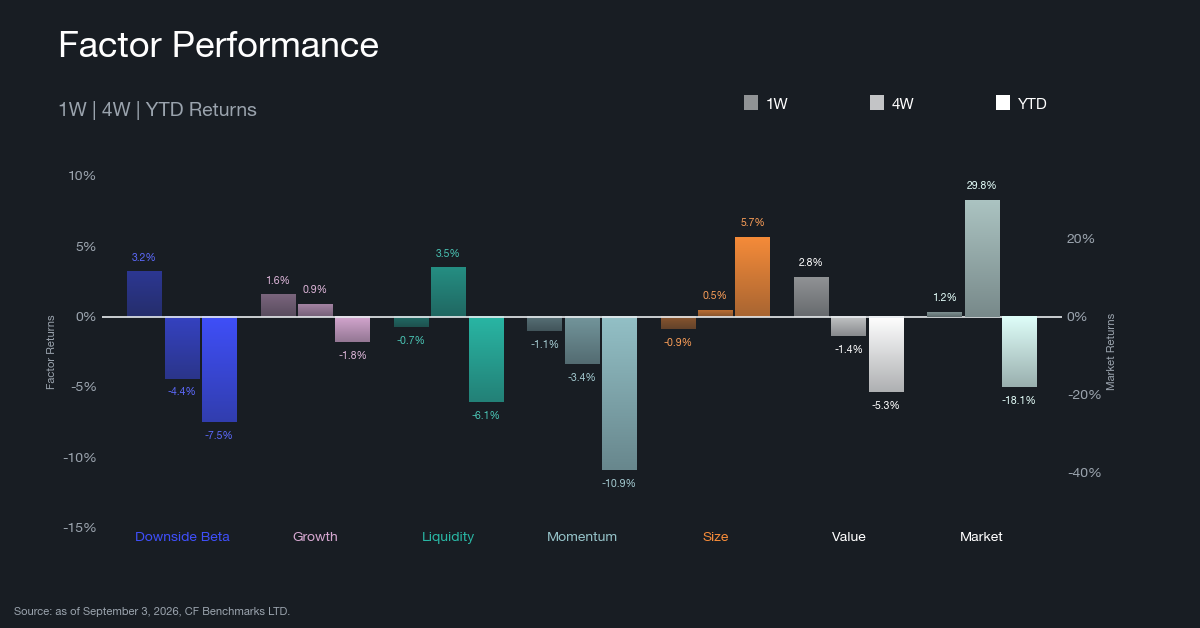
Positioning swung defensive this week. Downside Beta, the weakest style factor a week ago at -4.6%, rose 3.2% to take the lead, while Size, last week's second-best performer at +3.2%, reversed to -0.9% and the Market cooled to +1.2% after an 11.2% week. Value rebounded to +2.8% from -3.5%, Growth added a steady +1.6%, Liquidity gave back 0.7%, and Momentum slipped to -1.1%, its fifth straight negative week. The gap between the week's best and worst factor narrowed to 4.3 percentage points from 15.8 the week before, back in the range that held before the Market's two outsized weeks in August. Over four weeks the Market still leads at +29.8%, with Liquidity (+3.5%) the only other style factor also positive across that span; year to date, Size at +5.7% remains the sole style factor above zero and the Market stands at -18.1%. Downside Beta's rise, paired with Size's move lower, reads as a rotation up the market cap curve and into more defensive names rather than a broad de-risking, since the Market itself still closed the week positive; whether that defensive bid builds from here or fades is the question for next week.
Rolling Factor Rankings and Rotation
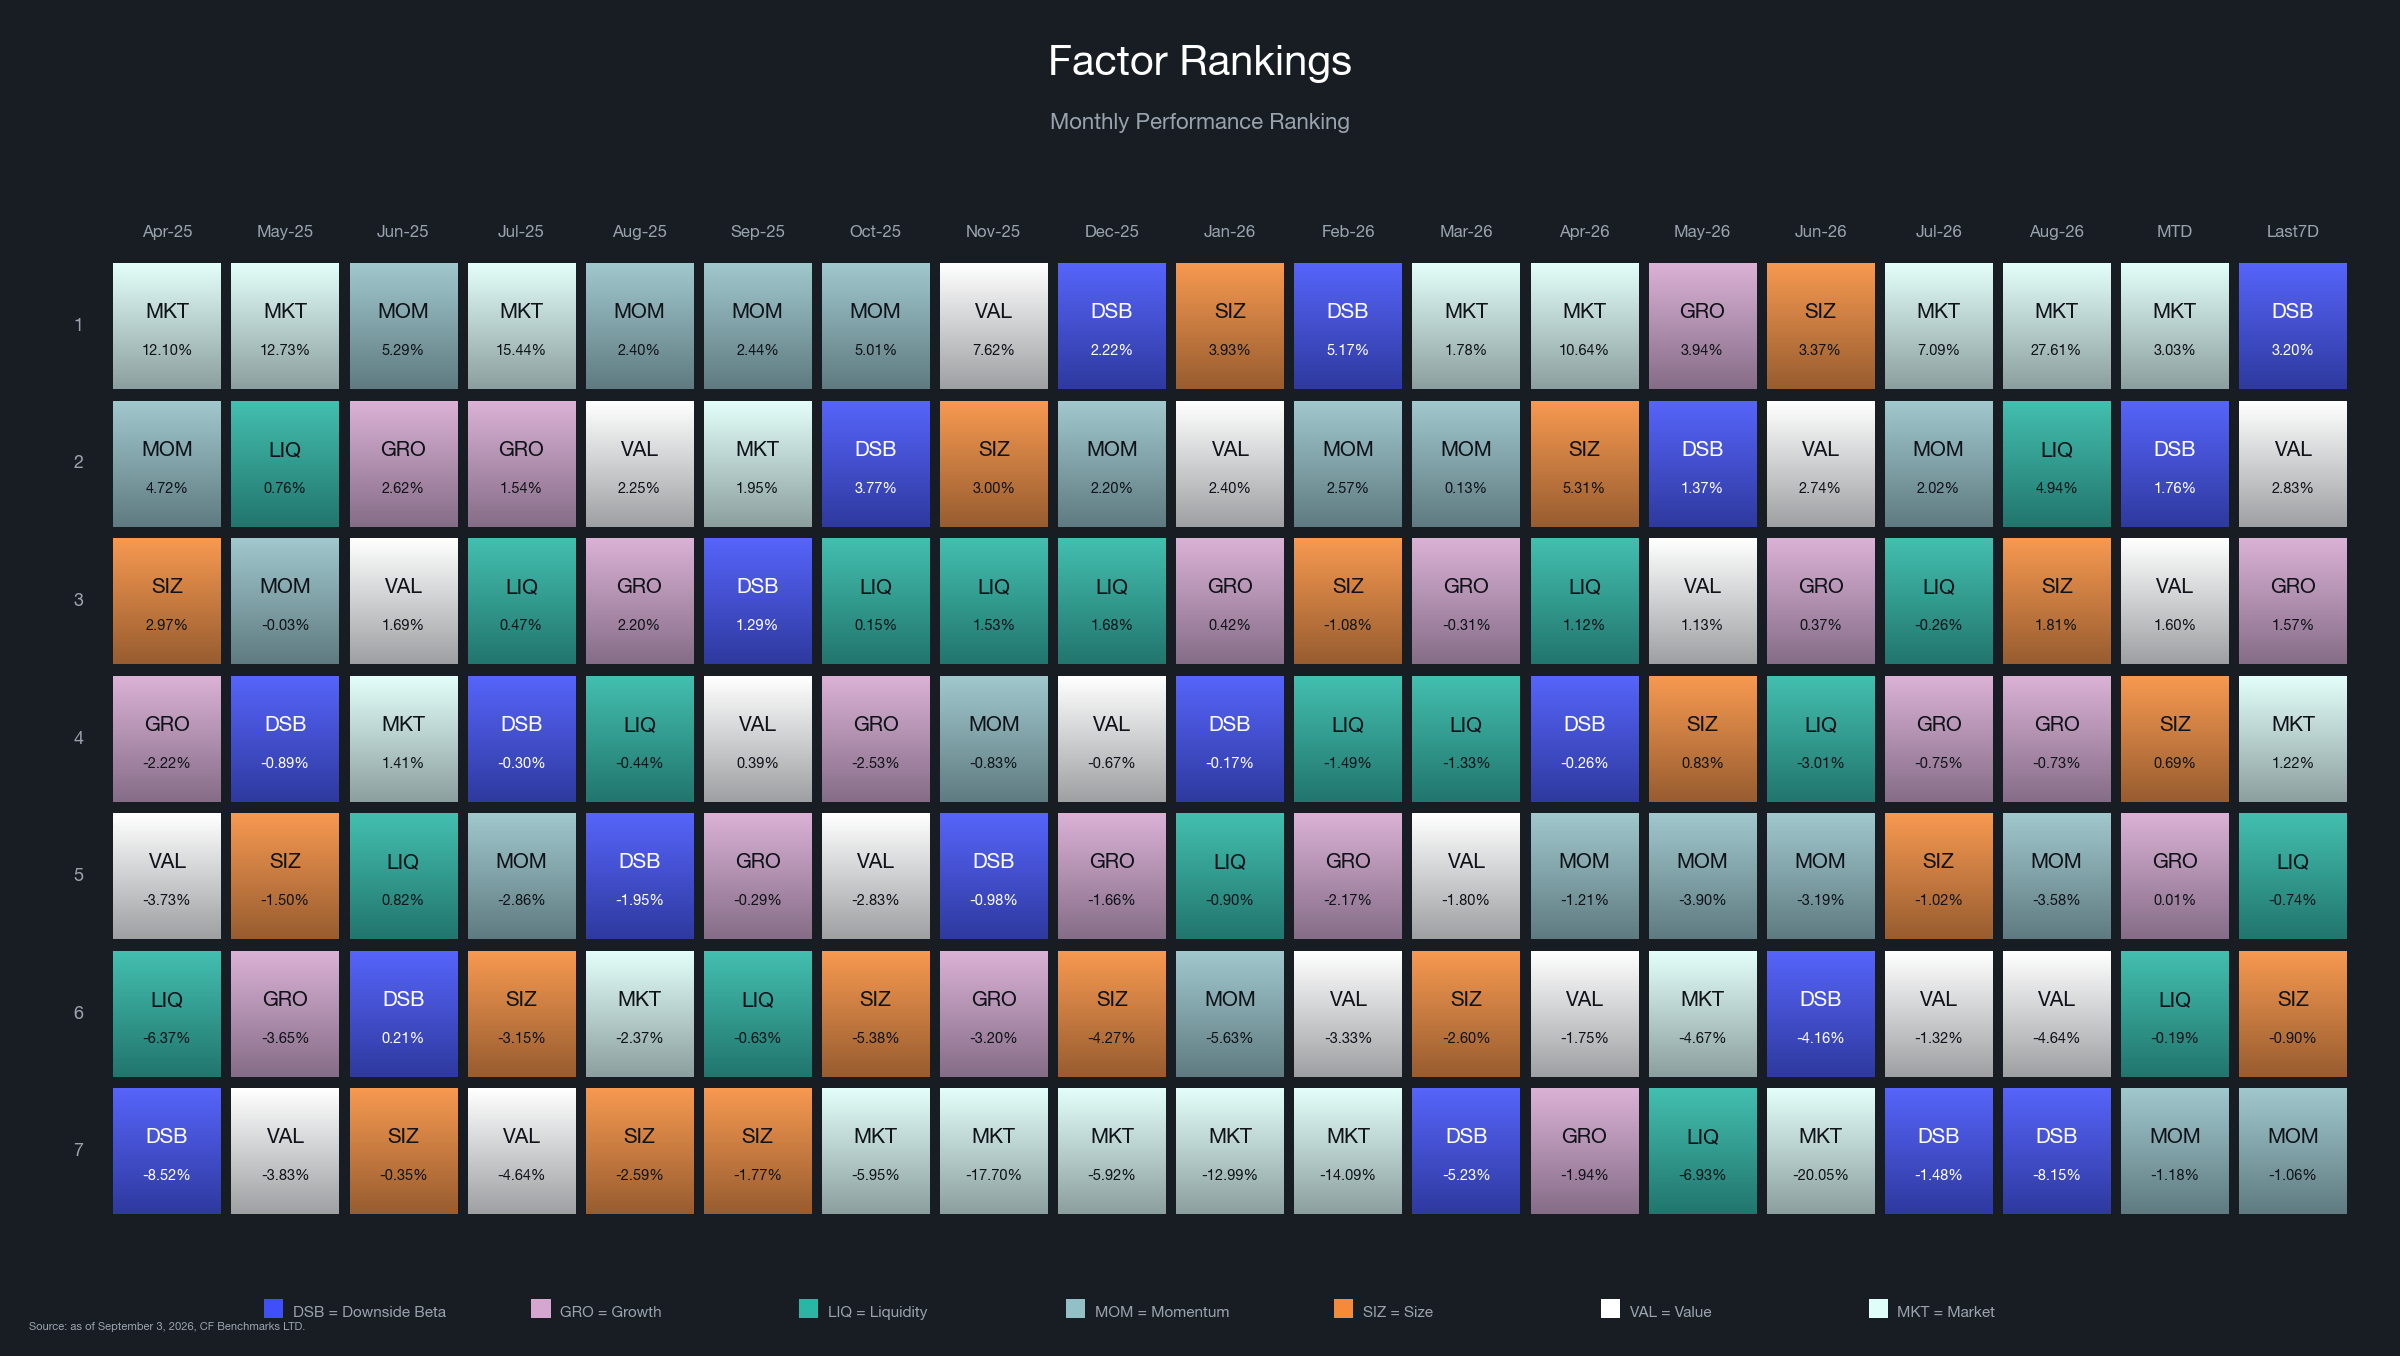
The Market, which had held first place for two straight weeks including last week's +11.2%, slipped to fourth at +1.2%, while Downside Beta, last week's laggard at -4.6%, jumped six spots to lead at +3.2%. Value climbed four places to second, Size fell four places to sixth, Growth rose one spot to third, and Momentum dropped two spots to last, now negative for a fifth straight week, the steadiest losing streak among the seven factors. Three trading days into September, the month-to-date ranking still has the Market first at +3.0% and Downside Beta second at +1.8%, so the shift toward defense sharpened within the trailing seven days and has not yet carried fully into the new month. August itself closed with the Market first at +27.6% and Liquidity second at +4.9%, the same broad-beta-led month that produced the wide spreads of the two prior reports; this week's compression says that leadership is being tested, not confirmed. A single week of defensive leadership does not make a trend, and whether Downside Beta holds the top spot into next week or gives it back the way Size did after its own reversal is what determines whether this was a pause or a turn.
Market and Key Factor Betas
Market Beta
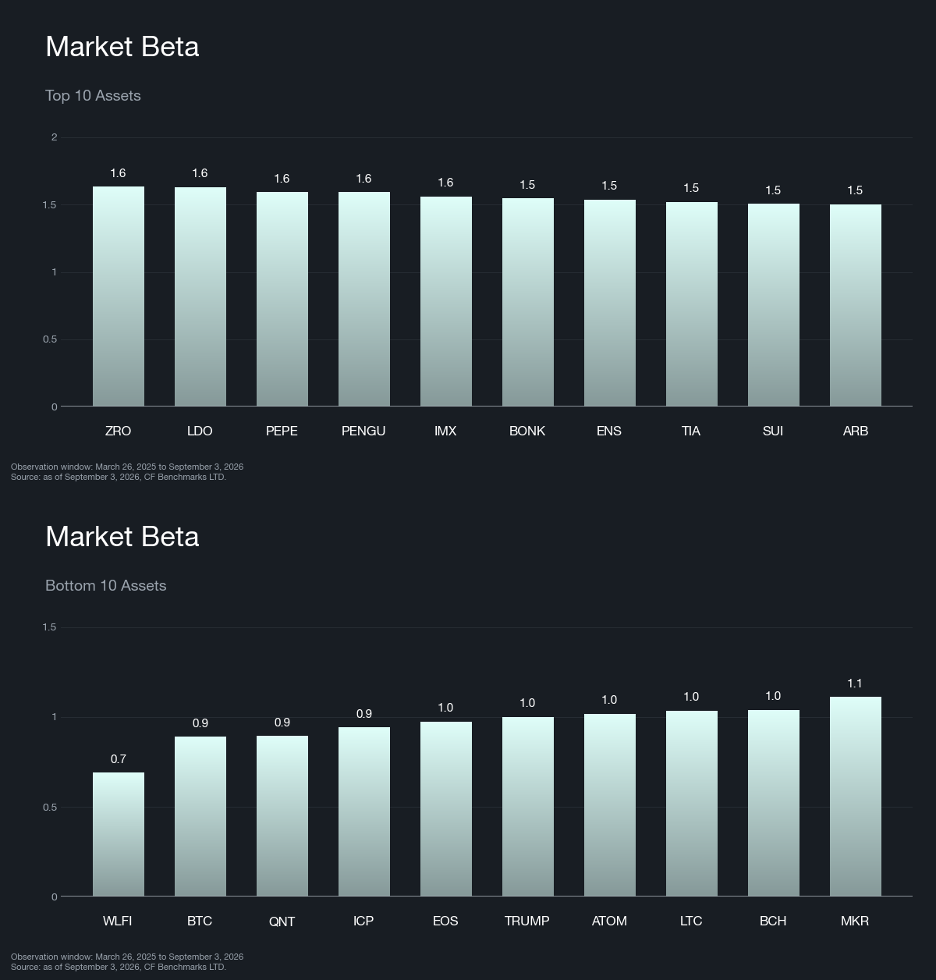
Market-beta composition is unchanged for a seventh straight week, the same ten names anchoring both ends of the list since July 23. Zero (ZRO) edged past Lido (LDO) for the top spot this week, 1.63 to 1.62, while the rest of the high-beta cohort holds its order: meme coins and gaming tokens, cross-chain messaging, modular infrastructure and a naming-service name. The defensive end is just as static, World Liberty Financial (WLFI) still lowest at 0.69 and Bitcoin (BTC) next at 0.89, followed by enterprise interoperability and legacy payment chains, alongside older smart-contract platforms. A frozen roster through a six-week Market decline, a two-week rebound and now a cooling week says positioning in broad beta simply has not moved with the Market itself; the same book that lagged the drawdown and then captured the rebound is sitting through the pause unchanged. For a holder of broad-market exposure, that static composition is itself the risk, since whichever way the Market breaks next, this is the cohort that carries it.
Downside Beta
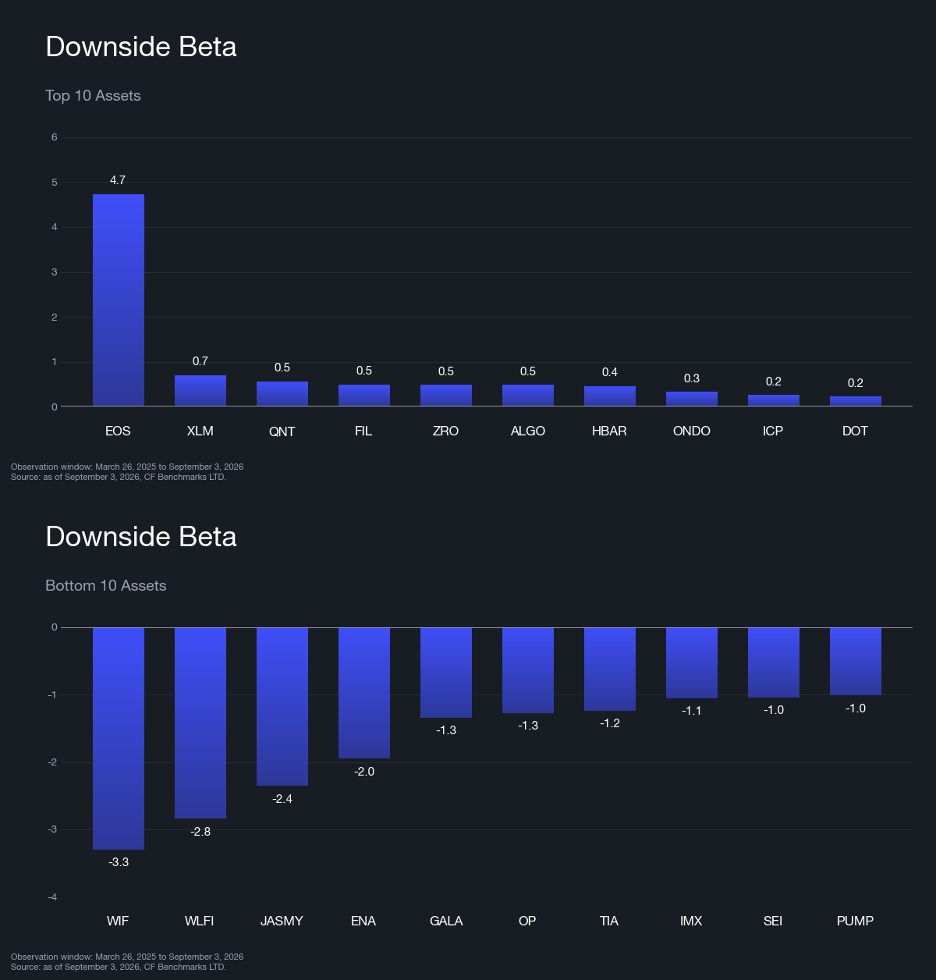
Downside Beta did more than lead the week's returns; its composition shows where the defensive bid is concentrated, and it is not where a generalist would expect. EOS sits alone at the top of the beta list at 4.72, roughly seven times the next name, Stellar (XLM) at 0.69, with the rest of the high-beta cohort, the names most exposed to the Market's worst sessions, clustered in legacy layer-1 and payments-adjacent tokens, led by Quant (QNT) and Filecoin (FIL), with ZRO, Algorand (ALGO), Hedera (HBAR), Ondo (ONDO), ICP and Polkadot (DOT) filling out the list. The bottom of the list runs the other way. WIF, WLFI, Jasmy (JASMY), Ethena (ENA), GALA, Optimism (OP), Celestia (TIA), Immutable (IMX) and Sei (SEI) all carry negative betas. These gaming, layer-2, meme and DeFi-adjacent tokens have recently moved against the Market during its worst sessions rather than with it, and PUMP joined the group this week, replacing Ethereum Name Service (ENS), while every other name on both ends held its spot. That split inverts the intuitive read. The tokens that look riskiest on the surface are behaving defensively by this measure, while a set of older, more established platforms is absorbing the Market's downside instead. ZRO's underlying factor score fell the most of any constituent this week, down 0.64 points to -1.45, a modest deepening of its downside exposure even as its raw beta held mid-pack; a further slide there would be the clearest sign this rotation has more than one week left in it.
Size
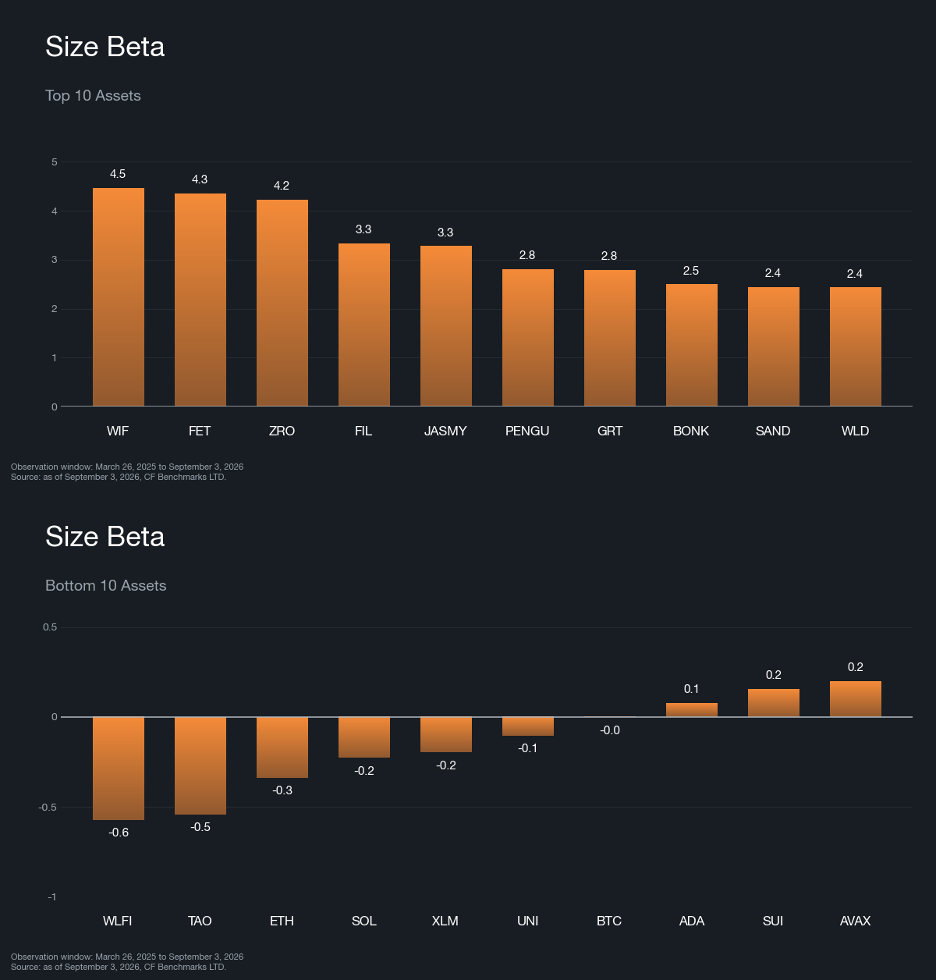
Size gave back last week's gain in full, falling to -0.9% from +3.2% and dropping four places in the ranking, but the composition confirms this was a price move, not a repositioning. The high size-beta cohort is unchanged from last week, ten names run by WIF at 4.46 and FET at 4.34, alongside ZRO, FIL, JASMY, PENGU, GRT, BONK, SAND and WLD. The low end mirrors last week too, still crowded with Bitcoin (BTC), Ethereum (ETH), Solana (SOL), Sui (SUI) and Avalanche (AVAX) among the ten smallest size betas, with only TAO and WLFI swapping order at the very bottom. Factor scores across the portfolio barely moved week over week, the largest shift under three hundredths of a point, in keeping with a factor built on fully diluted market capitalization that re-ranks slowly regardless of which way the price return breaks. Size remains the only style factor positive year to date at +5.7%, so this week's reversal reads as a pause in an otherwise steady position rather than a change in it; a second straight week of large-cap leadership is what would turn that pause into a genuine unwind.
What Factors are Driving Markets
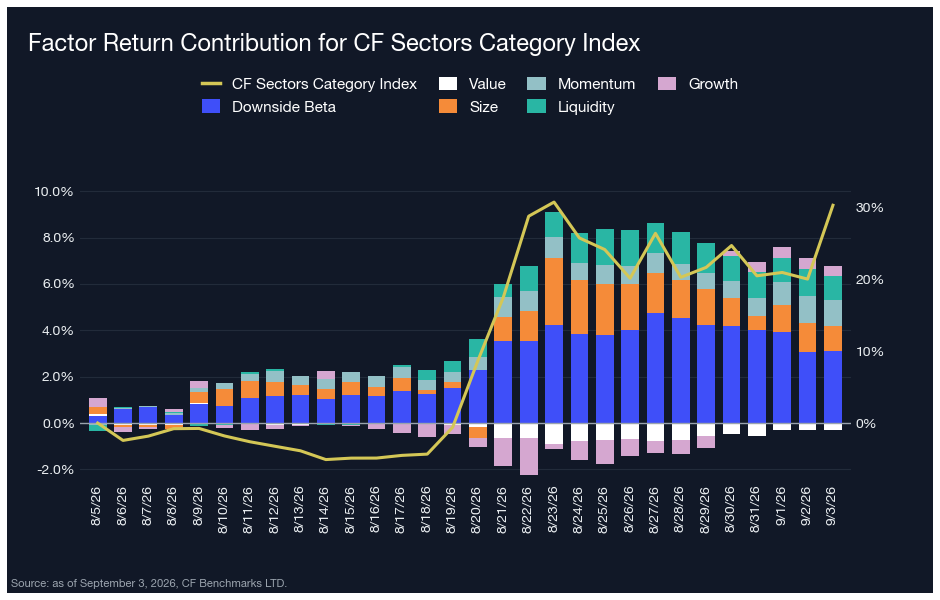
Factor contributions across the CF DACS Sectors universe total +6.5% over the trailing 30 days, against an index return of +30.3%, leaving the index 23.8 percentage points (pp) ahead of the factor sleeve, wider than the 19.5 pp gap a week earlier. Downside Beta remains the largest single contributor at +3.1%, with Size and Momentum each contributing roughly 1% and Liquidity adding a similar amount, while Value (-0.3%) was the lone drag. The widening gap means direction is doing more of the work than it was a week ago, even as the pace of the rally itself has slowed. At the token level the week was uneven: Uniswap (UNI) returned +35.6% against the index's +3.1% for the week, while PUMP lagged at -8.9%, nearly 12 pp behind. A single name is again driving a category-level number, and Sectors exposure right now is a bet on that kind of idiosyncratic dispersion as much as on the category's own direction.
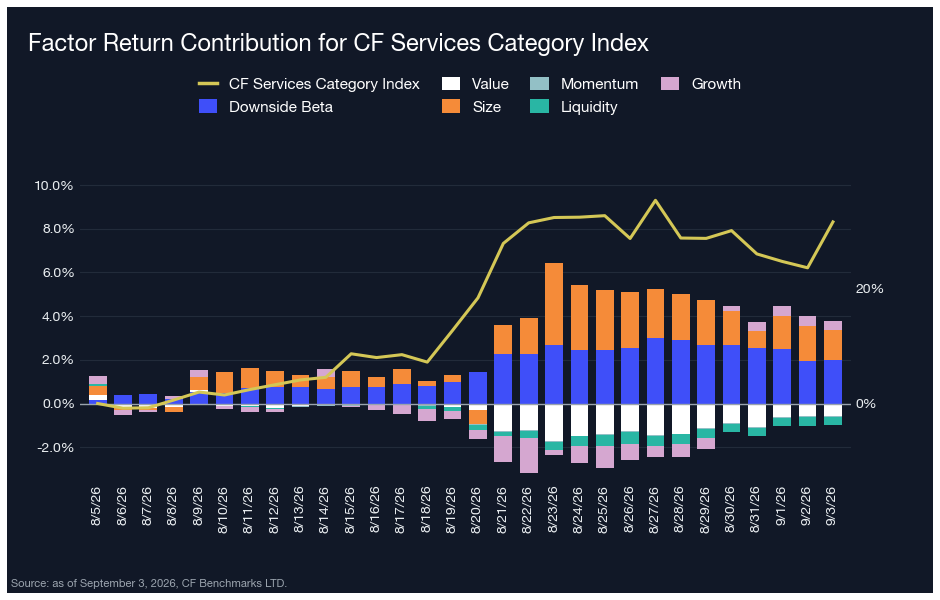
In the CF DACS Services universe, factor contributions total +2.8% against an index return of +31.5%, a 28.7 pp gap that has narrowed from 33.6 pp a week earlier even as the index itself cooled from +35.9%. Downside Beta again contributed the most at +2.0%, with Size adding +1.4%, while Value (-0.6%) was the largest drag. Services is still an index-led category, but less lopsidedly so than last week. Filecoin (FIL) led the category's constituents this week at +10.6% against the index's -2.8% for the week, while Polygon (POL) was the laggard at -12.1%, more than 9 pp behind. That the index itself fell on the week while two of its constituents moved double digits in opposite directions says the category's weekly return is compressing even as the dispersion beneath it stays wide.
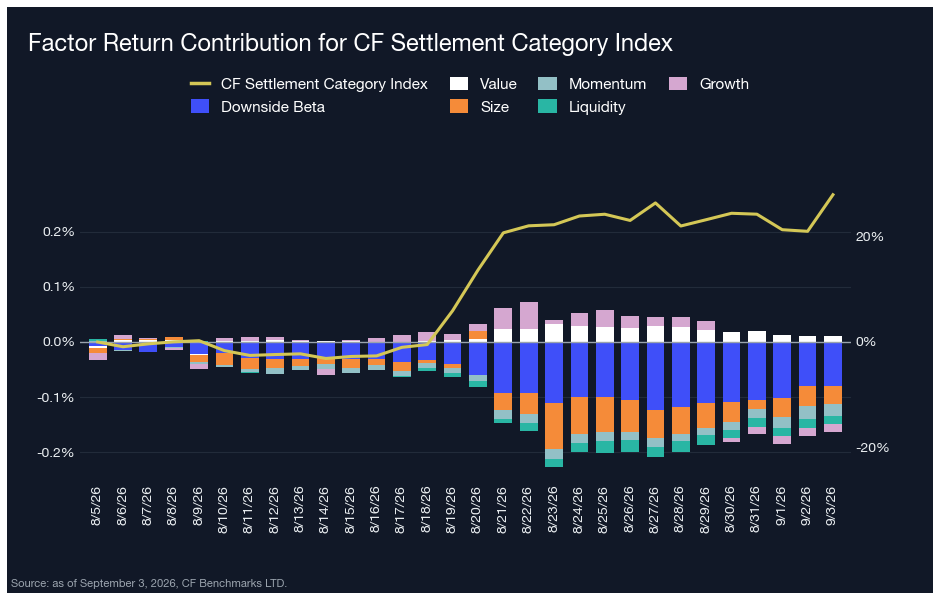
The Settlement universe again carries the clearest index-level signal of the three. Factor contributions are effectively flat at -0.2% over the trailing 30 days, while the index returned +27.9%, a 28.1 pp gap essentially unchanged from the week before. No single factor contributed more than three hundredths of a percent in either direction, so the month's advance sits almost entirely outside the systematic style basket, exactly as it did last week. Constituent returns this week stayed in a tighter band than the other two categories: Algorand (ALGO) led at +4.2% against the index's +1.2% for the week, a gap too small to call material, while Bitcoin Cash (BCH) lagged at -3.9%, just over 5 pp behind. Settlement is participating in the rally almost entirely on the strength of its largest holding. The absence of a wide idiosyncratic spread this week matters too, since this category's risk sits almost entirely in the Market's own direction rather than in any single name or factor.
Appendix: CF Factor Methodology
Market Factor
The market factor captures the broad, systematic risk that permeates the digital asset ecosystem. It reflects aggregate influences such as macroeconomic conditions, investor sentiment, and overall market volatility. As such, this factor is defined by the daily returns of the CF Broad Cap (Free Float Market Cap Weight) Index, offering a comprehensive and capitalization-weighted representation of the asset class.
Size Factor
The size factor captures the return differential associated with asset scale, reflecting the hypothesis that smaller-cap digital assets tend to outperform their larger-cap counterparts. This effect is understood to compensate for elevated operational and financial risks while exploiting potential market inefficiencies. In this framework, the size factor is defined by each asset’s fully diluted market capitalization. The value is sign-inverted so that higher z-scores are assigned to smaller assets and vice-versa.
Value Factor
The value factor reflects a protocol’s ability to generate economic output relative to its capital base and market valuation, combining measures of both efficiency and user engagement. It is constructed as the average z-score of two key ratios: transaction fees relative to total value locked (Fees/TVL) and daily active users relative to market capitalization (DAU/MCap). This composite metric captures how productively a protocol utilizes its resources while also serving as a proxy for user-driven demand. A higher combined score indicates efficient resource utilization and strong user engagement.
Momentum Factor
The momentum factor captures short-term price persistence by identifying assets that have recently exhibited strong performance. It is computed as the average z-score of two metrics: the 2 weeks cumulative performance and the 2 weeks risk-adjusted cumulative performance. This approach aligns with established findings in traditional financial literature and demonstrates empirical relevance in digital assets, where price trends tend to exhibit momentum over short horizons.
Growth Factor
The growth factor captures the expansion of a protocol’s network activity and user adoption. In the context of digital assets, it reflects metrics such as fee generation and user engagement, which serve as indicators of increased platform utilization and operational scale. The factor is defined as the average z-score of 30-day fee growth and 30-day weekly active user growth, thereby identifying assets exhibiting consistent and measurable increases in underlying network usage.
Downside Beta
The downside beta factor captures an asset’s sensitivity to adverse market conditions by isolating its behavior during periods of negative market returns. Empirical evidence shows that assets with lower downside beta tend to outperform their higher-beta counterparts over the long-term, due to their reduced participation in market drawdowns and more stable return profiles during periods of elevated volatility. As such, it is estimated through a regression of the asset’s daily returns over the most recent four-week period against market returns observed exclusively during negative sessions. The resulting value is sign-inverted to ensure that assets with lower downside exposure are assigned higher z-scores.
Liquidity Factor
The liquidity factor captures the ease with which a digital asset can be traded without significantly impacting its price. Empirical evidence shows that illiquid assets tend to command a higher risk premium than their more liquid counterparts, serving as compensation for trading friction and price volatility. To quantify this, the factor is measured using token turnover, defined as trading volume as a percentage of circulating supply. The value is sign-inverted such that higher z-scores are assigned to less liquid assets.
For further detail, view the CF Factors Methodology Document, the CF Factor Data Suite, and Our paper “A Factor Model for Digital Assets” in Springer Nature’s Mathematical Research for Blockchain Economy.
The information contained within is for educational and informational purposes ONLY. It is not intended nor should it be considered an invitation or inducement to buy or sell any of the underlying instruments cited including but not limited to cryptoassets, financial instruments or any instruments that reference any index provided by CF Benchmarks Ltd. This communication is not intended to persuade or incite you to buy or sell security or securities noted within. Any commentary provided is the opinion of the author and should not be considered a personalised recommendation. Please contact your financial adviser or professional before making an investment decision.
Note: Some of the underlying instruments cited within this material may be restricted to certain customer categories in certain jurisdictions.
Changes to the Token Market Price Benchmarks Series - Market Prices – 20 October 2026
The Administrator has confirmed changes to the Token Market Price Family for the period 13 October 2026 to 20 October 2026

CF Benchmarks
Altcoins Lag as Bitcoin Tests The 50-Day Moving Average
Digital assets fell broadly over the past week as Bitcoin slipped to a moving average, with inflation prints and an equity sell-off in the background. Losses grew with distance from Bitcoin, hitting diversified and smaller-cap exposure hardest, while implied volatility rose.
Mark Pilipczuk
Factor Friday - October 16, 2026
Size led the factor table for a third week at 0.59% as the Market rebounded 0.40% and 15 of 35 Broad Cap tokens closed higher. Momentum fell 1.58% in a rebound led by laggards, and Size's weekly print has narrowed from 8.86% to 0.59% in three weeks, even as its year-to-date lead holds at 22.81%.
Mark Pilipczuk
By clicking Accept, you consent to CF Benchmarks's use of cookies.
Visit Cookie Settings to learn how CF Benchmarks uses cookies and to adjust your preferences.