
Jun 05, 2026
Factor Friday - June 5, 2026
Factor Friday: A Top-Heavy Drawdown as the Largest Names Lead the Decline
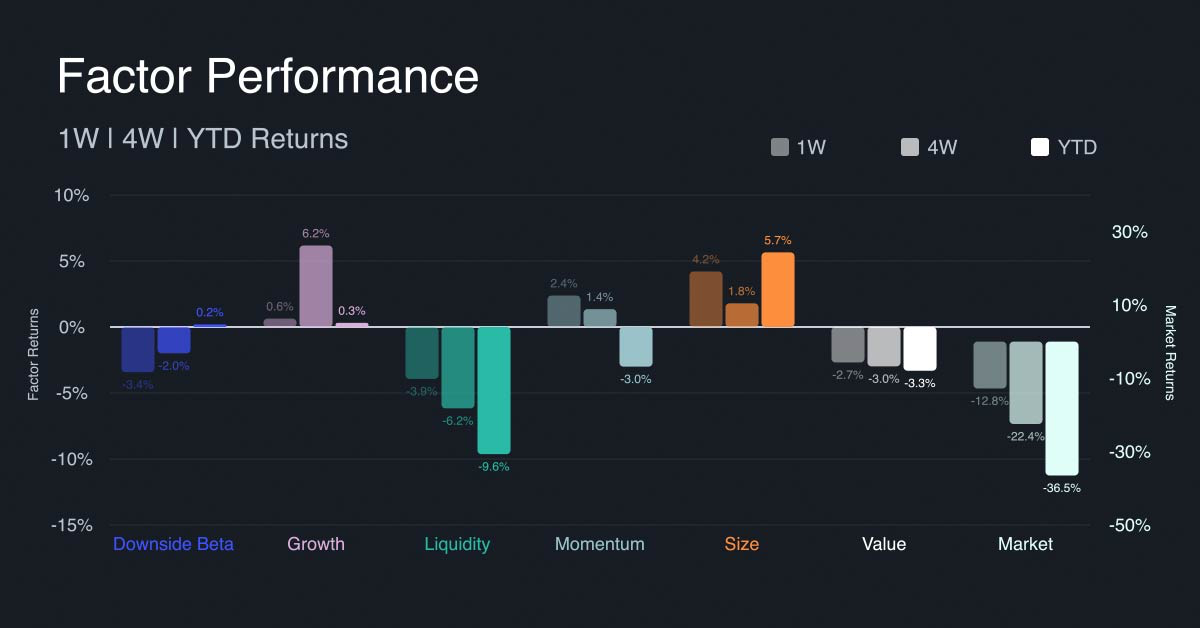
The week was about damage, not direction. The Market factor fell 12.76% on the week, its deepest single-week decline of the visible window, taking the four-week reading to -22.45% and the year-to-date to -36.49% from -27.20% last week. What matters for positioning is where the pain landed. Size led all factors at +4.20%, and because the factor is sign-inverted that means the largest names fell hardest while smaller-cap exposures held up in relative terms. Downside Beta turned negative at -3.42%, a second signal that the normally defensive, low-downside-beta cohort did not cushion this drawdown. Momentum held positive at +2.38% as recent relative winners persisted, while Growth decelerated sharply to +0.63% from +4.33% a week ago, though its four-week reading remains the strongest at +6.17%. Value reversed to -2.68% and Liquidity fell further to -3.93%, the worst non-market factor and a deepening of the prior week's flight to liquidity. The takeaway for investors is that this was a top-heavy selloff that punished the index's largest, most defensive constituents, so broad-beta and large-cap books absorbed the full move while smaller and liquidity-tilted exposures lost less. The risk to that read is a relief rally in the beaten-down mega-caps, which would reverse the small-over-large leadership quickly.
Rolling Factor Rankings and Rotation
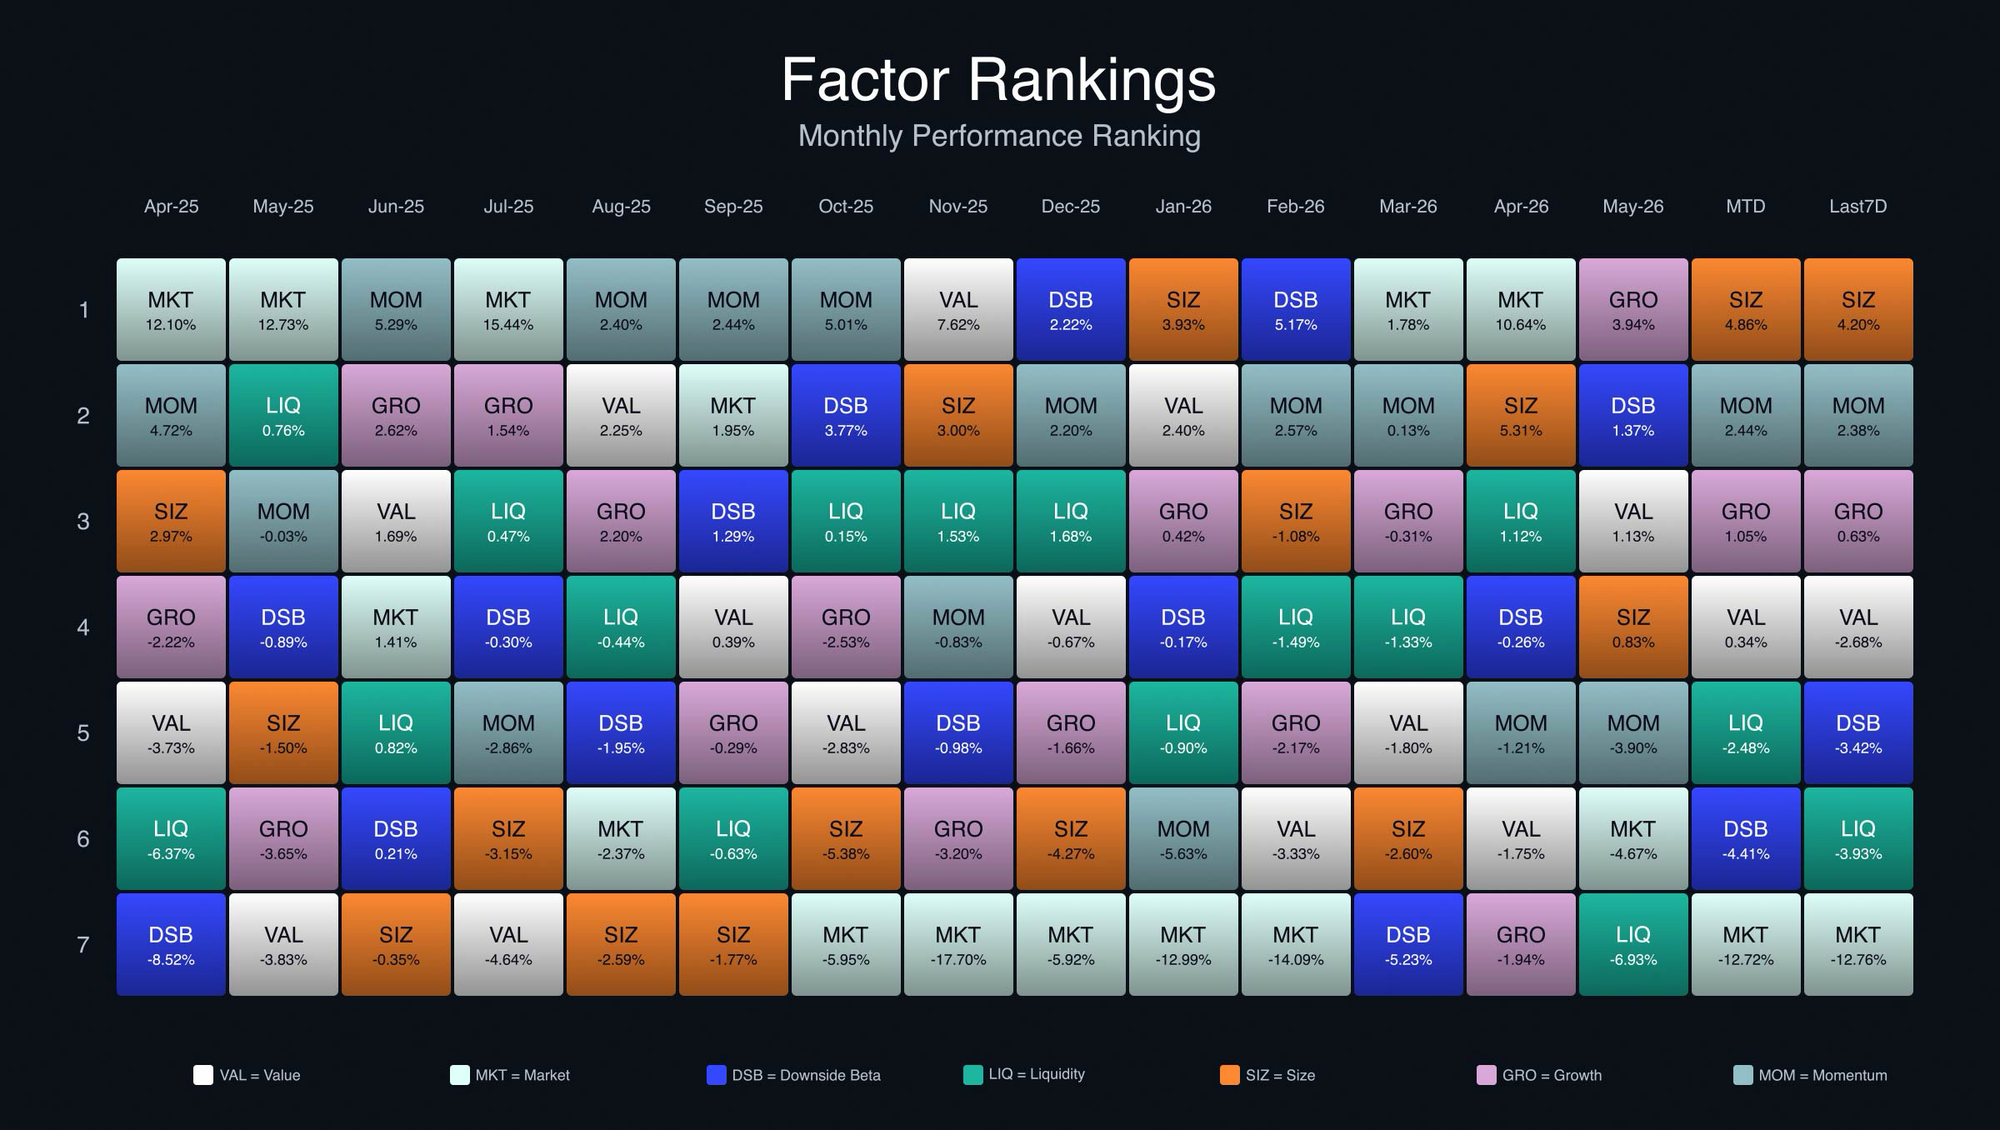
Leadership rotated again. Size now tops both the trailing seven-day and month-to-date rankings, displacing Growth, which led last week and has slipped to third. The deeper signal is structural: the Market factor has sat at or near the bottom of the board for weeks and this week printed -12.76%, the worst single-week reading in the visible window, confirming that the market is shedding broad beta wholesale rather than rotating within it. Downside Beta, which led for stretches earlier in the year and is the kind of defensive exposure investors lean on in a selloff, fell to near the bottom at -3.42%. That is the unusual part of this week: the factors that normally provide ballast did not. The read-through is that leadership has narrowed to small-cap dispersion (Size) and trend persistence (Momentum) inside a tape that is repricing broad risk lower, and the watch item is whether Size leadership holds or unwinds if the largest names stabilize.
Market and Key Factor Betas
Market Beta
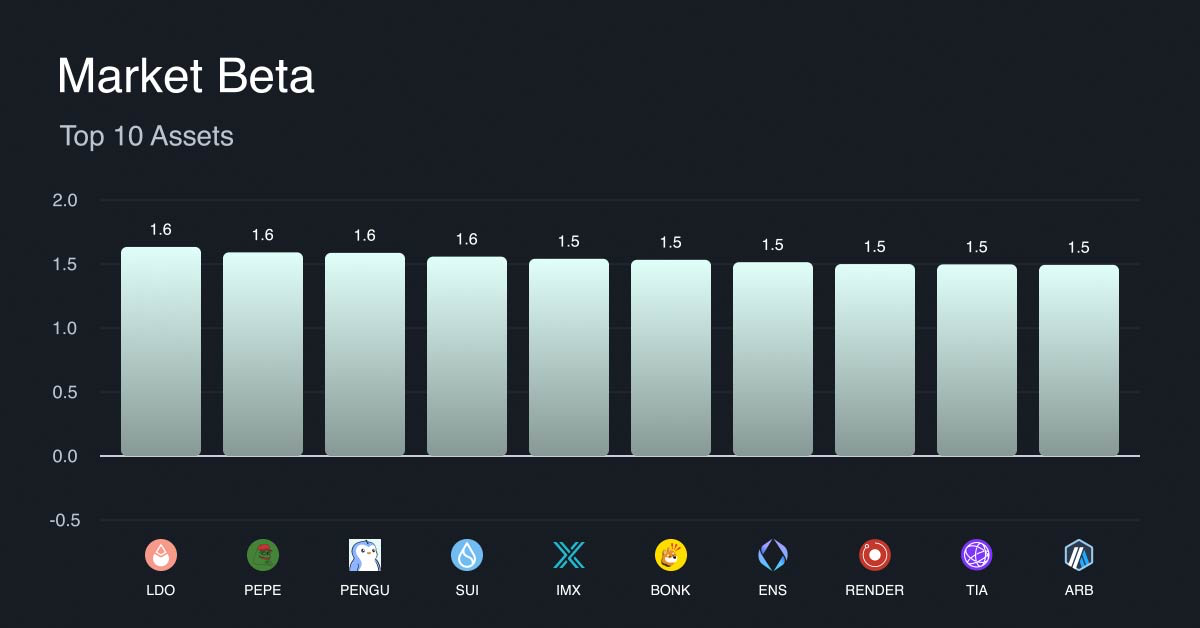
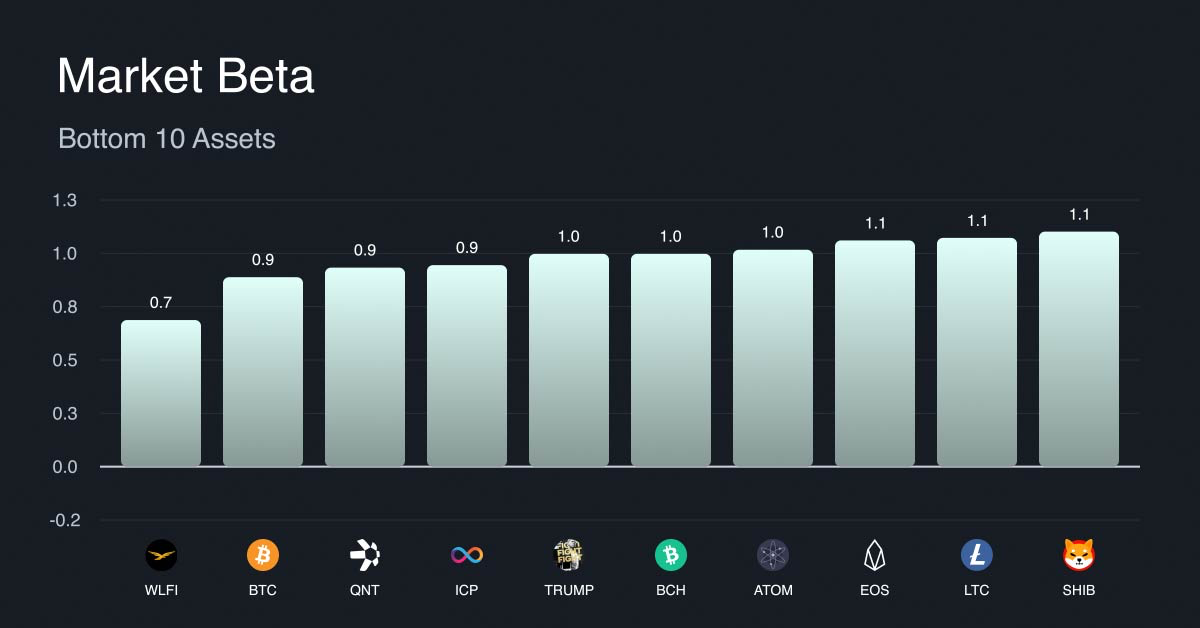
The Market factor measures broad systematic exposure. The high market-beta cohort remains dominated by meme coins, layer-2 and infrastructure tokens, and liquid DeFi names, the assets that amplify moves in both directions, while the low-beta cohort is anchored by Bitcoin and older large-cap incumbents. Composition was unchanged on the week. The striking detail is not the composition but the behavior: with the Market factor down 12.76%, the low-beta defensive basket that investors hold for protection did not deliver it, a point corroborated by the negative Downside Beta print. The read-through is that beta dispersion compressed in the selloff, so leaning into low-beta large caps offered less shelter this week than the labels would suggest.
Size
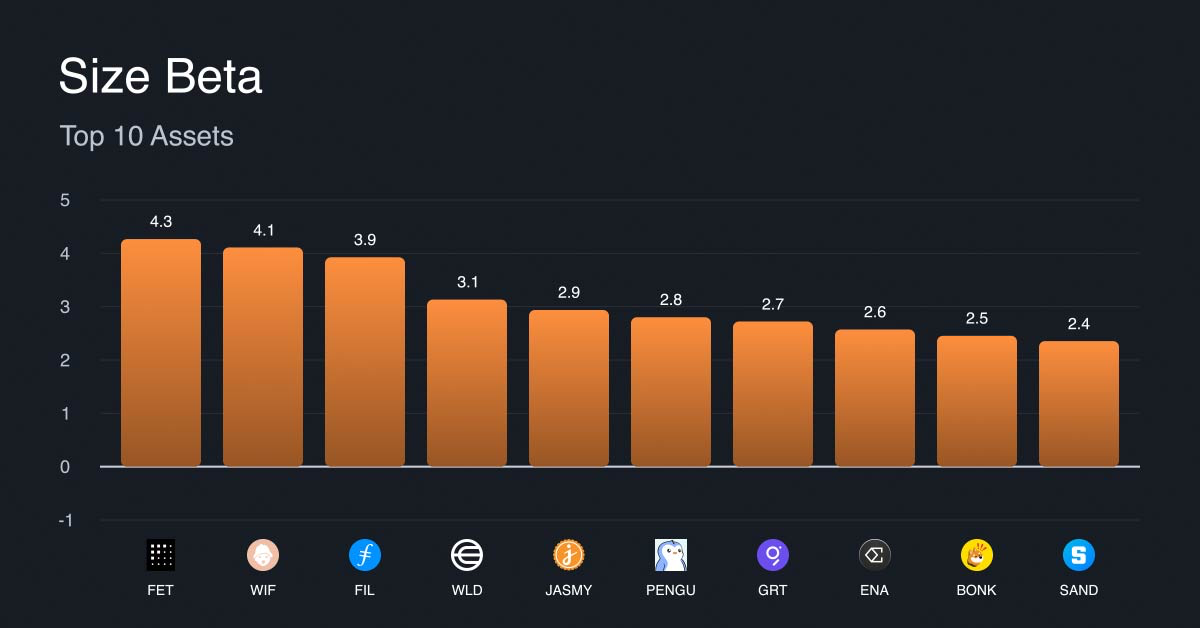
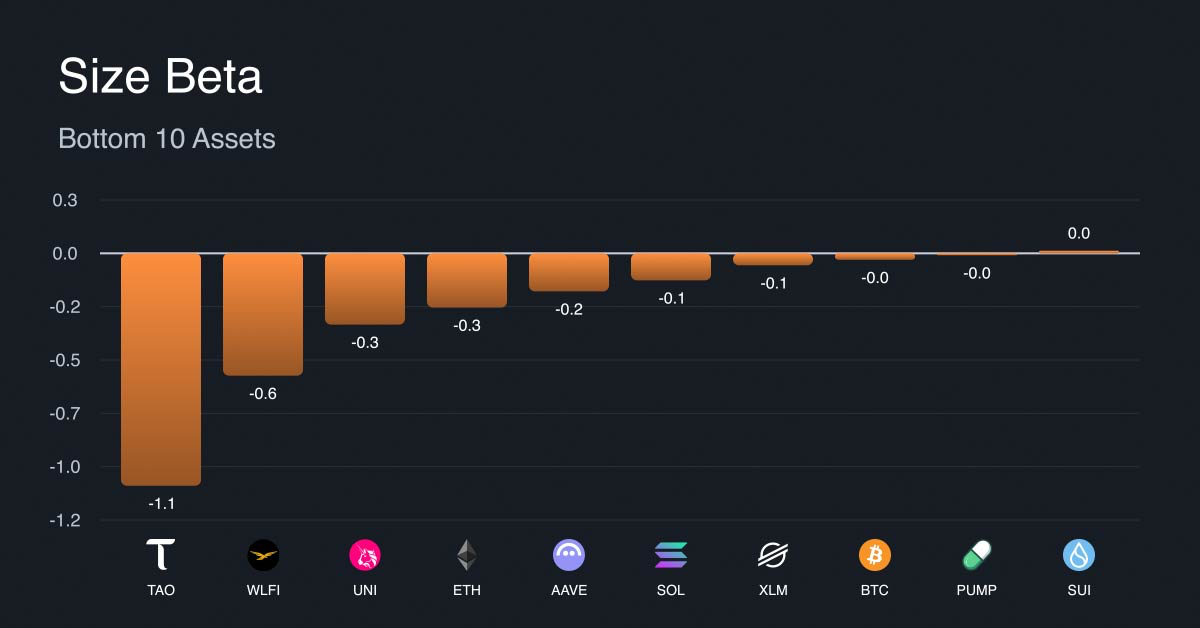
Size, this week's leader, is sign-inverted: a positive return means smaller-capitalization assets are outperforming larger ones. The high size-beta cohort is concentrated in AI infrastructure, meme, and gaming-adjacent small caps, with WLD and ENA entering the list this week as ICP and MKR dropped out, while the low size-beta cohort is precisely the set of mega-caps, Bitcoin and Ether among them, that anchor the index. The +4.20% print therefore locates the damage at the top of the cap structure: the largest constituents led the decline and the smaller, higher-beta names held up in relative terms. The read-through is that portfolios concentrated in the majors felt this drawdown most acutely, and the forward risk is mean reversion, since a stabilization in Bitcoin and Ether would flip the small-over-large leadership.
Liquidity
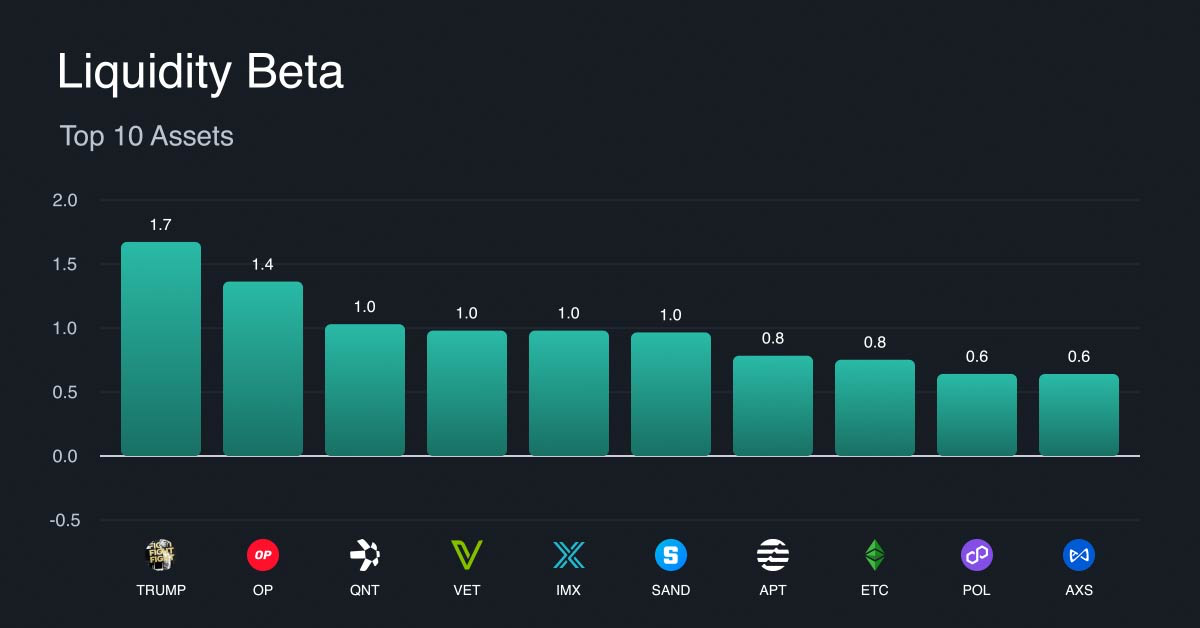
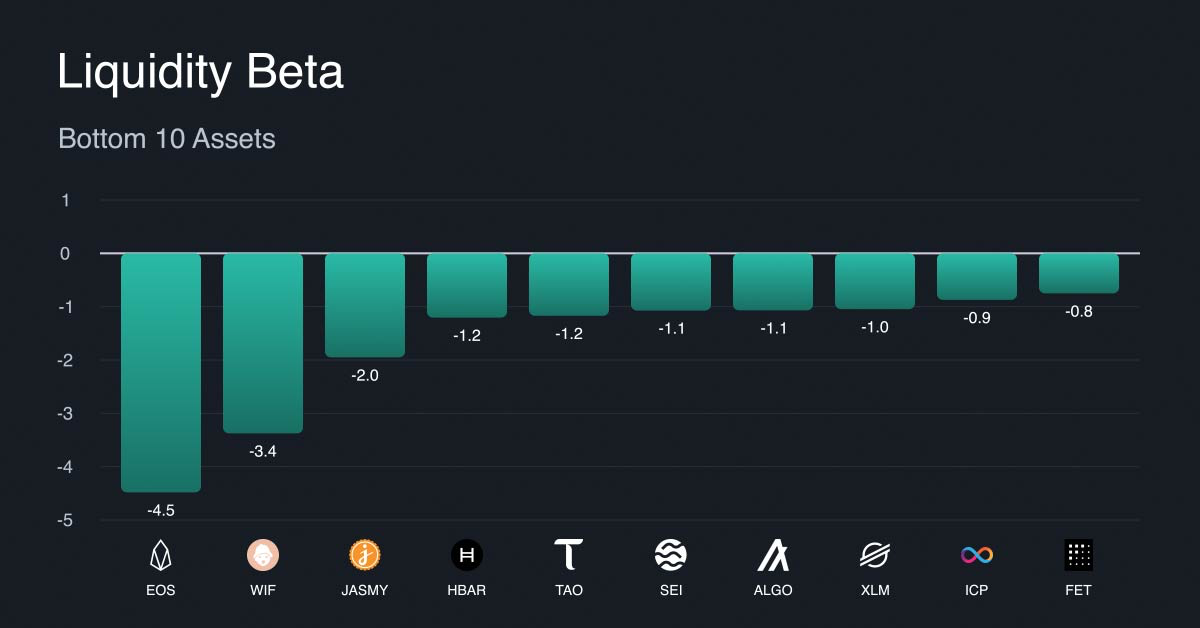
Liquidity is also sign-inverted: a positive return means less liquid assets are outperforming. This week's -3.93%, the worst non-market factor and a step down from -2.73% last week, signals the opposite, with the more liquid cohort holding up better as participants favored names they could exit cleanly. The high liquidity-beta cohort, the more thinly traded mid-caps, saw AXS enter and BCH exit, while the most liquid names led on a relative basis. The read-through is a persistent and intensifying flight to liquidity: in a drawdown investors keep paying up for exit certainty, so thin-float tokens carry added risk here even where their fundamentals are intact. Read alongside Size, the picture is nuanced. The selloff hit the index's largest constituents hardest, yet across the broader cross-section a liquidity preference persisted, so this was not the textbook flight into large, liquid blue chips but a repricing that started at the very top of the market.
What Factors are Driving Markets
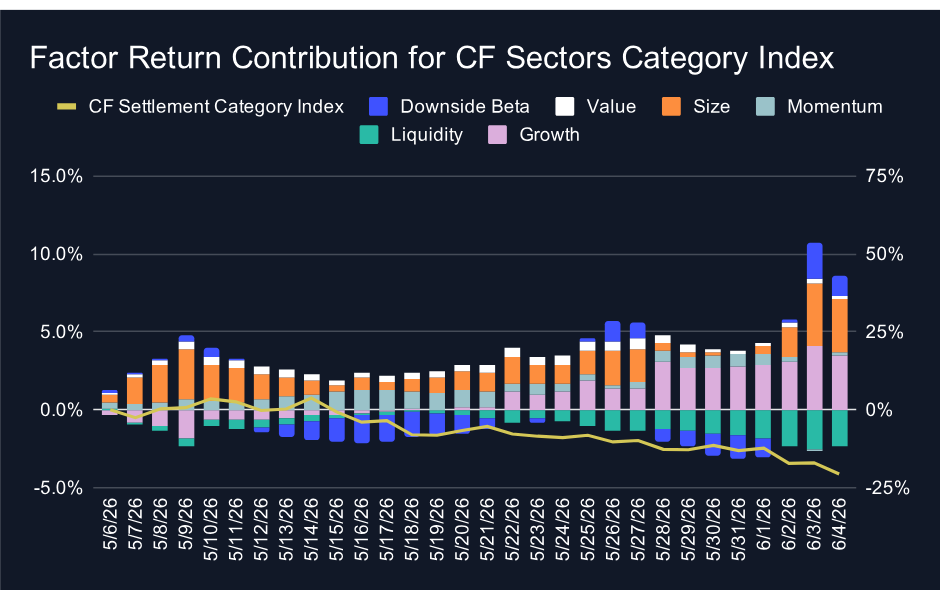
Across all three CF DACS classifications the gap between factor contributions and index returns blew out to an extreme. A week ago factor contributions had just moved ahead of flat-to-negative indices by a few percentage points; this week, with indices in freefall, factor contributions stayed positive or flat while the indices collapsed, widening the gaps several-fold. Size has joined Growth as a co-dominant contributor, mirroring the small-over-large leadership in the headline factors. The message is that factor exposure cushioned a brutal index decline, and being positioned in the leading factors dramatically outperformed holding the falling benchmark.
In Sectors, cumulative factor contributions totaled +6.35% against an index return of -20.59%, a gap of 26.94 percentage points with factor contributions far exceeding the index. Growth (+3.49%) and Size (+3.39%) were the co-dominant contributors, while Liquidity was the largest drag at -2.29%. That gap is nearly four times the prior week's 7.36 percentage points, showing the disconnect has not merely persisted but widened sharply as the index fell apart.
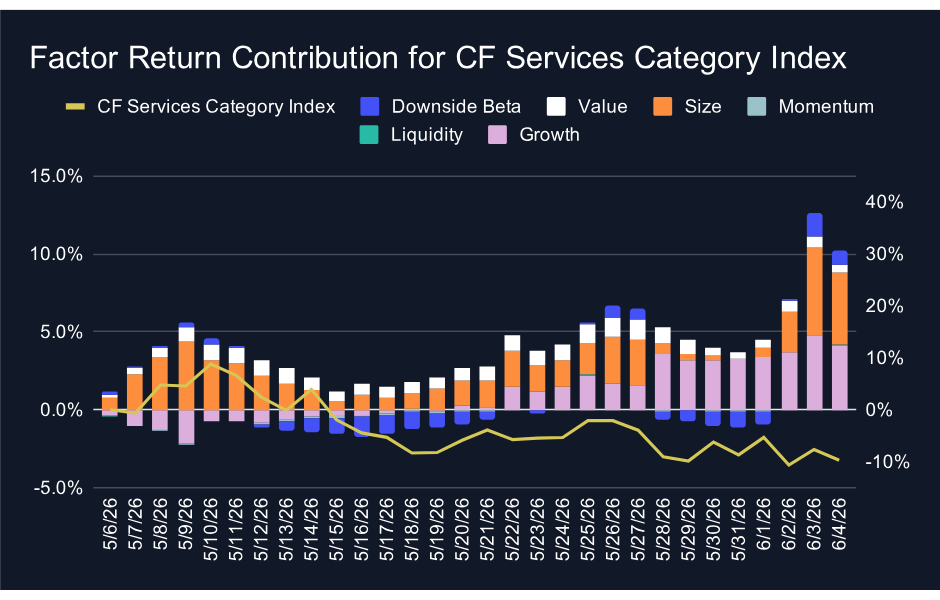
In Services, factor contributions totaled +10.21% against an index return of -9.70%, a gap of 19.91 percentage points in favor of factor contributions. Size led at +4.69% with Growth close behind at +4.12%, and no factor was a meaningful drag. Services was the category where selection paid the most this week, with factor positioning worth roughly twenty percentage points over the index.
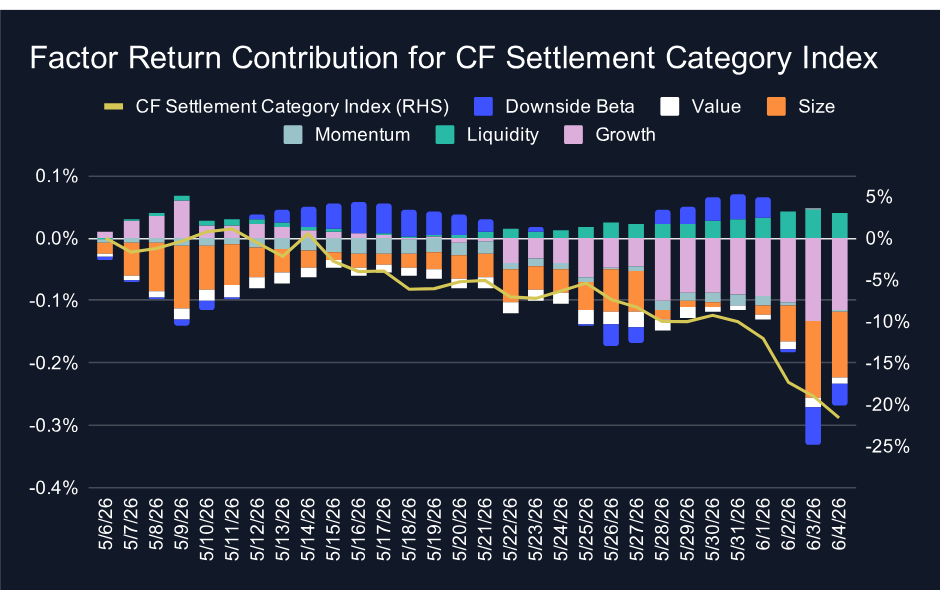
In Settlement, factor contributions were essentially flat at -0.23% against an index return of -21.60%, leaving a gap of 21.38 percentage points with factor contributions ahead of the index. Contributions were muted across every factor, consistent with the category's concentration in large, established settlement assets, the very cohort that led the decline. The read-through across all three categories is that selection, not direction, drove returns this week, and the magnitude of these gaps is unusual and tends to converge, so watch for the spread to narrow as either the index stabilizes or factor leadership fades.
Appendix: CF Factor Methodology
Market Factor
The market factor captures the broad, systematic risk that permeates the digital asset ecosystem. It reflects aggregate influences such as macroeconomic conditions, investor sentiment, and overall market volatility. As such, this factor is defined by the daily returns of the CF Broad Cap (Free Float Market Cap Weight) Index, offering a comprehensive and capitalization-weighted representation of the asset class.
Size Factor
The size factor captures the return differential associated with asset scale, reflecting the hypothesis that smaller-cap digital assets tend to outperform their larger-cap counterparts. This effect is understood to compensate for elevated operational and financial risks while exploiting potential market inefficiencies. In this framework, the size factor is defined by each asset’s fully diluted market capitalization. The value is sign-inverted so that higher z-scores are assigned to smaller assets and vice-versa.
Value Factor
The value factor reflects a protocol’s ability to generate economic output relative to its capital base and market valuation, combining measures of both efficiency and user engagement. It is constructed as the average z-score of two key ratios: transaction fees relative to total value locked (Fees/TVL) and daily active users relative to market capitalization (DAU/MCap). This composite metric captures how productively a protocol utilizes its resources while also serving as a proxy for user-driven demand. A higher combined score indicates efficient resource utilization and strong user engagement.
Momentum Factor
The momentum factor captures short-term price persistence by identifying assets that have recently exhibited strong performance. It is computed as the average z-score of two metrics: the 2 weeks cumulative performance and the 2 weeks risk-adjusted cumulative performance. This approach aligns with established findings in traditional financial literature and demonstrates empirical relevance in digital assets, where price trends tend to exhibit momentum over short horizons.
Growth Factor
The growth factor captures the expansion of a protocol’s network activity and user adoption. In the context of digital assets, it reflects metrics such as fee generation and user engagement, which serve as indicators of increased platform utilization and operational scale. The factor is defined as the average z-score of 30-day fee growth and 30-day weekly active user growth, thereby identifying assets exhibiting consistent and measurable increases in underlying network usage.
Downside Beta
The downside beta factor captures an asset’s sensitivity to adverse market conditions by isolating its behavior during periods of negative market returns. Empirical evidence shows that assets with lower downside beta tend to outperform their higher-beta counterparts over the long-term, due to their reduced participation in market drawdowns and more stable return profiles during periods of elevated volatility. As such, it is estimated through a regression of the asset’s daily returns over the most recent four-week period against market returns observed exclusively during negative sessions. The resulting value is sign-inverted to ensure that assets with lower downside exposure are assigned higher z-scores.
Liquidity Factor
The liquidity factor captures the ease with which a digital asset can be traded without significantly impacting its price. Empirical evidence shows that illiquid assets tend to command a higher risk premium than their more liquid counterparts, serving as compensation for trading friction and price volatility. To quantify this, the factor is measured using token turnover, defined as trading volume as a percentage of circulating supply. The value is sign-inverted such that higher z-scores are assigned to less liquid assets.
For further detail, view the CF Factors Methodology Document, the CF Factor Data Suite, and Our paper “A Factor Model for Digital Assets” in Springer Nature’s Mathematical Research for Blockchain Economy
The information contained within is for educational and informational purposes ONLY. It is not intended nor should it be considered an invitation or inducement to buy or sell any of the underlying instruments cited including but not limited to cryptoassets, financial instruments or any instruments that reference any index provided by CF Benchmarks Ltd. This communication is not intended to persuade or incite you to buy or sell security or securities noted within. Any commentary provided is the opinion of the author and should not be considered a personalised recommendation. Please contact your financial adviser or professional before making an investment decision.
Note: Some of the underlying instruments cited within this material may be restricted to certain customer categories in certain jurisdictions.
Changes to the Token Market Price Benchmarks Series - Market Prices – 21 July 2026
The Administrator has confirmed changes to the Token Market Price Family for the period 14 July 2026 to 21 July 2026.

CF Benchmarks
Softer CPI Reprices July Hike Risk & Lifts Digital Assets
Digital assets extended their recovery over the past week as cooler US inflation prints repriced Fed expectations; the bid was broad across the large cap indices, growth factor leadership returned, stablecoin funding repriced lower, and stress stayed isolated in names hit by token-specific news.
Mark Pilipczuk
Notice of the Demising of CF Dai-Dollar Settlement Price and Spot Rate
The Administrator announces that it will demise the CF Dai-Dollar Settlement Price (DAIUSD_RR) and CF Dai-Dollar Spot Rate (DAIUSD_RTI) which are members of the CF Digital Asset Index Family.
CF Benchmarks
By clicking Accept, you consent to CF Benchmarks's use of cookies.
Visit Cookie Settings to learn how CF Benchmarks uses cookies and to adjust your preferences.