
Jun 26, 2026
Factor Friday - June 26, 2026
Liquidity Leads a Down Week as Size Holds Its Year-to-Date Edge
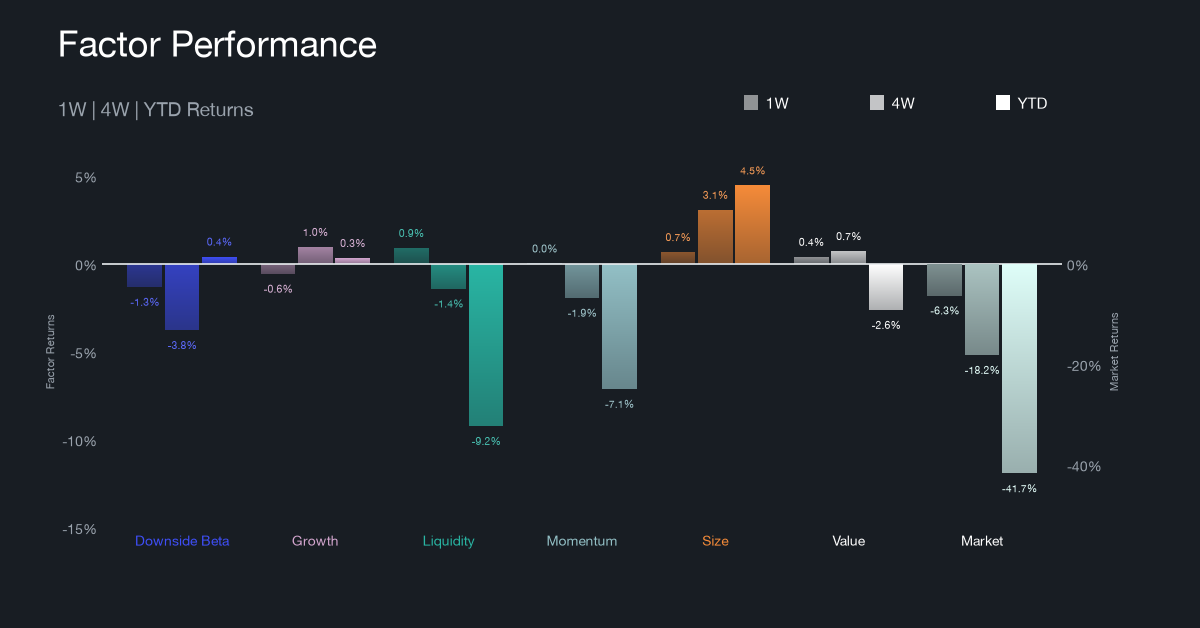
The broad market sold off sharply, with the Market factor down -6.35% as digital assets fell across the board. Cross-sectional factors held up far better. Liquidity led the seven-factor field at +0.90%, with Size close behind at +0.66% and Value at +0.39%. Momentum finished essentially flat at +0.02%, while Growth (-0.58%) and Downside Beta (-1.33%) lagged. Because Liquidity and Size are sign-inverted in the CF model, their positive returns indicate that less liquid and smaller-capitalization names outperformed even as broad beta exposure punished portfolios tied to the overall market. On a year-to-date basis, Size (+4.46%) and Downside Beta (+0.41%) remain the only two factors in positive territory, while the Market factor has now surrendered -41.74% since the start of the year. Liquidity's leadership this week stands in sharp contrast to its -9.24% year-to-date return, a reminder that short-term factor leadership can diverge from the longer trend.
Rolling Factor Rankings and Rotation
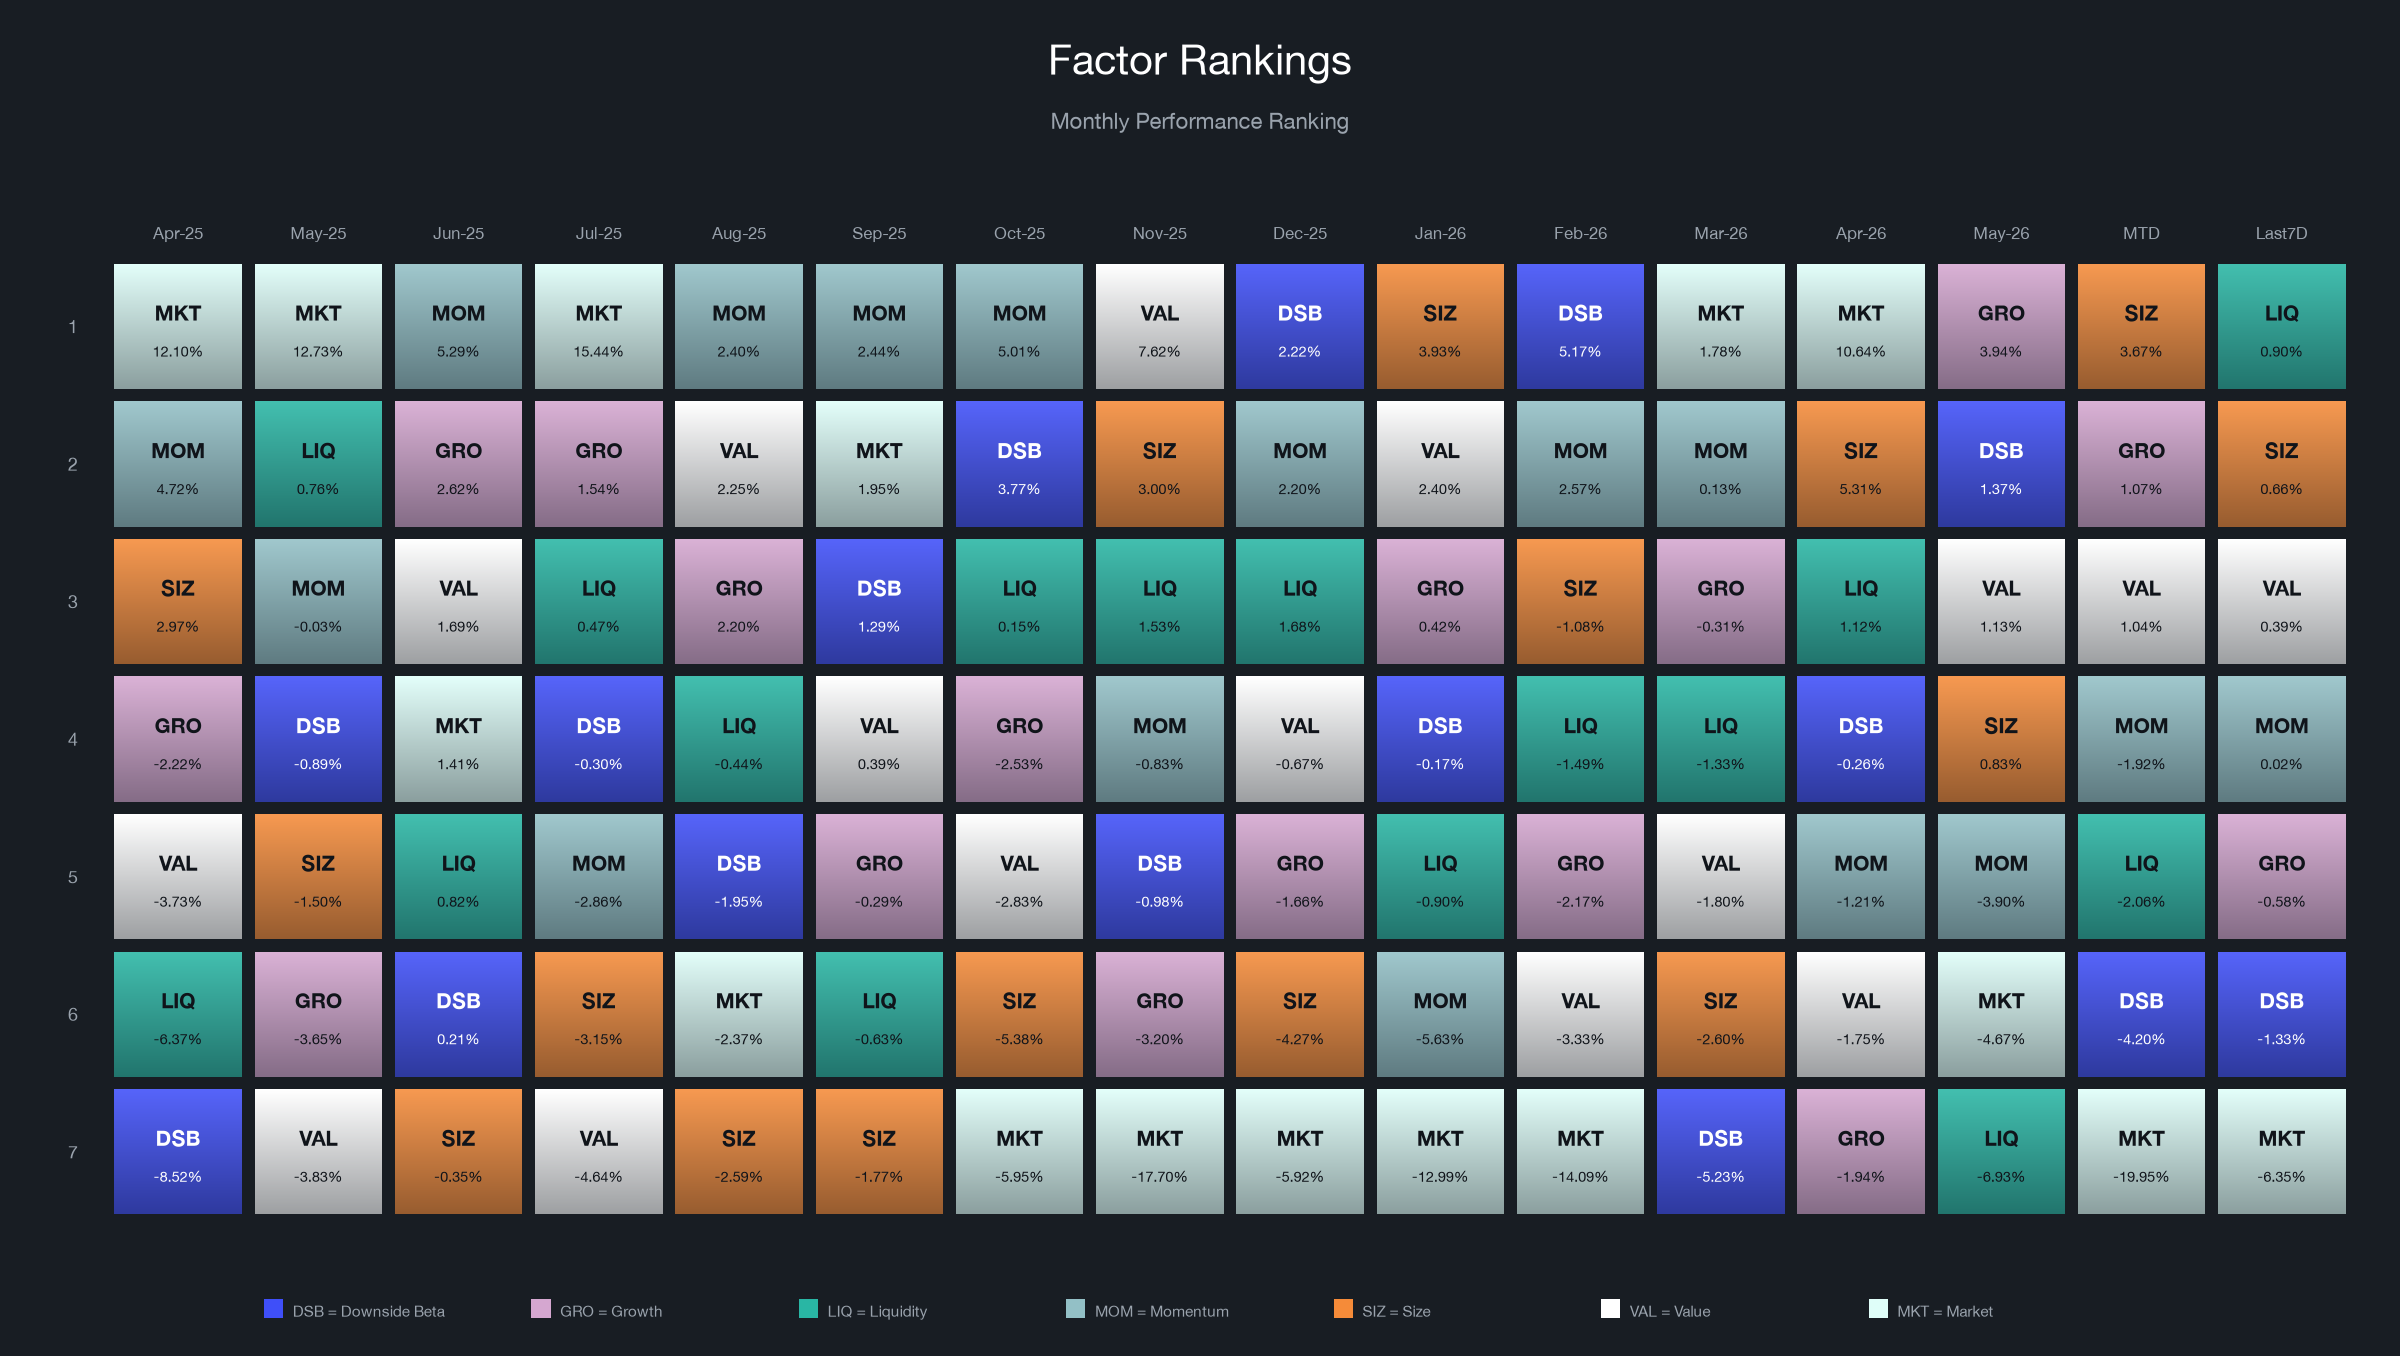
Liquidity claimed the top weekly rank, with Size second and Value third, a defensive and quality-tilted ordering that sits well below the double-digit factor swings seen earlier in the cycle. The more durable signal is Size, which leads the month-to-date table at +3.67% and has held near the top of the rankings for several weeks. Momentum, which dominated the rankings through much of mid-to-late 2025, finished mid-pack on the week and remains negative month-to-date (-1.92%), over four weeks (-1.95%), and year-to-date (-7.13%), confirming that last year's trend-following leadership has not returned. The overall market sits last across every horizon, at -6.35% on the week, -19.95% month-to-date, and -41.74% year-to-date. That consistency underscores that the week's losses were a broad-market event rather than a factor-specific one, and it continues to reward investors who lean on cross-sectional factor selection rather than passive exposure in the current environment.
Market and Key Factor Betas
Market Beta
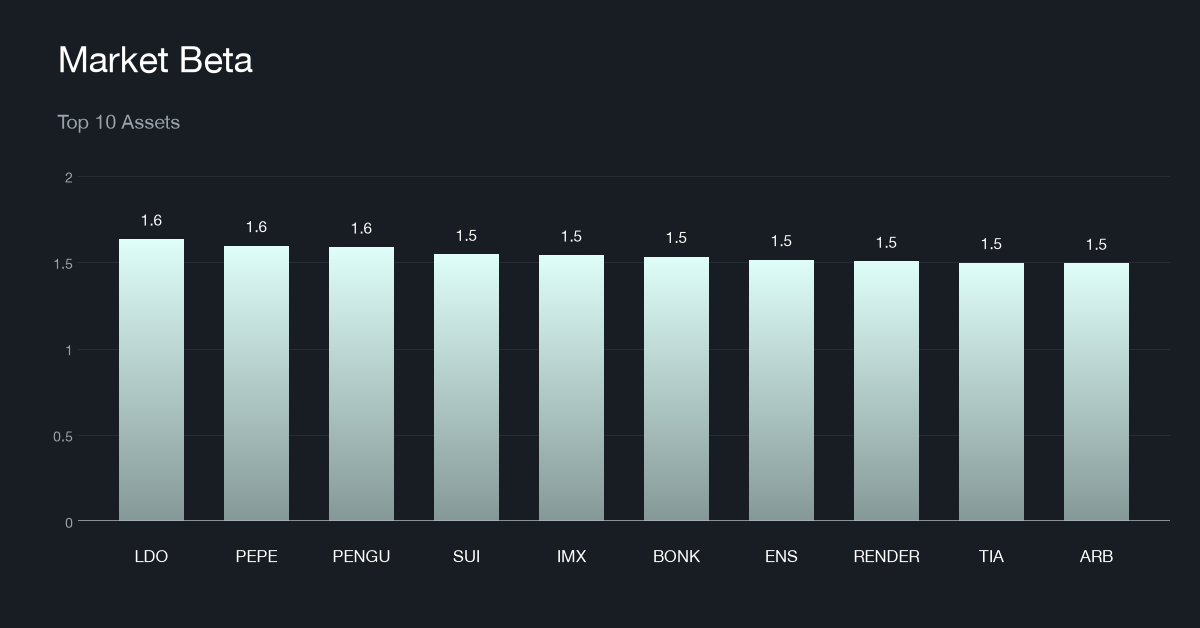
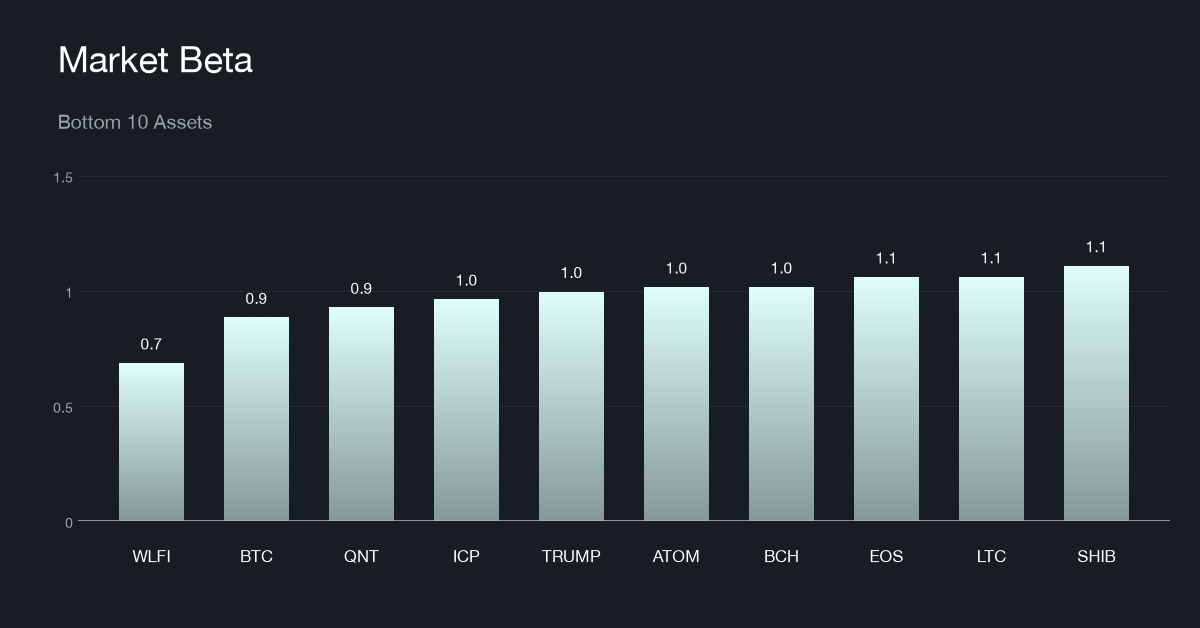
The high market-beta cohort is concentrated in meme coins, layer-2 governance tokens, and newer layer-1 and infrastructure names, with betas clustered above 1.5. These are the assets that amplify broad market moves in both directions and bore the brunt of this week's selloff. At the defensive end, Bitcoin sits near 0.88 and a large-cap governance token anchors the bottom of the list below 0.7, both behaving as relative safe havens within the digital asset universe. The wide spread between the high- and low-beta cohorts continues to give investors a meaningful lever for dialing systematic risk up or down within a crypto allocation.
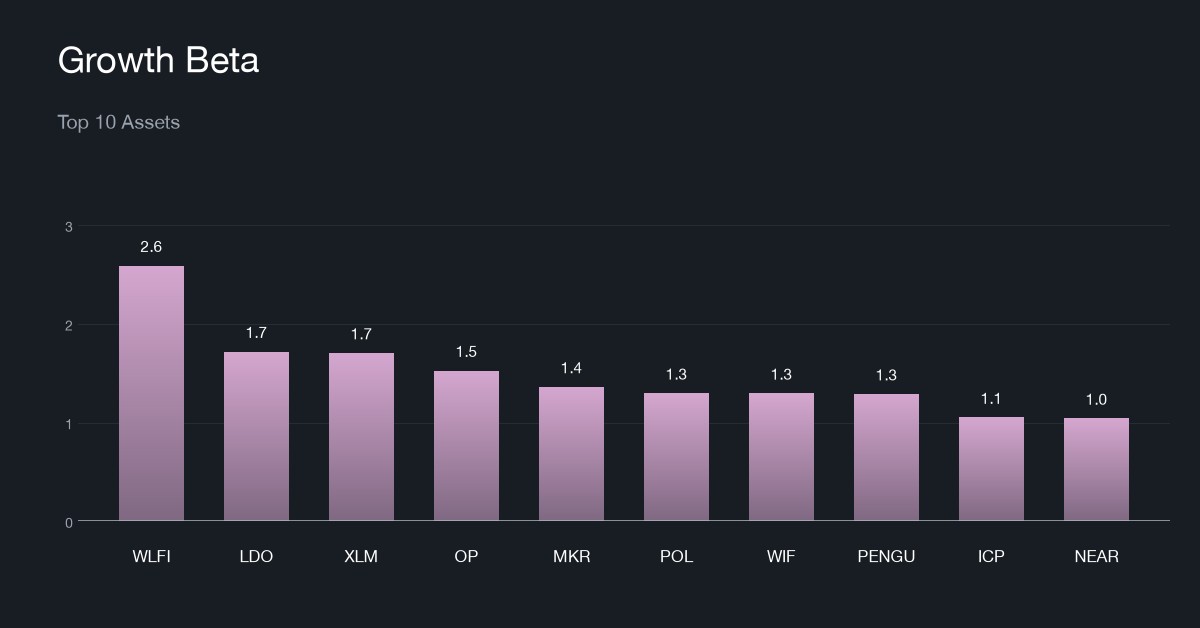
Growth
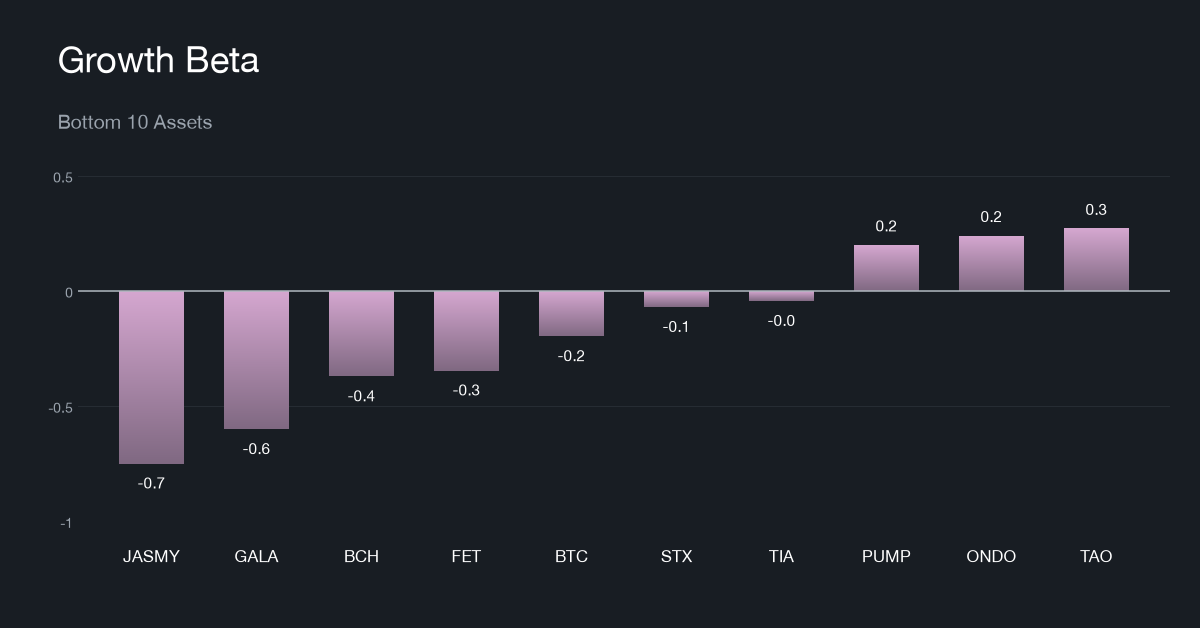
Top growth-beta assets lean toward DeFi governance, cross-chain infrastructure, and social and launchpad tokens, protocols with expanding user activity and rising fee generation. The low end of the cohort is populated by older proof-of-work chains and AI-focused tokens where engagement has plateaued, with a launchpad token rotating into the bottom 10 this week as Filecoin moved out. With the Growth factor slightly negative on the week at -0.58%, the market showed little appetite for paying up for network expansion, a shift in tone from the growth-led weeks that preceded it.
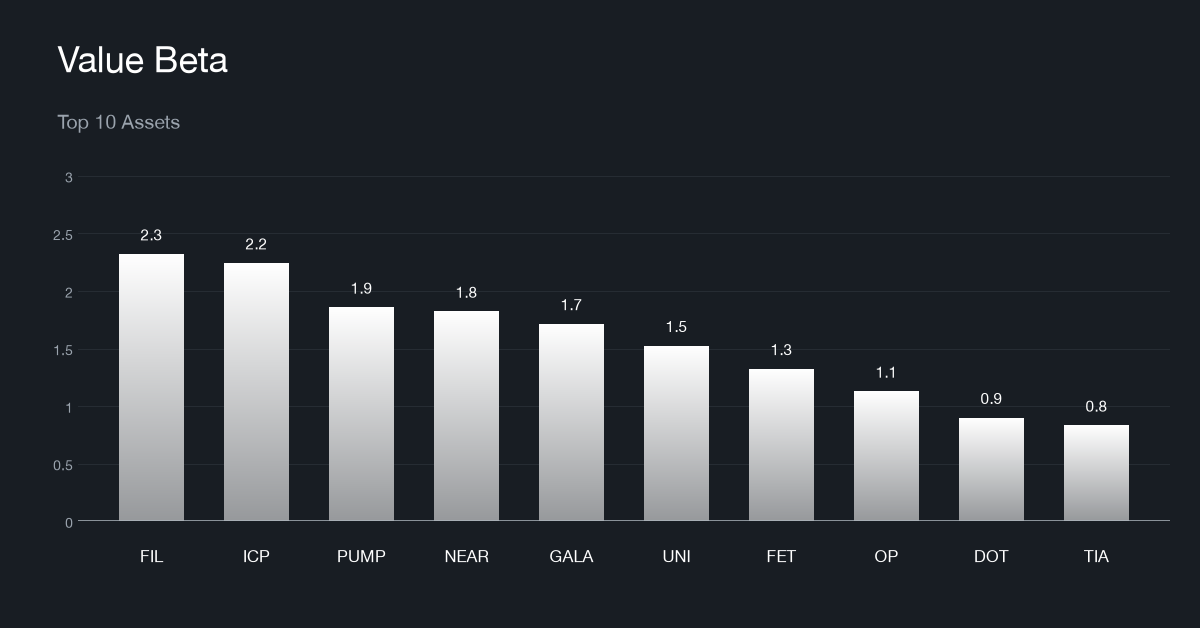
Value
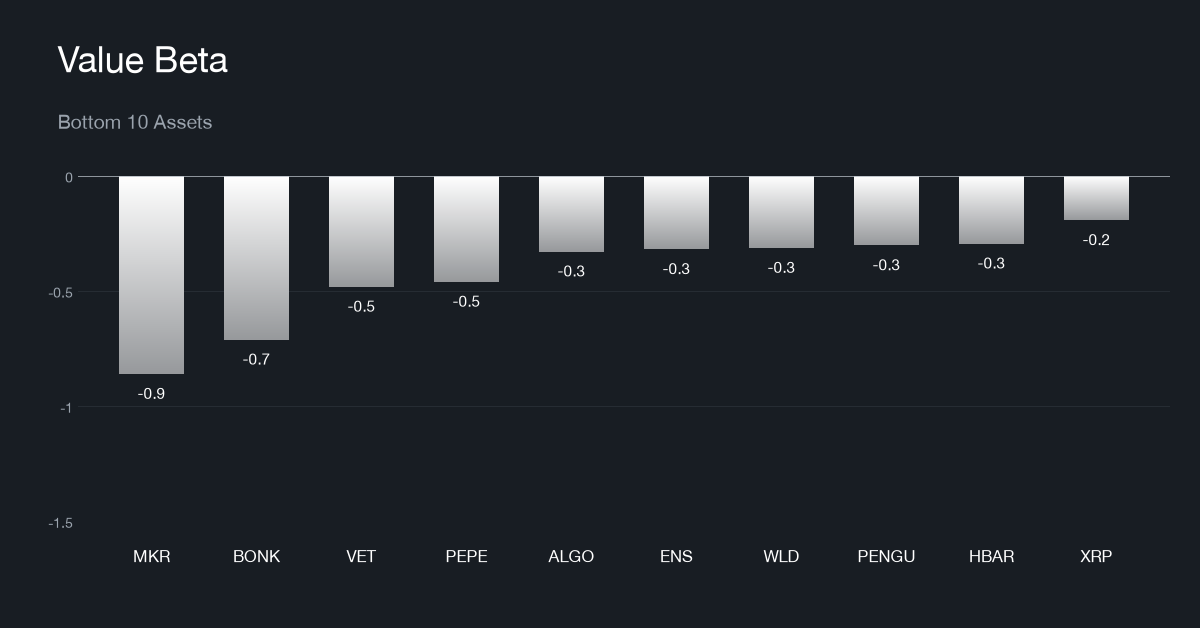
High value-beta assets cluster in storage and compute networks alongside blue-chip DeFi protocols, names generating meaningful economic output relative to their market capitalizations. The low value-beta cohort is dominated by meme and governance tokens priced well above what current fundamentals would justify. Value returned +0.39% on the week, a modest positive that keeps it mid-pack but leaves it negative year-to-date at -2.64%, suggesting fundamental valuation has yet to become a durable driver of cross-sectional returns.
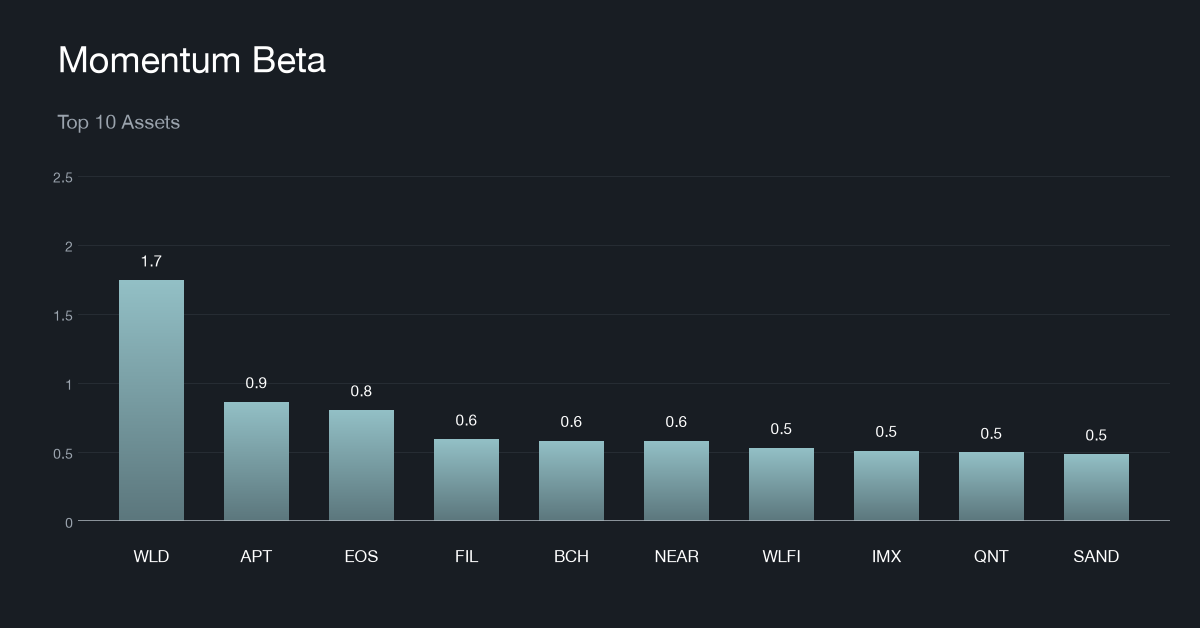
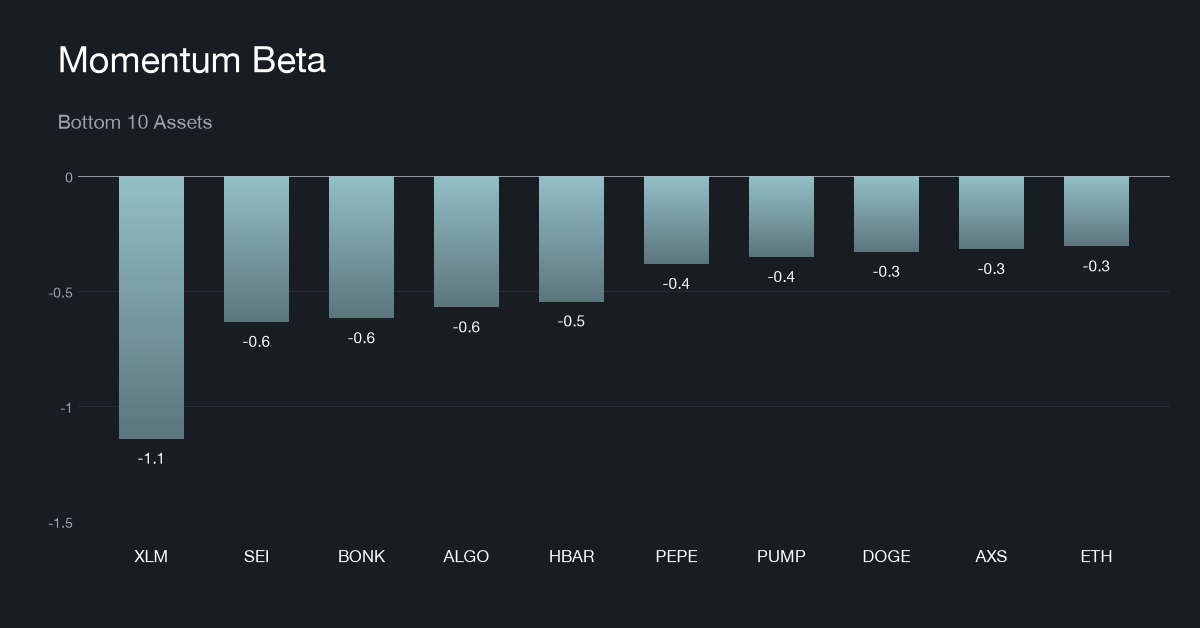
Momentum
The high momentum-beta cohort captures this cycle's recent trend leaders, spanning select layer-1s, exchange tokens, and storage names. The low end is anchored by assets in sustained downtrends, and notably Ether rotated into the bottom 10 this week as Render exited, a sign that recent price weakness has pushed even a core asset into the low-momentum group. Momentum itself finished flat on the week at +0.02% and remains firmly negative on every longer horizon, reinforcing that trend-following has not regained its 2025 footing.
What Factors are Driving Markets
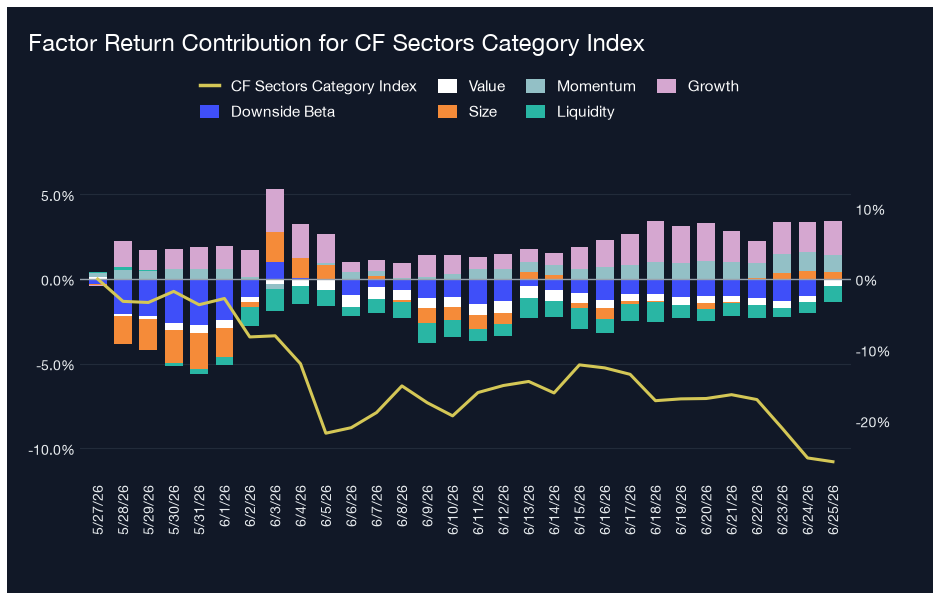
Factor contributions across the CF DACS Sectors universe sum to roughly +2.1% over the trailing 30 days, while the Sectors index fell -25.8% over the same window, a gap of about 28 percentage points. Growth was the dominant contributor at +2.0%, with Momentum adding +1.0%, while Liquidity was the largest drag at -0.9%. The wide divergence between aggregate factor contributions and the index return shows how much systematic factor tilts preserved value relative to passive Sectors exposure during a steep drawdown.
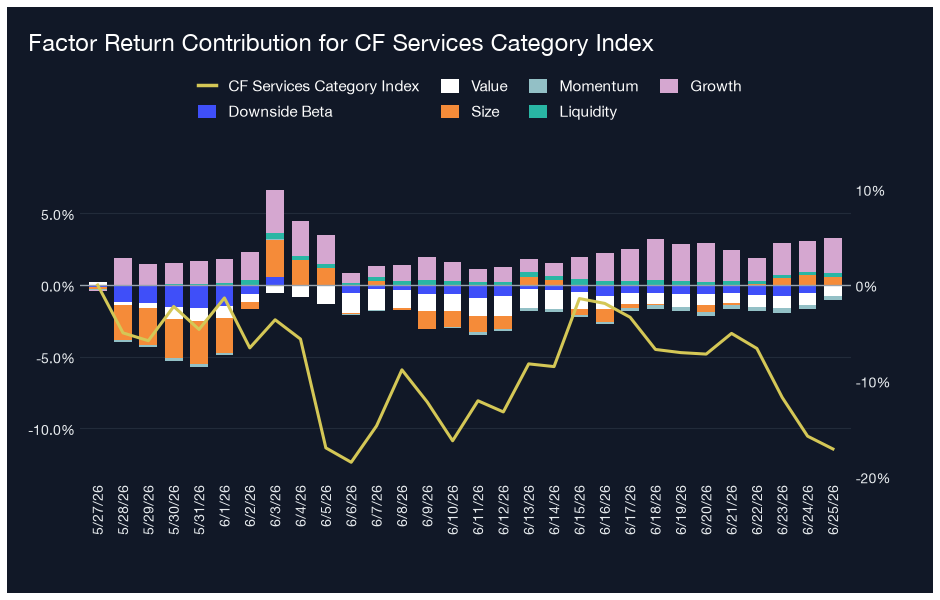
In the CF DACS Services universe, factor contributions total approximately +2.2% over 30 days against a Services index return of -17.1%, a gap of roughly 19 percentage points. Growth (+2.4%) and Size (+0.6%) were the primary contributors, with Value the main drag at -0.7%. Services held up somewhat better than Sectors at the index level, though factor-driven performance again materially exceeded passive index returns.
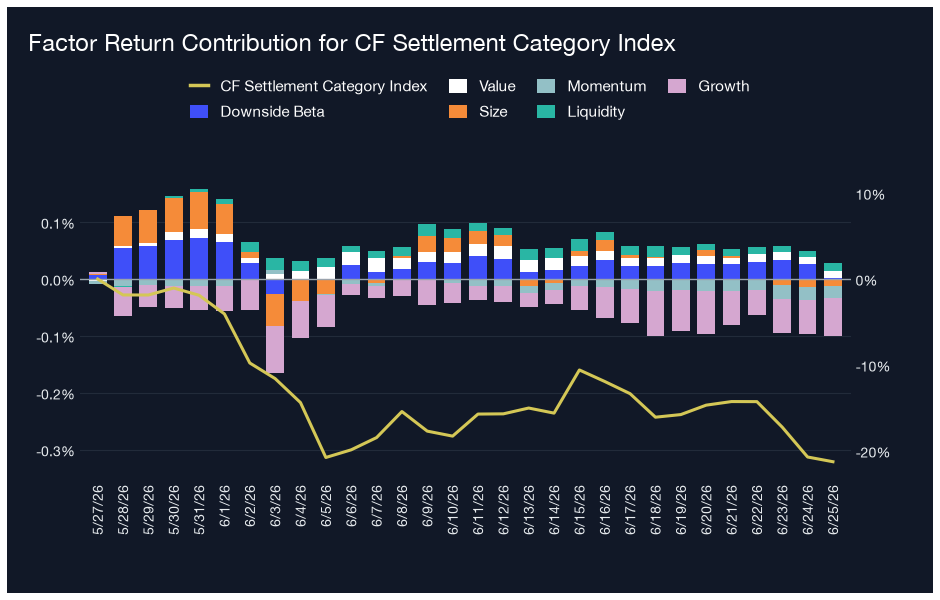
The Settlement universe, dominated by Bitcoin and core settlement-layer assets, tells a different story. Factor contributions net to roughly -0.1% over the trailing 30 days while the Settlement index declined -21.3%. The negligible factor contribution confirms that settlement-layer assets are driven primarily by broad market forces rather than cross-sectional style dispersion. The Settlement decline is a macro story, not a factor story, and that distinction matters for portfolio construction.
Appendix: CF Factor Methodology
Market Factor
The market factor captures the broad, systematic risk that permeates the digital asset ecosystem. It reflects aggregate influences such as macroeconomic conditions, investor sentiment, and overall market volatility. As such, this factor is defined by the daily returns of the CF Broad Cap (Free Float Market Cap Weight) Index, offering a comprehensive and capitalization-weighted representation of the asset class.
Size Factor
The size factor captures the return differential associated with asset scale, reflecting the hypothesis that smaller-cap digital assets tend to outperform their larger-cap counterparts. This effect is understood to compensate for elevated operational and financial risks while exploiting potential market inefficiencies. In this framework, the size factor is defined by each asset’s fully diluted market capitalization. The value is sign-inverted so that higher z-scores are assigned to smaller assets and vice-versa.
Value Factor
The value factor reflects a protocol’s ability to generate economic output relative to its capital base and market valuation, combining measures of both efficiency and user engagement. It is constructed as the average z-score of two key ratios: transaction fees relative to total value locked (Fees/TVL) and daily active users relative to market capitalization (DAU/MCap). This composite metric captures how productively a protocol utilizes its resources while also serving as a proxy for user-driven demand. A higher combined score indicates efficient resource utilization and strong user engagement.
Momentum Factor
The momentum factor captures short-term price persistence by identifying assets that have recently exhibited strong performance. It is computed as the average z-score of two metrics: the 2 weeks cumulative performance and the 2 weeks risk-adjusted cumulative performance. This approach aligns with established findings in traditional financial literature and demonstrates empirical relevance in digital assets, where price trends tend to exhibit momentum over short horizons.
Growth Factor
The growth factor captures the expansion of a protocol’s network activity and user adoption. In the context of digital assets, it reflects metrics such as fee generation and user engagement, which serve as indicators of increased platform utilization and operational scale. The factor is defined as the average z-score of 30-day fee growth and 30-day weekly active user growth, thereby identifying assets exhibiting consistent and measurable increases in underlying network usage.
Downside Beta
The downside beta factor captures an asset’s sensitivity to adverse market conditions by isolating its behavior during periods of negative market returns. Empirical evidence shows that assets with lower downside beta tend to outperform their higher-beta counterparts over the long-term, due to their reduced participation in market drawdowns and more stable return profiles during periods of elevated volatility. As such, it is estimated through a regression of the asset’s daily returns over the most recent four-week period against market returns observed exclusively during negative sessions. The resulting value is sign-inverted to ensure that assets with lower downside exposure are assigned higher z-scores.
Liquidity Factor
The liquidity factor captures the ease with which a digital asset can be traded without significantly impacting its price. Empirical evidence shows that illiquid assets tend to command a higher risk premium than their more liquid counterparts, serving as compensation for trading friction and price volatility. To quantify this, the factor is measured using token turnover, defined as trading volume as a percentage of circulating supply. The value is sign-inverted such that higher z-scores are assigned to less liquid assets.
For further detail, view the CF Factors Methodology Document, the CF Factor Data Suite, and Our paper “A Factor Model for Digital Assets” in Springer Nature’s Mathematical Research for Blockchain Economy
The information contained within is for educational and informational purposes ONLY. It is not intended nor should it be considered an invitation or inducement to buy or sell any of the underlying instruments cited including but not limited to cryptoassets, financial instruments or any instruments that reference any index provided by CF Benchmarks Ltd. This communication is not intended to persuade or incite you to buy or sell security or securities noted within. Any commentary provided is the opinion of the author and should not be considered a personalised recommendation. Please contact your financial adviser or professional before making an investment decision.
Note: Some of the underlying instruments cited within this material may be restricted to certain customer categories in certain jurisdictions.
Softer CPI Reprices July Hike Risk & Lifts Digital Assets
Digital assets extended their recovery over the past week as cooler US inflation prints repriced Fed expectations; the bid was broad across the large cap indices, growth factor leadership returned, stablecoin funding repriced lower, and stress stayed isolated in names hit by token-specific news.

Mark Pilipczuk
Notice of the Demising of CF Dai-Dollar Settlement Price and Spot Rate
The Administrator announces that it will demise the CF Dai-Dollar Settlement Price (DAIUSD_RR) and CF Dai-Dollar Spot Rate (DAIUSD_RTI) which are members of the CF Digital Asset Index Family.
CF Benchmarks
Addition of the Tether Gold Settlement Price and Spot Rate to the CF Digital Asset Index Family
The Administrator announces the addition of the Tether Gold Settlement Price and Spot Rate to the CF Digital Asset Index Family - Single Asset Series.
CF Benchmarks
By clicking Accept, you consent to CF Benchmarks's use of cookies.
Visit Cookie Settings to learn how CF Benchmarks uses cookies and to adjust your preferences.