
Aug 06, 2026
Bitcoin Drives a Rebound as Breadth Narrows
Monthly Attribution - July 2026
The CF Free-Float Broad Cap Index rose 4.44% in July, recovering part of the June drawdown on a gain that came almost entirely from its large-capitalization core. Settlement assets contributed 4.35 percentage points, with Bitcoin and Ether together supplying 5.07 points against the index return and the rest of the basket giving part of it back. Eighteen of thirty-two constituents finished lower and the index still rose.
Market Recap
July's macro backdrop was stronger than last month. June CPI, released on July 14, fell 0.4% on the month and slowed to 3.5% year over year against consensus of 3.8%, its largest monthly decline since April 2020, with energy prices down 5.7% as the mid-June Iran framework held. Core CPI was flat at 2.6% and June PCE eased to 3.7% headline. The Federal Open Market Committee treated the disinflation as energy led, holding the policy rate at 3.50% to 3.75% on July 29 for a fifth consecutive meeting on a 9 to 3 vote, with three members dissenting in favor of a 25 basis point increase, the first hike dissents since 2016.
Flows recovered without conviction. Digital asset funds took in roughly $409 million after $4.5 billion of outflows in June, ending a record eight-week outflow streak, with Ether funds accounting for $297 million of that. US spot Bitcoin ETFs netted just $205 million over the month, the smallest monthly inflow on record. The long end repriced late, as the 30-year Treasury yield passed its 2023 high to 5.23%, the highest since 2007, and geopolitics deteriorated even as prices cooled, with the United States striking Iran on July 8 and the Strait of Hormuz still closed at month end.
Bitcoin's advance was its first since April and arrived in the first half of the month, when the softer print landed and the risk premium in energy markets eased. It stalled near $68,000 around the 21st, and the final session erased part of the gain. Ether had catalysts Bitcoin did not. Morgan Stanley Investment Management listed Ethereum and Solana exchange-traded products on NYSE Arca late in the month at a 0.14% expense ratio, passing staking rewards through in full, and corporate treasury accumulation continued, with Bitmine adding $74 million of ETH. Ether returned 15.36% against Bitcoin's 4.68%, though it reached the index through roughly a seventh of Bitcoin's weight. Bitcoin dominance held near 58% and the Altcoin Season Index reached 53 of 100 on the 28th, consistent with a selective rotation rather than a broad altcoin rally.
Weight, Not Breadth, Delivered the Gain
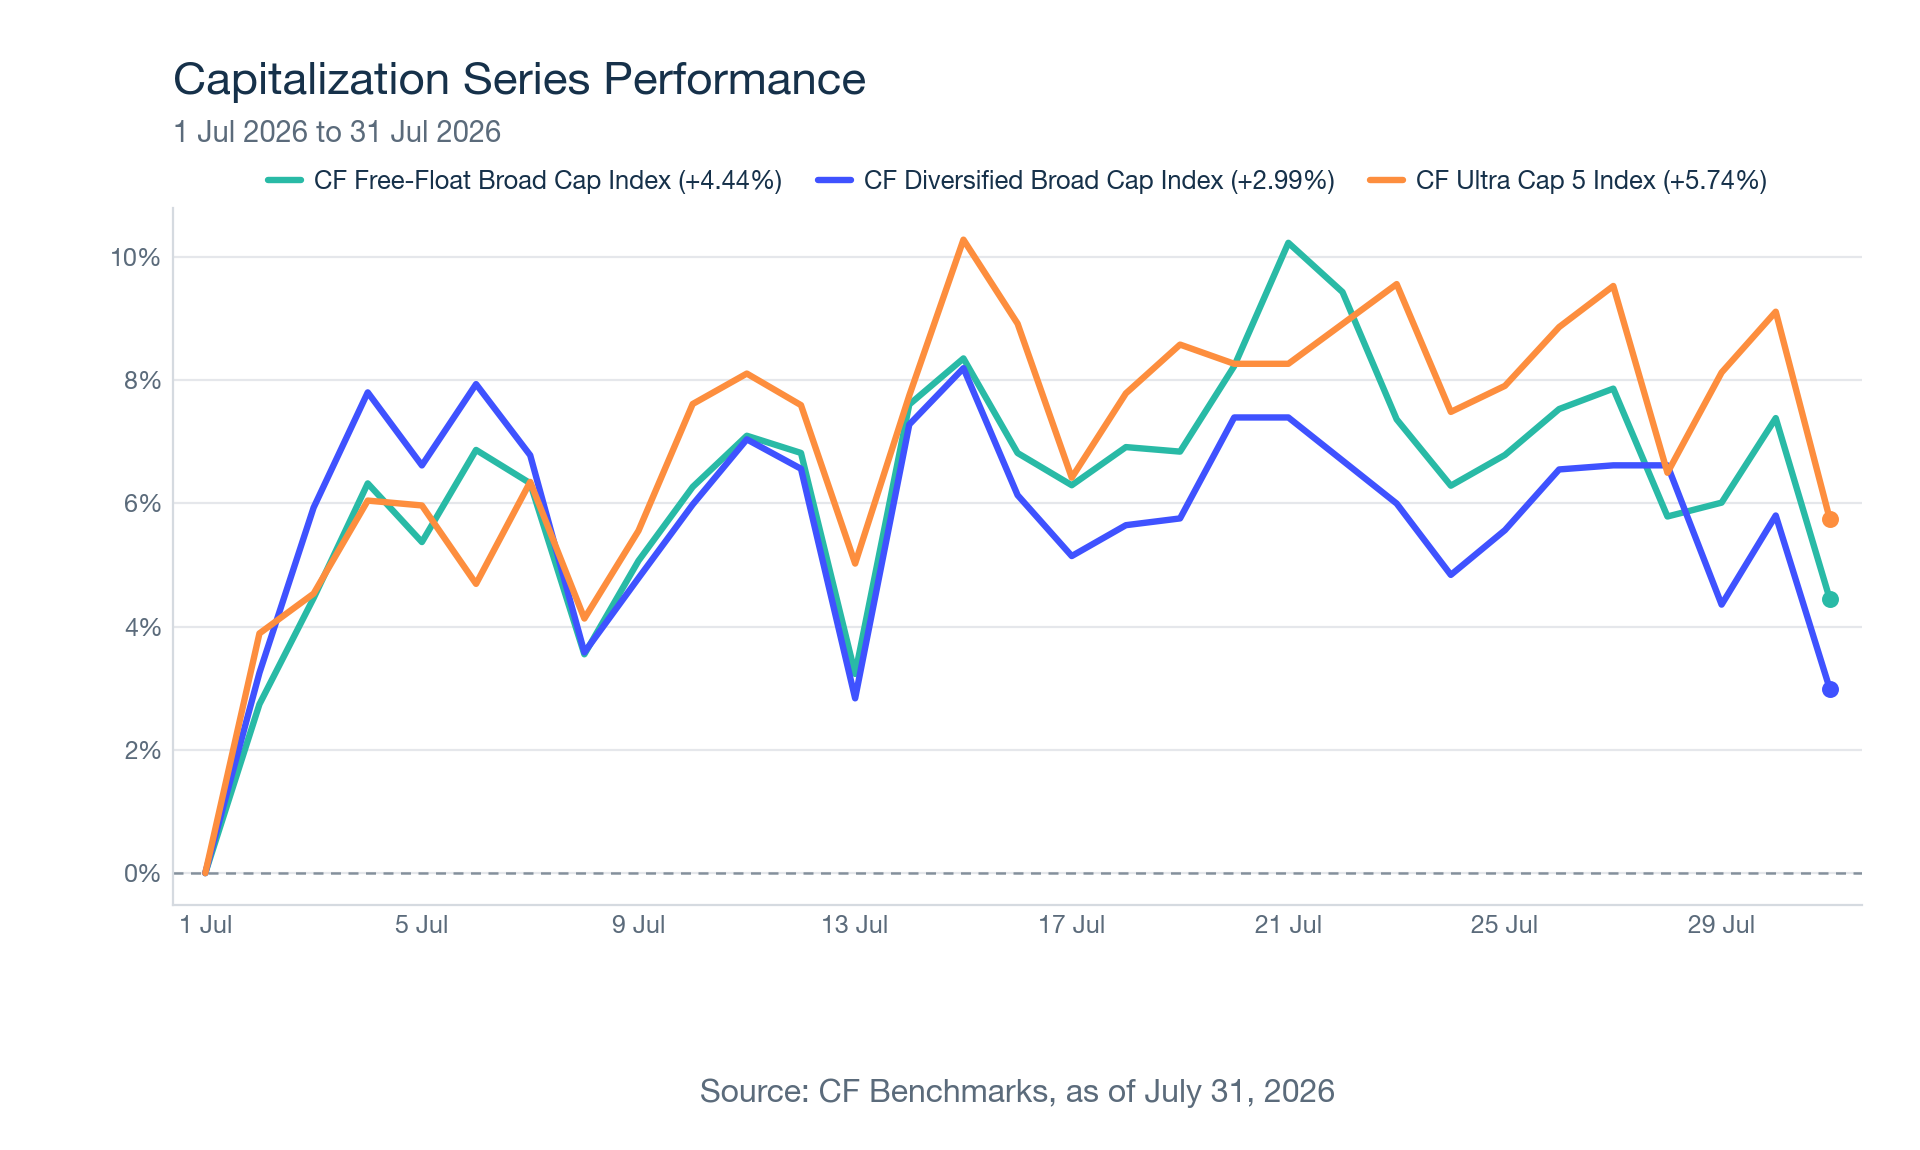
The CF Free-Float Broad Cap Index returned 4.44% over the month, with Settlement assets contributing 4.35 percentage points and the Sectors and Services categories effectively flat at +0.08% and +0.01% respectively. Bitcoin contributed +3.47% and Ether a further +1.59%, so the two majors supplied 5.07 points against a 4.44% index return and the remainder of the basket surrendered the difference. One level down, the gain sat in Non-Programmable assets at +3.43% and Programmable at +0.93%, with Finance adding +0.08% and Infrastructure the only negative sub-category at -0.02%. Dispersion across the index suite was wider than in June and cleanly ordered by Bitcoin weight, as the mega-cap CF Ultra Cap 5 Index led at +5.74%, the CF Free-Float Broad Cap Index returned +4.44%, and the more diversified CF Diversified Broad Cap Index trailed at +2.99% because its capped Bitcoin position left it holding more of the month's laggards.
Broad Cap: Where the Return Came From
The CF Free-Float Broad Cap Index remains the clearest read on the institutional digital asset opportunity set, and July's attribution shows how little the tail mattered when the majors led higher. Settlement represented 97.93% of starting weight and Bitcoin accounted for 74.17%.
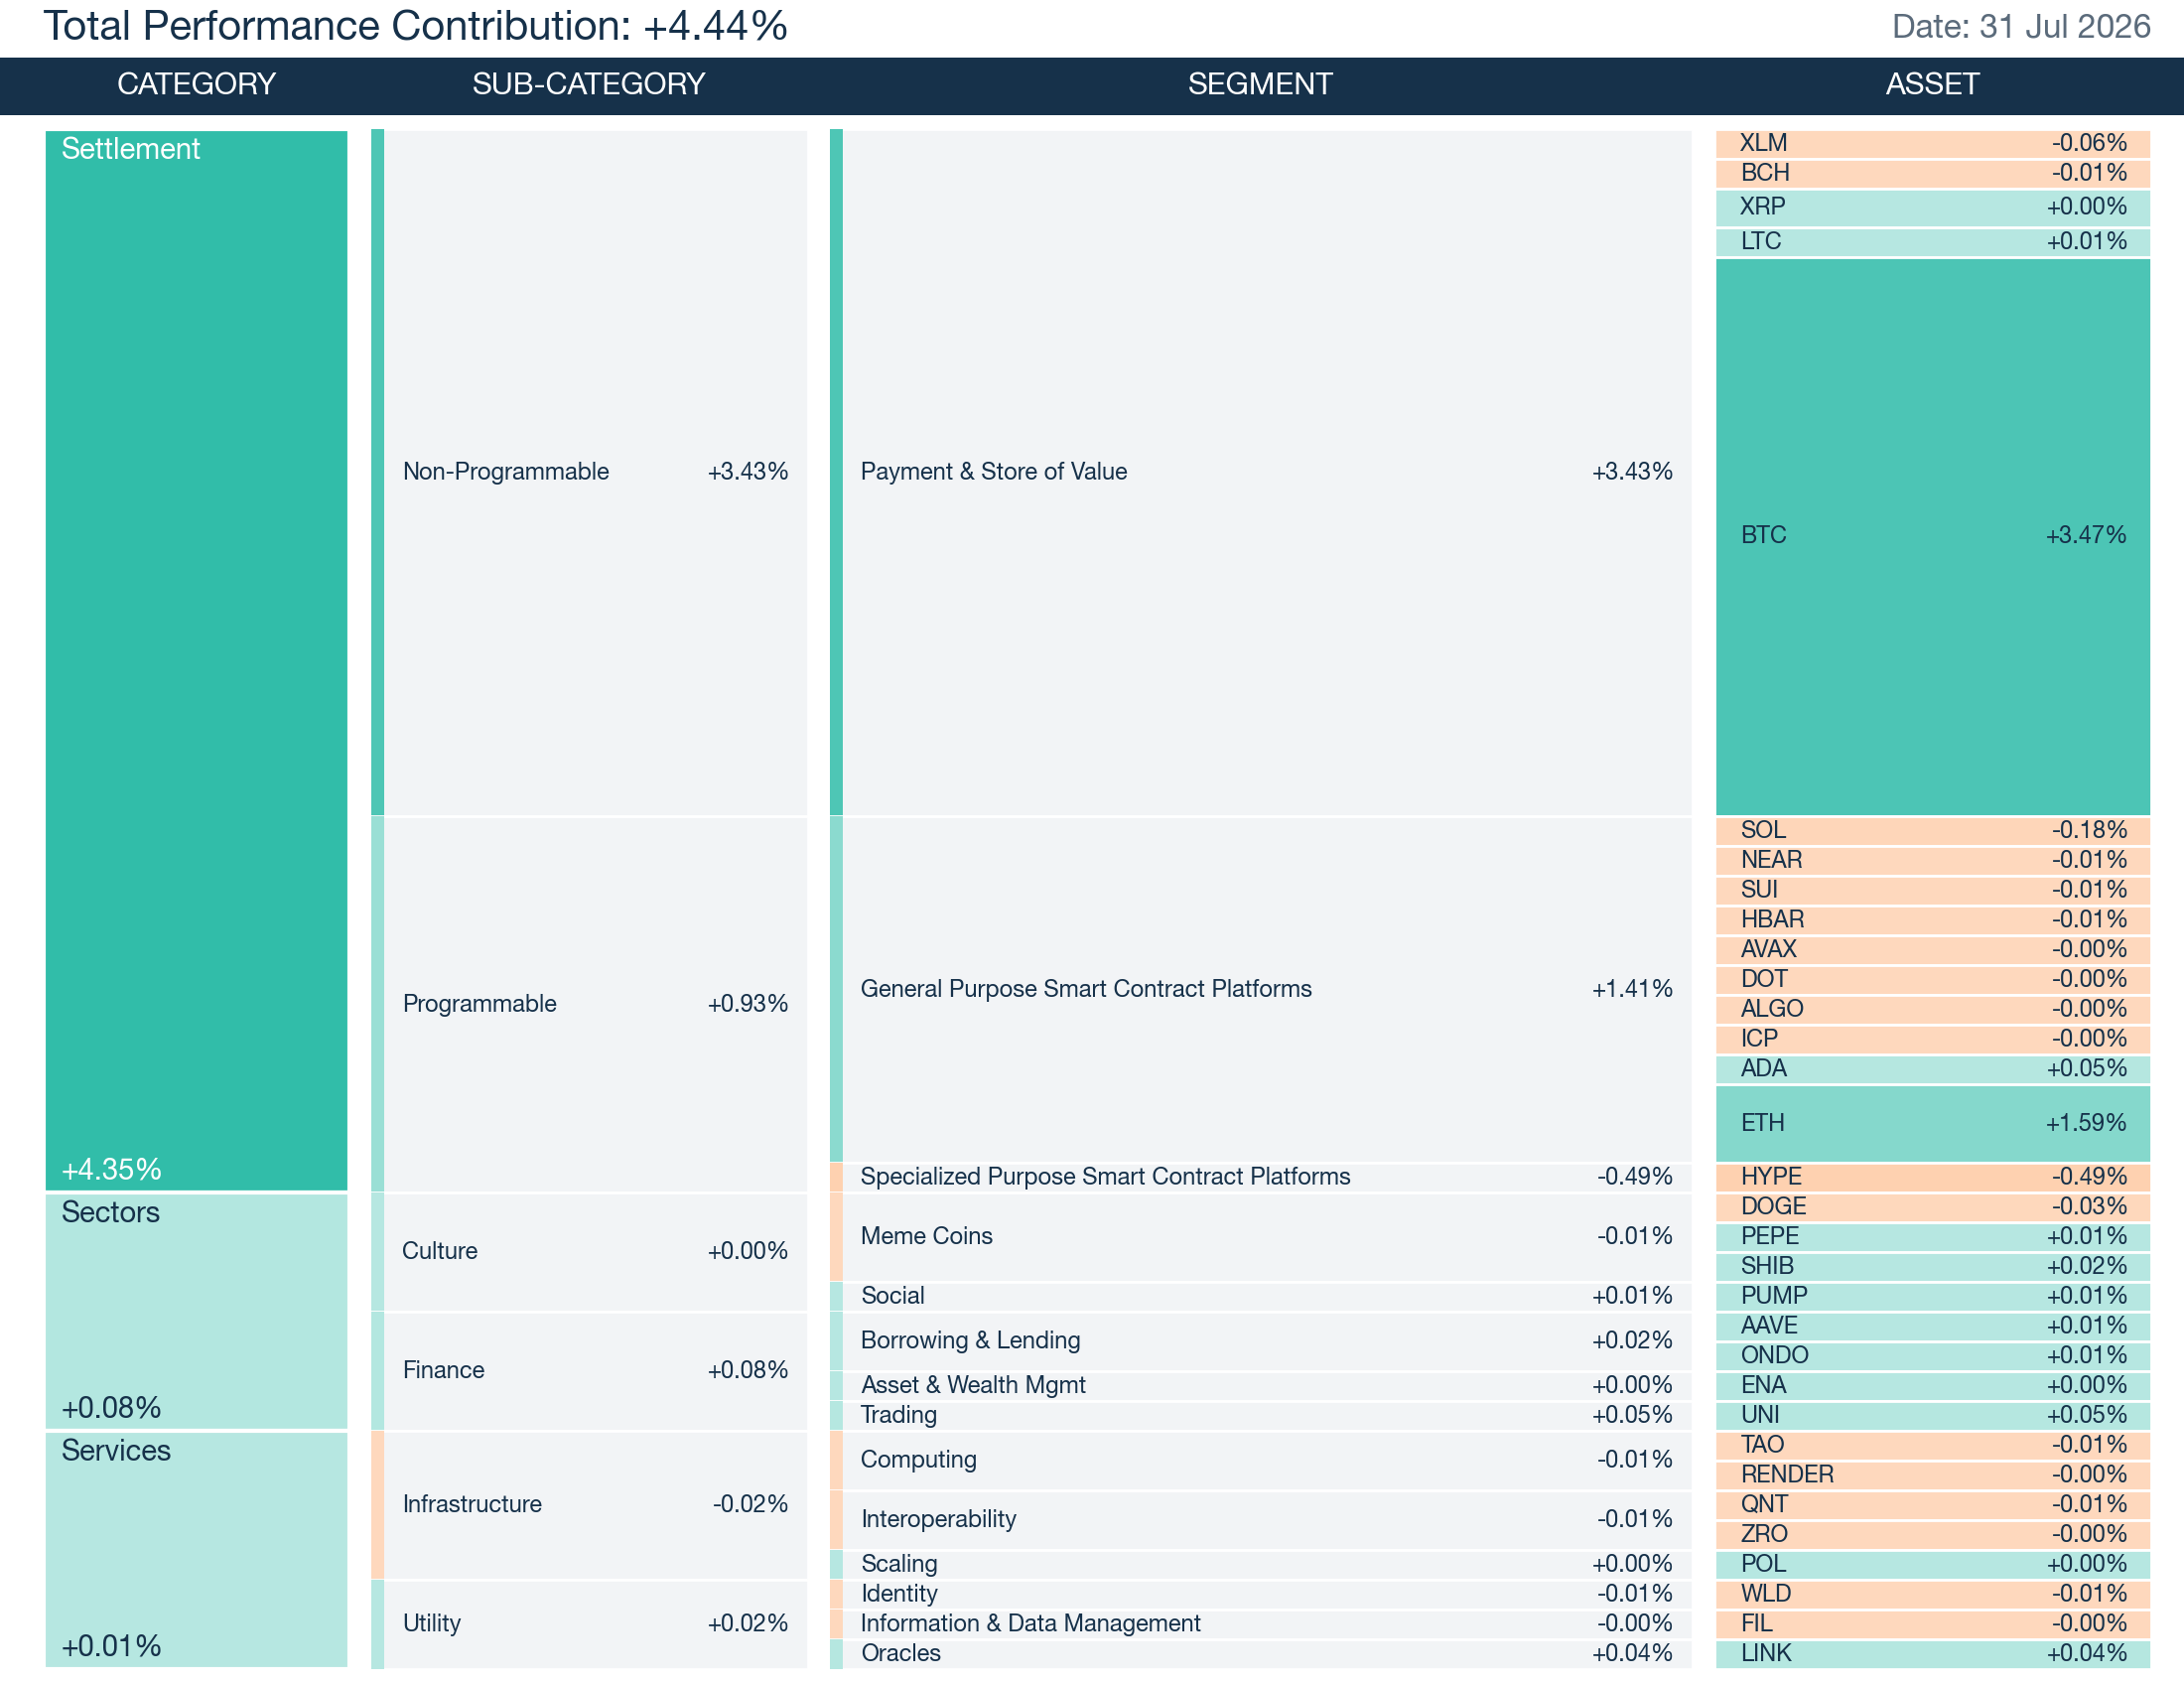
The performance contribution breakdown reinforces the point. By segment, Payment & Store of Value drove +3.43% of the return and General Purpose Smart Contract Platforms a further +1.41%, with Trading adding +0.05% and the remaining tail contributing only marginally. Specialized Purpose Smart Contract Platforms took -0.49% off the total, and no other segment cost the index more than a basis point and a half.
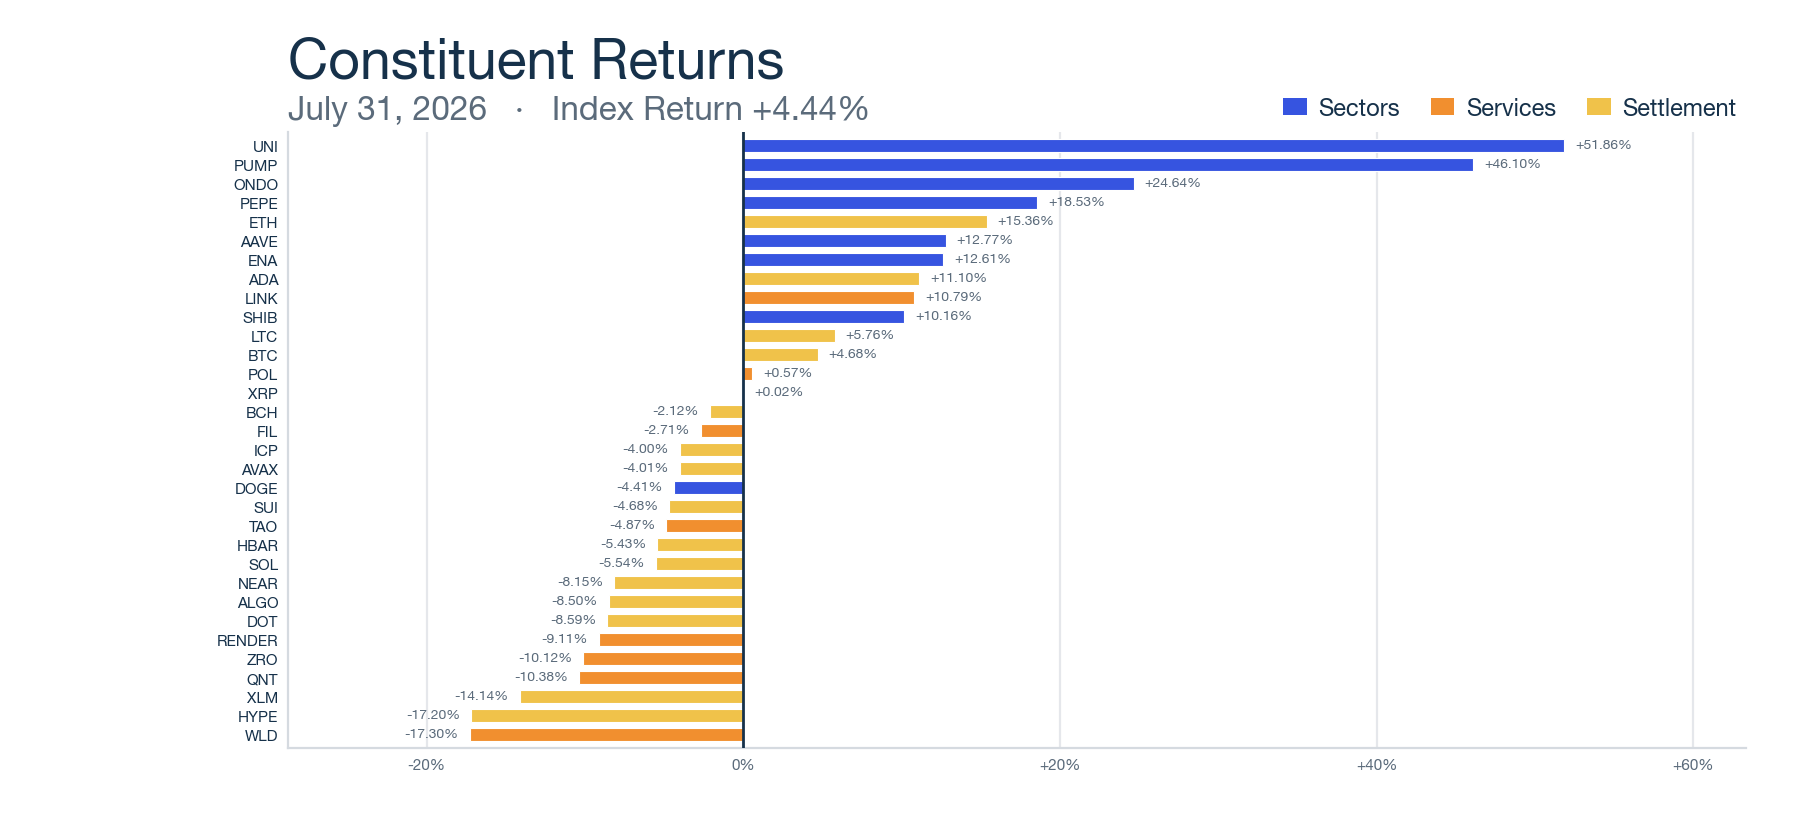
Constituent-level dispersion was wide and largely immaterial to the headline. Uniswap led the index at +51.86%, coinciding with governance reviving the long-dormant fee switch and directing revenue to token burns, though a 1.03% starting weight held its contribution to +0.05%. Hyperliquid was the largest single detractor, returning -17.20% and costing the index 0.49% as buyback spending fell 61% over the month, extending a slide that began after Singapore's Monetary Authority added the exchange to its Investor Alert List in late June. Eighteen of thirty-two constituents finished lower, and the index still returned +4.44%.
Across the Capitalization Series
The mega-cap CF Ultra Cap 5 Index returned +5.74%, the strongest reading in the suite. Bitcoin and Ether held 90.47% of the basket between them, leaving the other three constituents too little weight to offset anything: Non-Programmable assets drove +4.07% of the return and General Purpose Smart Contract Platforms +1.67%, while Solana at -4.45% was the only decline among the five and cost 0.16%. Ether posted the larger return at +16.18%, but Bitcoin's 79.40% weight decided the total.
The CF Diversified Broad Cap Index rose 2.99%, the narrowest gain of the three capitalization benchmarks. Capping Bitcoin at 39.65% let Ether lead, contributing +2.88% from an 18.72% holding against Bitcoin's +1.86% from more than twice the weight, but the same structure gave the index more of the month's laggards. Hyperliquid at 7.91% of the basket cost 1.36% and Solana a further 0.51%, and together they account for roughly five sixths of the 1.46 point gap to the free-float benchmark. As in June, the lighter Bitcoin position left the diversified structure at the back of the capitalization series, this time because it held more of the smart contract platforms that lagged rather than less of the asset that cushioned the fall.
Across the Classification Series
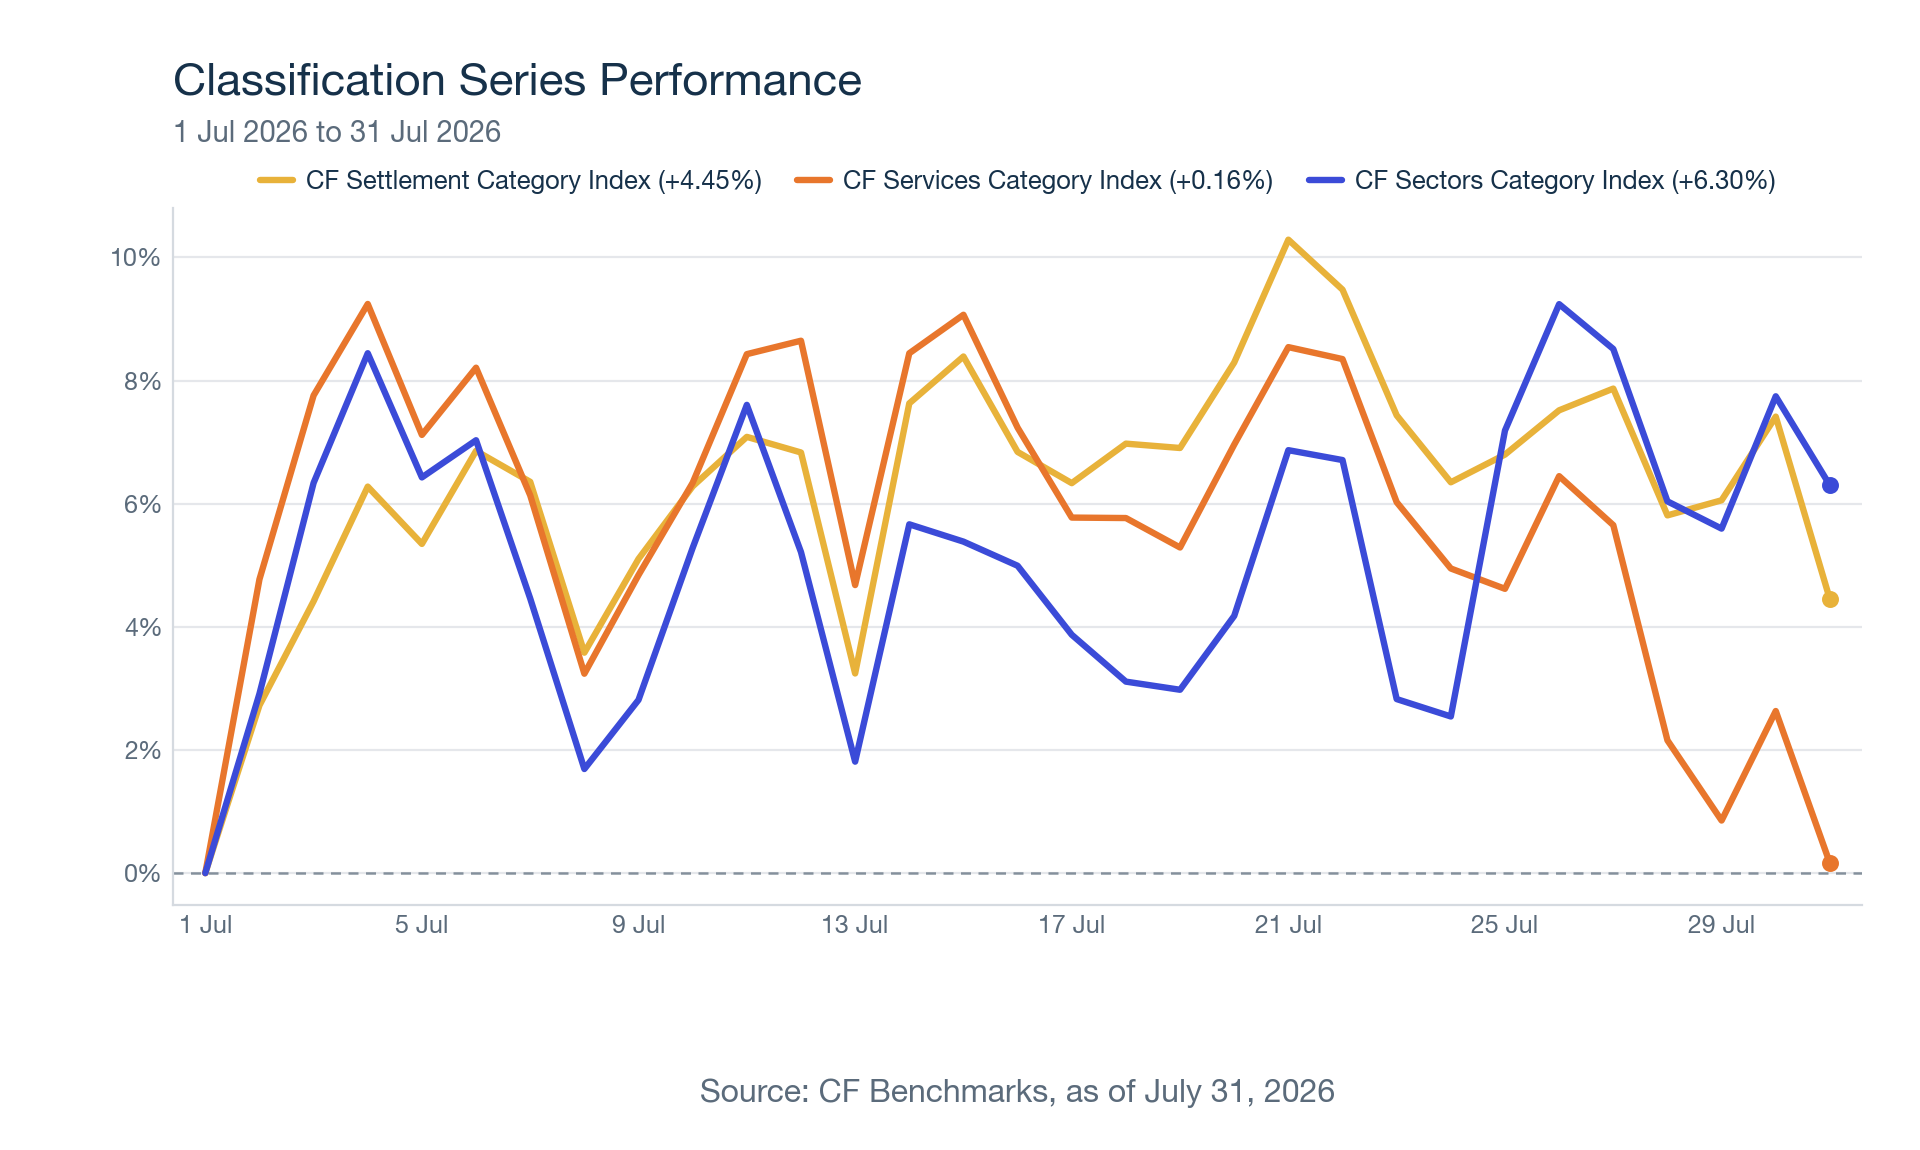
June's laggard among the three CF DACS category indices became July's leader. The CF Sectors Category Index led at +6.30%, as its 21.12% Finance sub-category produced every point of the gain while the 78.88% Culture sub-category netted close to zero, Dogecoin's -4.41% return offsetting Shiba Inu's +1.17% contribution through a 61.30% weight. Uniswap and Shiba Inu between them supplied 84% of the index move. The CF Settlement Category Index returned +4.45%, tracking Bitcoin's 75.75% weight almost mechanically, though nearly all of that was made before the July 29 meeting and only 5 of 16 constituents rose. The CF Services Category Index was the laggard at +0.16%, where Chainlink's +10.79% return contributed +4.73%, coinciding with roughly $7 billion of assets moving to its cross-chain protocol, and the other seven holdings gave back almost exactly as much, led by Worldcoin at -2.18%.
To read the full reports, please click on the respective links below:
CF Free-Float Broad Cap Index: Monthly Attribution [PDF]
CF Diversified Broad Cap Index: Monthly Attribution [PDF]
CF Ultra Cap 5 Index: Monthly Attribution [PDF]
CF Settlement Category Index: Monthly Attribution [PDF]
CF Services Category Index: Monthly Attribution [PDF]
CF Sectors Category Index: Monthly Attribution [PDF]
Our Monthly Attribution Reports are designed to help investors understand the performance of digital assets through a purpose-centric lens called the CF Digital Asset Classification Structure (CF DACS). To learn more about CF DACS, please use our interactive CF DACS Token Explorer.
The information contained within is for educational and informational purposes ONLY. It is not intended nor should it be considered an invitation or inducement to buy or sell any of the underlying instruments cited including but not limited to cryptoassets, financial instruments or any instruments that reference any index provided by CF Benchmarks Ltd. This communication is not intended to persuade or incite you to buy or sell security or securities noted within. Any commentary provided is the opinion of the author and should not be considered a personalised recommendation. Please contact your financial adviser or professional before making an investment decision.
Note: Some of the underlying instruments cited within this material may be restricted to certain customer categories in certain jurisdictions.
Factor Friday - October 9, 2026
Size led CF Benchmarks' factor table for a second week at 2.58% as the Market fell 4.98%. Size held after QNT's reversal, though its cohort spread narrows sharply without three outlier tokens, and Downside Beta and Liquidity gave back part of last week's gains.

Mark Pilipczuk
Small Cap Tokens Outperform in September
The CF Free-Float Broad Cap Index rose 10.28% in September as Bitcoin supplied 59% of the gain while trailing the index. Returns across the Capitalization Series ran from +7.74% for Ultra Cap 5 to +14.01% for Emerging Crypto, which holds no Bitcoin, as altcoins outpaced Bitcoin.
Mark Pilipczuk
CF Digital Asset Index Family Multi Asset Series – Extraordinary Rebalance Announcement
CF Digital Asset Index Family Multi Asset Series - Extraordinary Rebalance Announcement
CF Benchmarks
By clicking Accept, you consent to CF Benchmarks's use of cookies.
Visit Cookie Settings to learn how CF Benchmarks uses cookies and to adjust your preferences.