
Aug 04, 2026
Cooler Inflation Sparks Rebound as Hike Risk Persists
Key takeaways for the month
Macro, geopolitical, and policy crosscurrents in July ran the other way from June, and digital assets recovered part of the spring drawdown. June CPI, released July 14, fell 0.4% month over month and slowed to 3.5% year over year against consensus of 3.8%, the largest monthly decline in more than six years, with energy prices down 5.7% as the mid-June Iran framework held. Core CPI was flat on the month at 2.6%, and June PCE, released July 30, eased to 3.7% headline and 3.3% core. The disinflation was energy led, and the Federal Reserve treated it as such. At Chair Kevin Warsh's second meeting on July 29, the FOMC held the policy rate at 3.50% to 3.75%, but the vote split 9 to 3, with Beth Hammack, Neel Kashkari and Lorie Logan dissenting in favor of a 25 basis point hike, and the statement carried no forward guidance. Geopolitics deteriorated even as prices cooled. The United States struck Iran on July 8 and revoked its oil sanctions waiver, both sides exchanged fire over the Strait of Hormuz from July 13, and a naval blockade followed, leaving Brent at 87.93 dollars after a 77 to 97 dollar range and the waterway still closed at month end. Digital asset funds swung to roughly $409 million of net inflows after $4.5 billion of outflows in June, ending a record eight-week outflow streak. Crypto also parted company with US technology equities, as the CF Free-Float Broad Cap Index rose 7.2% while the Nasdaq Composite fell 3.2% on a semiconductor drawdown.
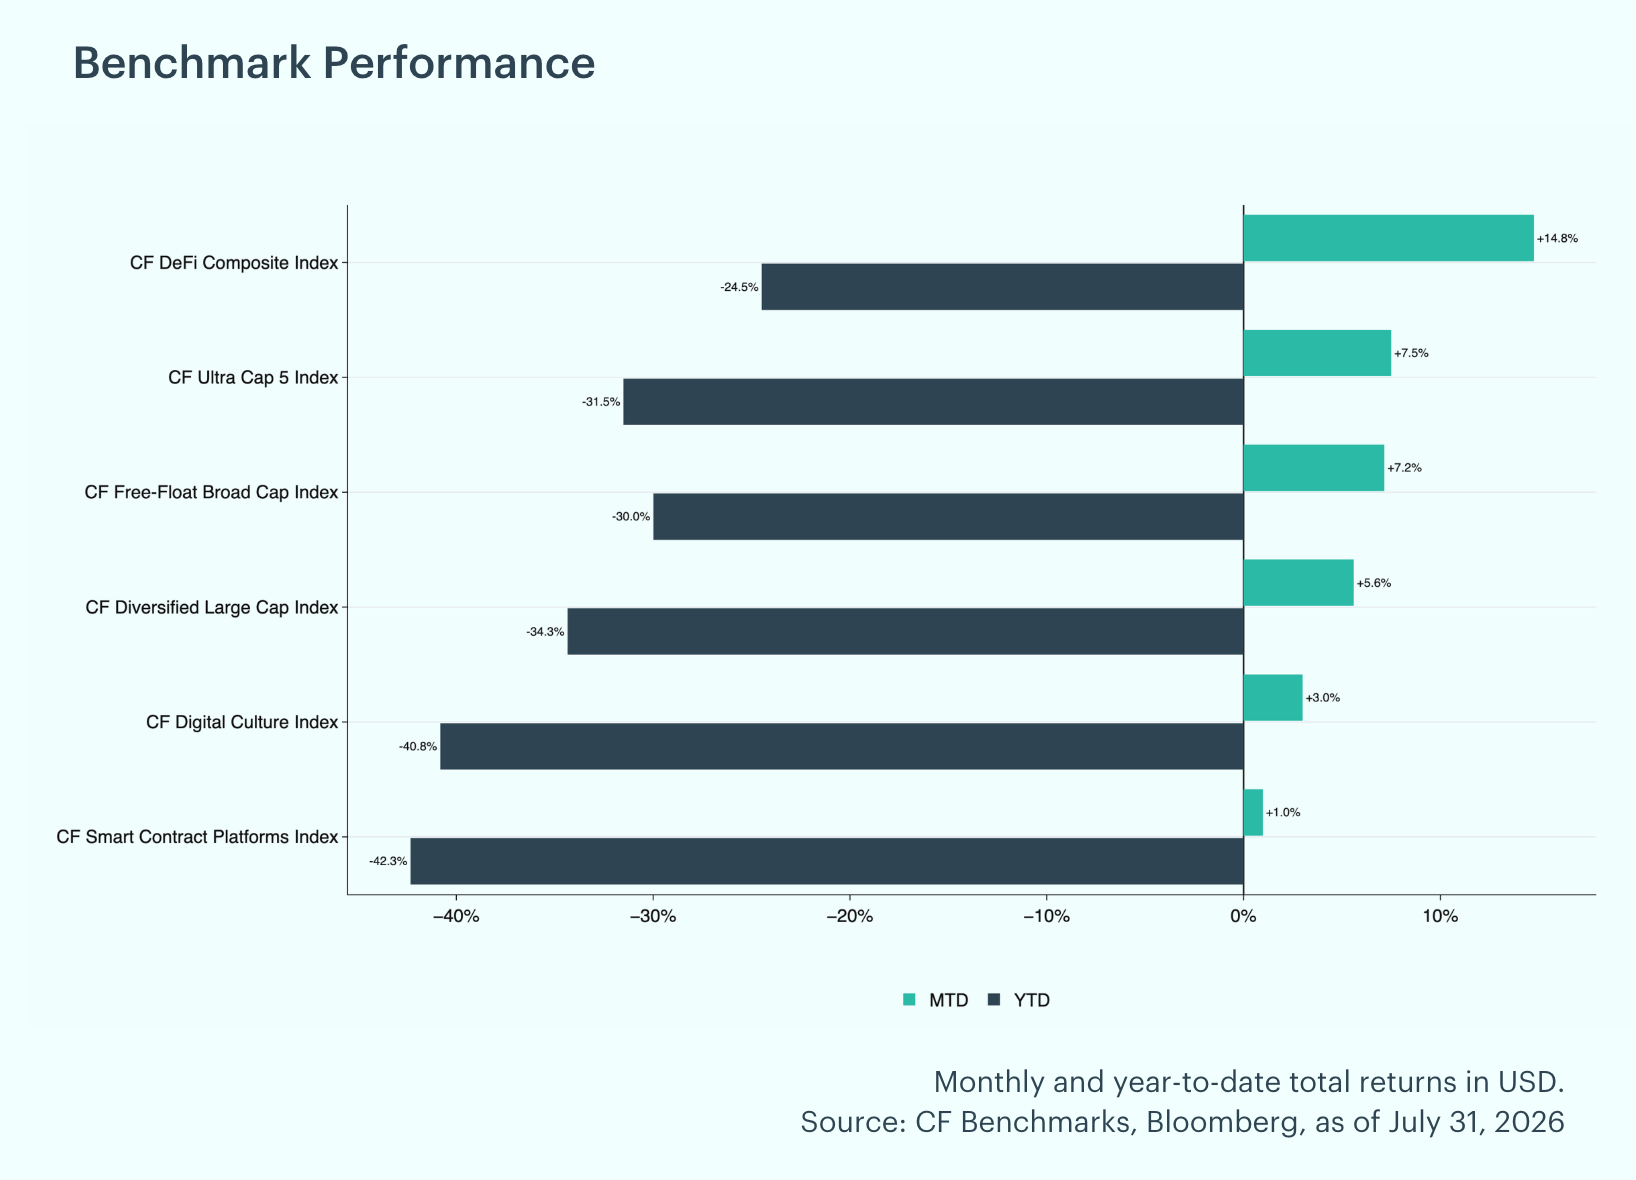
Broad Rebound Across the Market: July reversed part of the two-month decline, with every CF Benchmarks index posting a monthly gain. The CF DeFi Composite Index led, up 14.8% month-to-date, followed by the CF Cryptocurrency Ultra Cap 5 Index at 7.5% and the CF Free-Float Broad Cap Index at 7.2%. The CF Diversified Large Cap Index rose 5.6% and the CF Digital Culture Index 3.0%, while the CF Web 3.0 Smart Contract Platforms Index lagged at 1.0%. On a year-to-date basis, drawdowns narrowed to a 24% to 42% range, with the CF DeFi Composite Index down the least at roughly 25% and the CF Web 3.0 Smart Contract Platforms Index the most at 42.3%. The ordering inverted June's, as the index that fell least in the drawdown led the recovery.
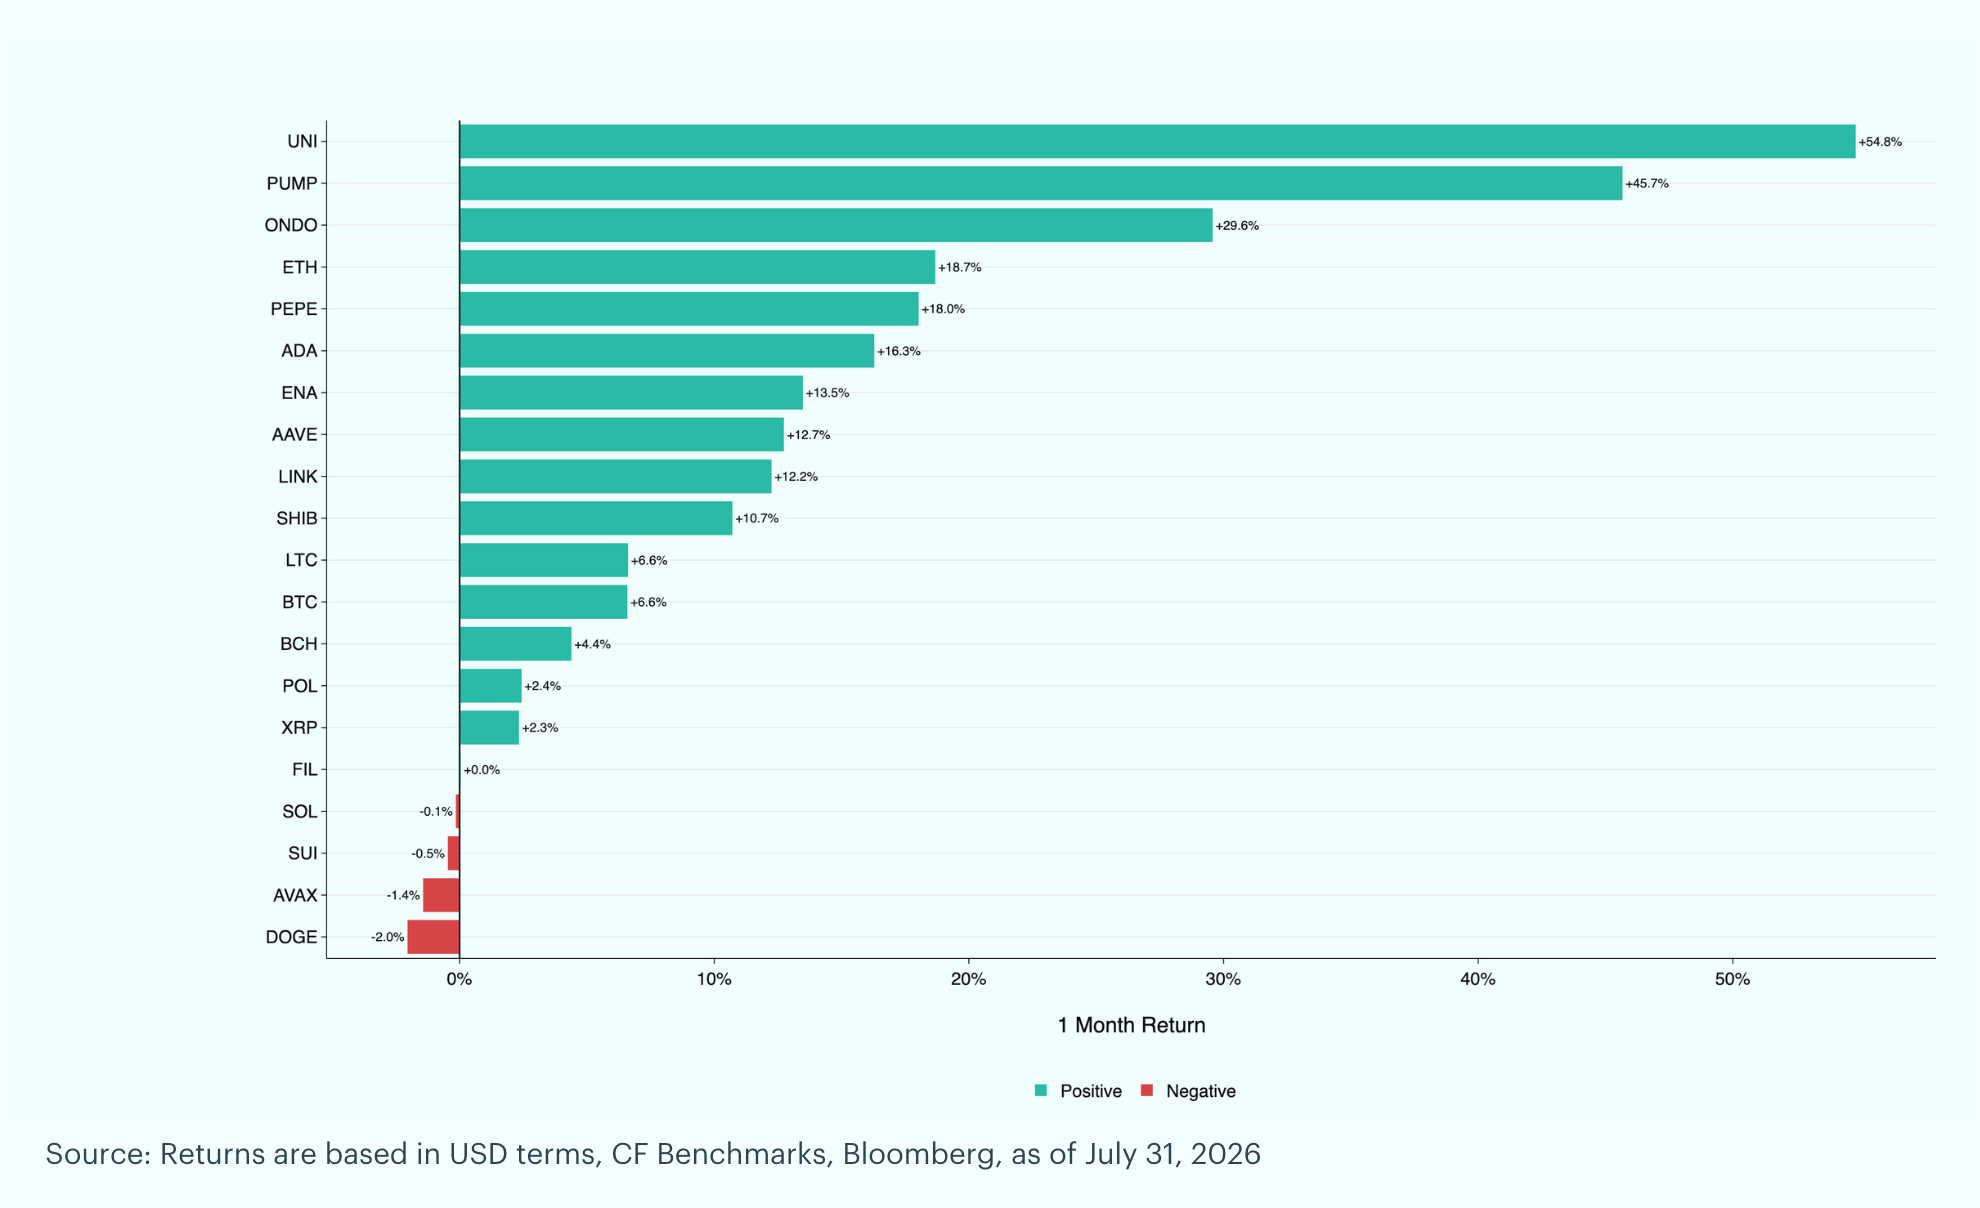
Individual Movers: Uniswap (UNI) led the major crypto-pairs in July with a 54.8% month-over-month gain, the largest in the group, after Robinhood Chain went live on July 1 and governance proposals 99 and 100 passed with roughly 97% support, extending protocol fees to version 4 and routing collected fees into UNI buybacks and burns. Pump.fun (PUMP) followed at 45.7%, absorbing its largest ever token unlock on July 12 as cumulative buybacks reached $414 million and reduced supply by 15.4%. Ondo Finance (ONDO) gained 29.6%, aided by a July 16 partnership with SBI Group to tokenize Japanese assets, and Ethereum (ETH) rose 18.7% against Bitcoin's (BTC) 6.6%. On the downside, Worldcoin (WLD) was the weakest major at -25.9% after leading the group in June, giving back its treasury-driven rally even as daily emissions fell 43% on July 24. Hyperliquid (HYPE) fell 16.2% as perpetuals volume halved to $43 billion and weekly revenue fell from $23 million to $7.5 million, shrinking the buyback bid that had supported the token. LayerZero (ZRO) declined 12.8% following a 25.7 million token cliff unlock on July 20. The leaders and the laggards shared a mechanism, as fee-funded buybacks and scheduled unlocks set the direction at both ends of the table.
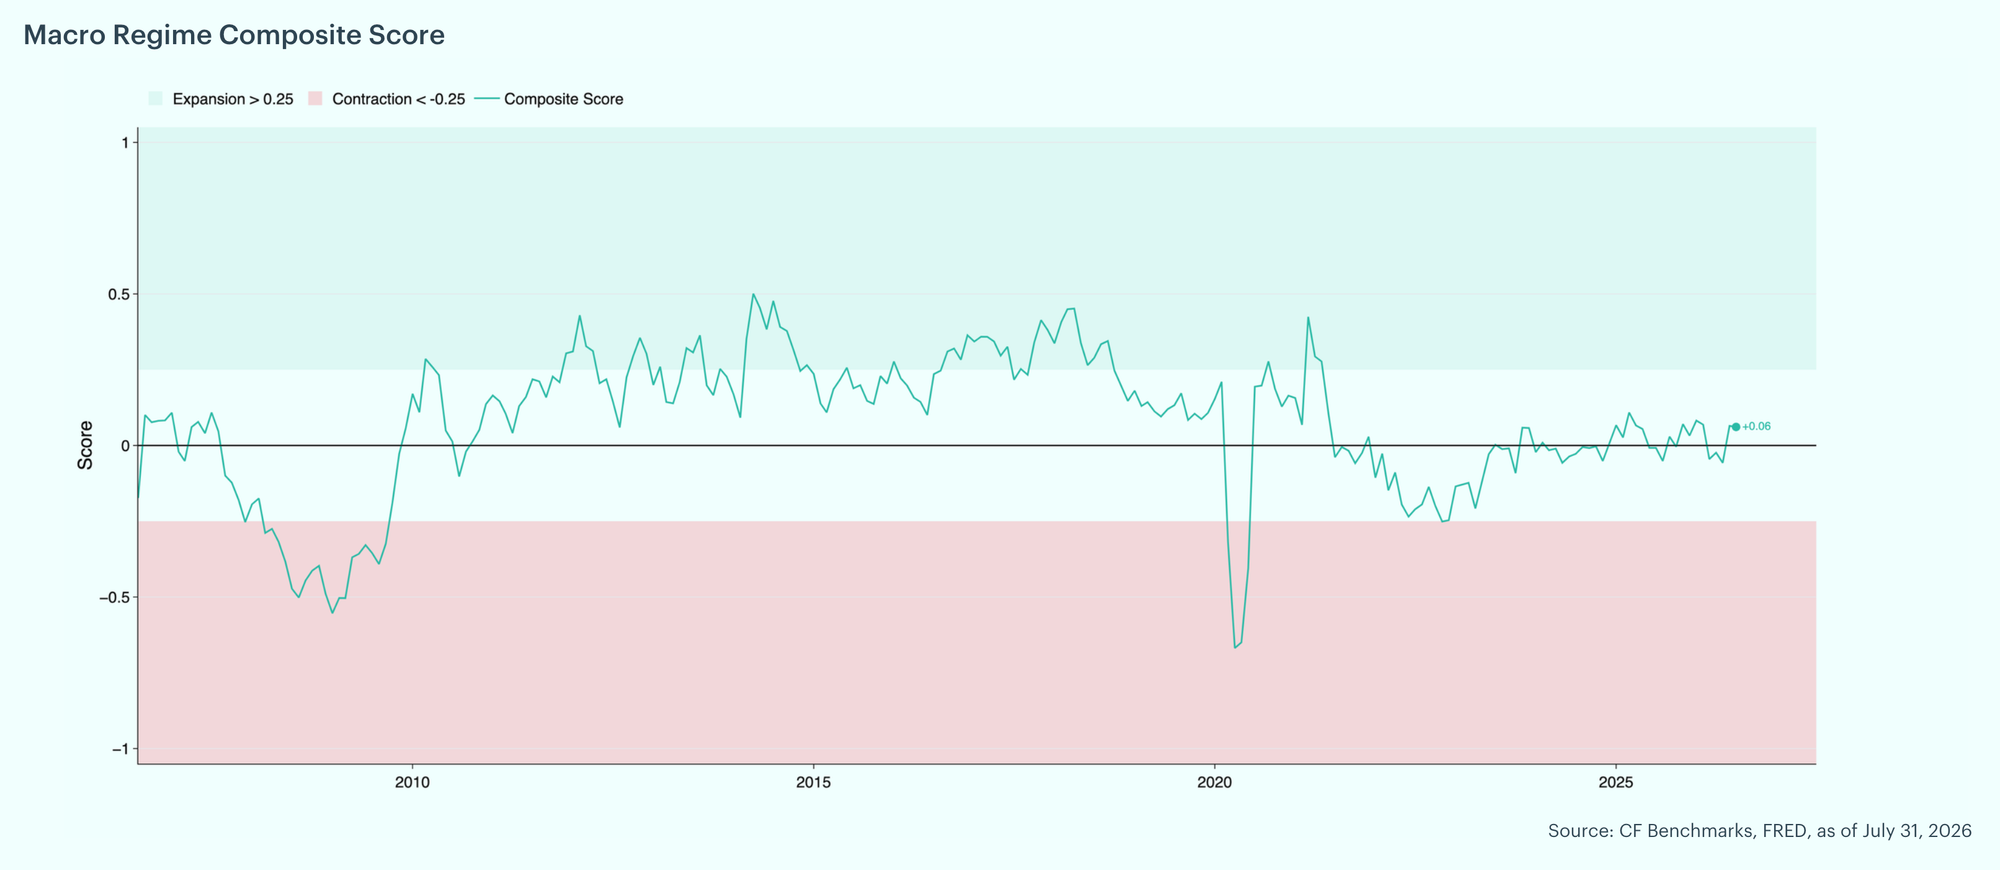
Late-Cycle Macro Holds in Neutral: The CF Benchmarks Macro Regime Composite Score sat just above zero, near +0.06, within the neutral zone (expansion above +0.25, contraction below -0.25) and essentially unchanged on the month. The cycle still reads flat and late stage, though the distribution of signals shifted toward improvement, at 17 indicators improving, 15 stable and 6 deteriorating, against 11, 17 and 10 in June. Broad near-term disinflation did most of the work, as headline CPI inflation eased to 3.5% year over year from 4.2%, core CPI to 2.6% from 2.8%, and both price surveys fell, with the ISM Manufacturing Prices Paid index down to 73.0 from 82.1 and the ISM Services Prices Paid index to 67.7 from 71.3. The Treasury curve steepened, with the 10-year to 2-year spread widening to +0.47% from +0.30%, though the composition matters. With the policy rate unchanged, the move came from the long end, and it reflects firmer expected growth and higher long-run inflation compensation rather than easier policy. The same repricing lifted University of Michigan 5 to 10 year inflation expectations to 3.6% from 3.3%, the highest reading since June 2025. Labor conditions held rather than turned, with average weekly manufacturing hours unchanged at 41.6 and the unemployment rate easing to 4.2%, while building permits fell to 1.37 million from 1.41 million, pointing to a thinner forward construction pipeline.
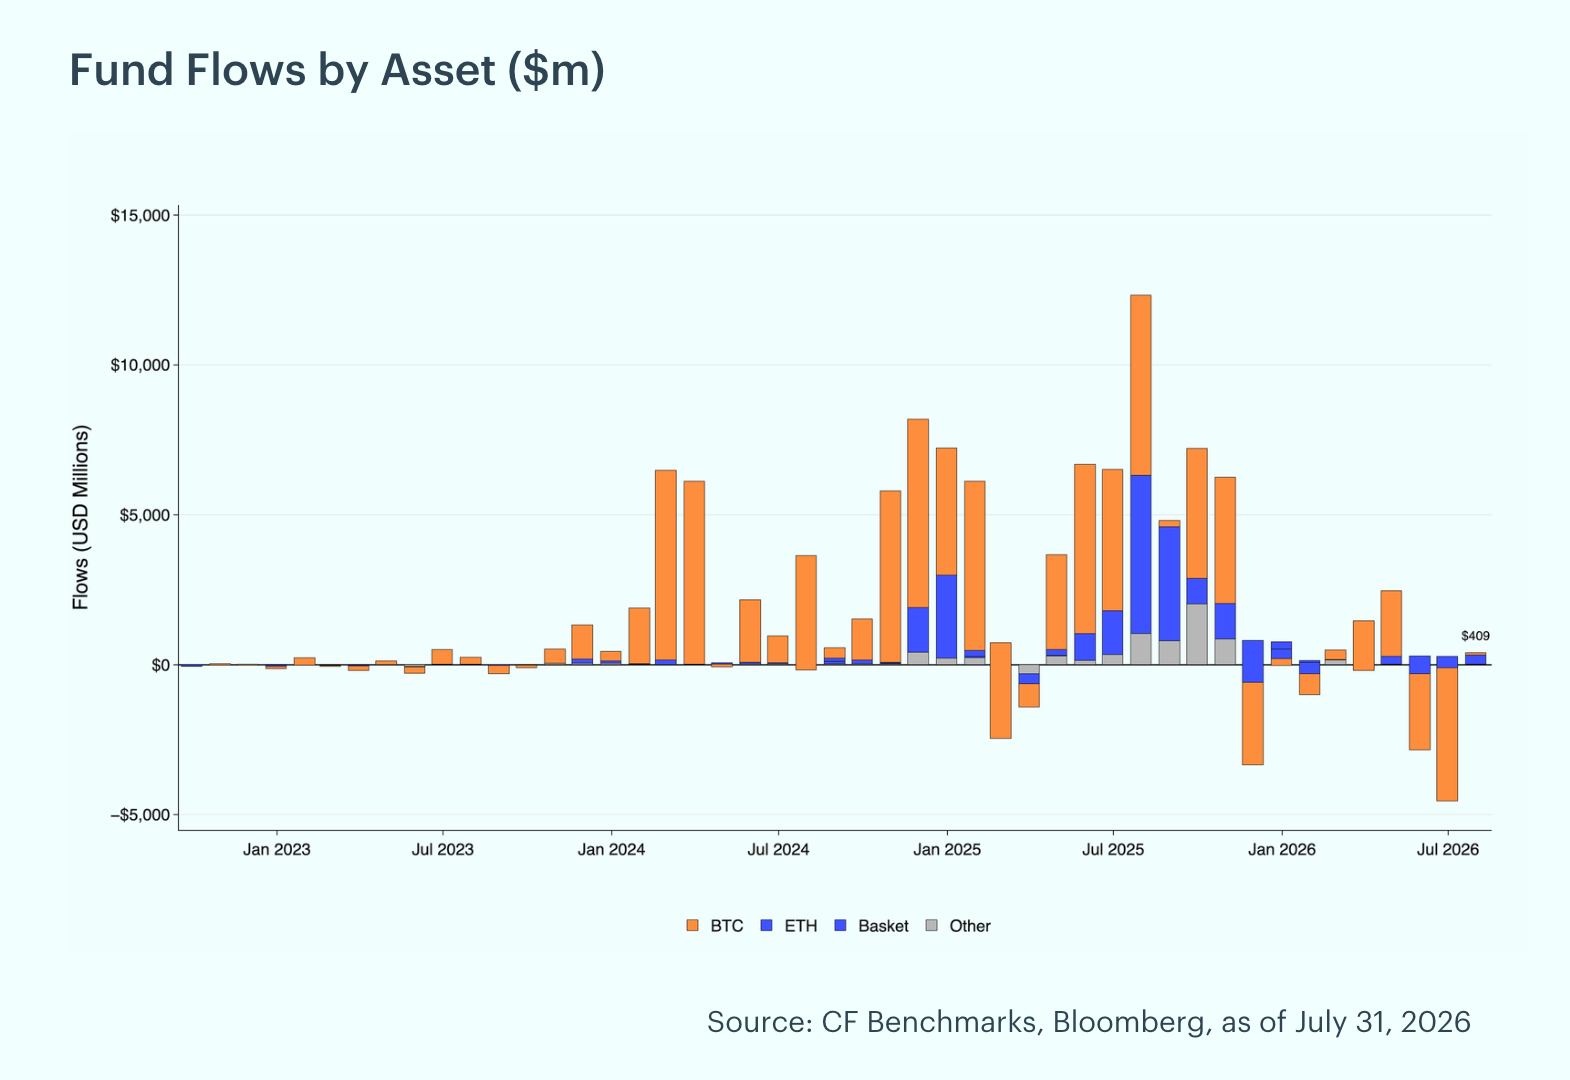
Fund Flows Turn Positive: Digital asset funds swung to net inflows in July, taking in roughly $409 million after $4.5 billion of outflows in June and ending a record eight-week outflow streak in the middle of the month. Ether funds led with $297 million of inflows and Bitcoin funds turned modestly positive at $89 million, while Other Single Crypto funds added $27 million and Basket/Index funds saw a marginal $4 million outflow. Ether taking the larger share of a smaller pool is the notable detail, and it is consistent with Ethereum's outperformance of Bitcoin over the month.
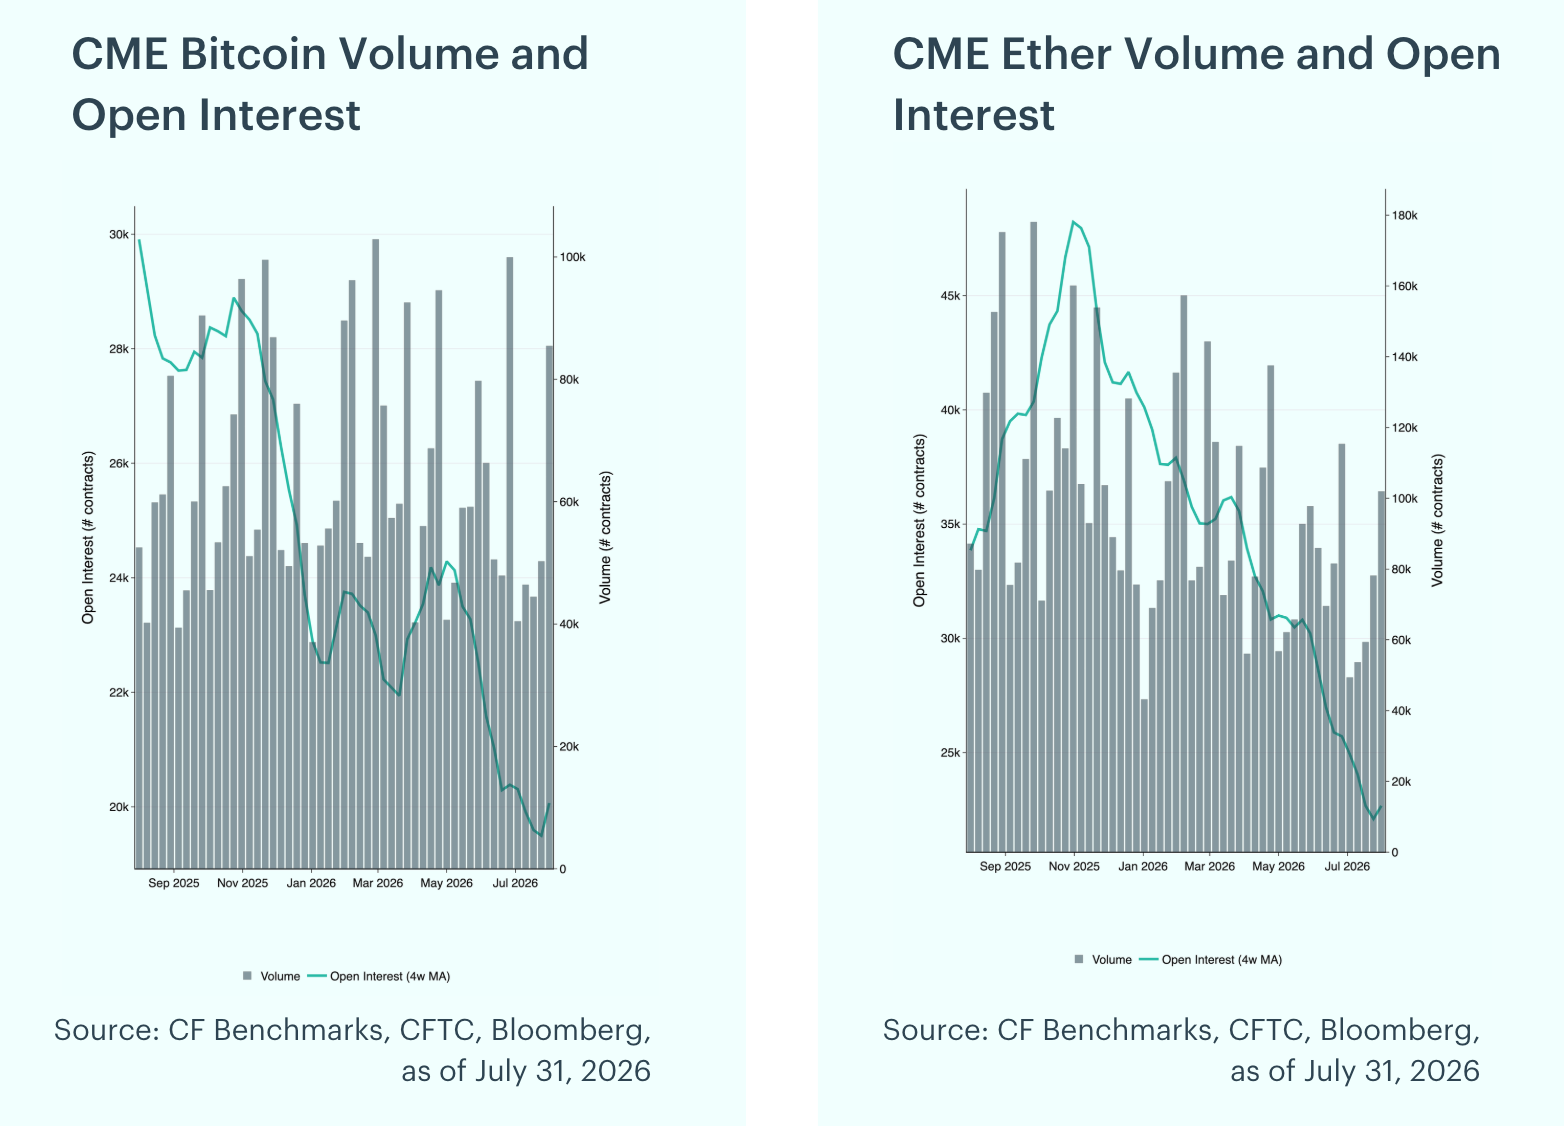
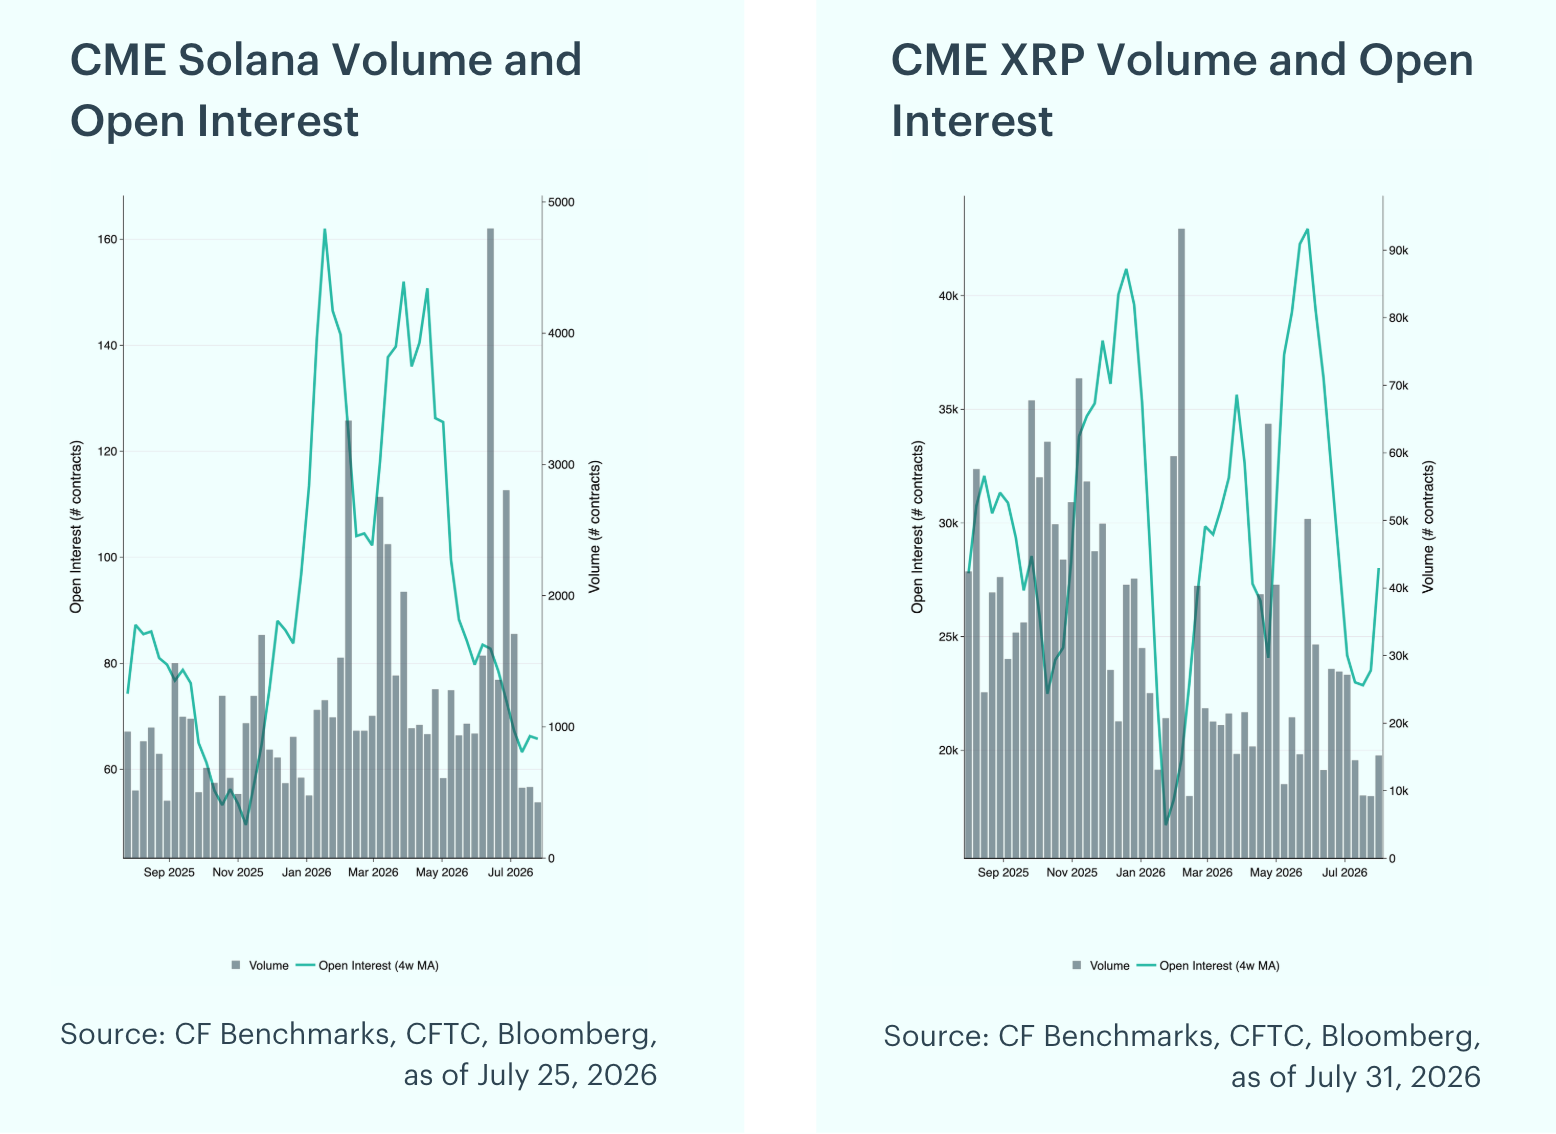
Futures Positioning Eases Further: CME futures positioning eased further in July even as spot prices recovered. On a four-week moving average basis, CME Ether open interest fell 11.8% month-over-month to roughly 22,668 contracts, the steepest drop in the group, and CME Solana open interest declined 9.9%, while CME Bitcoin eased 1.6% to about 20,066 contracts and CME XRP was little changed at 28,021 contracts. Peak weekly volumes fell from June, with Bitcoin at 85,457 contracts, Ether at 101,947, and XRP at 27,132, though both Bitcoin and Ether set their July highs in the final week. Positioning contracting into a rally points to a spot and exchange-traded product led move rather than a leveraged one.
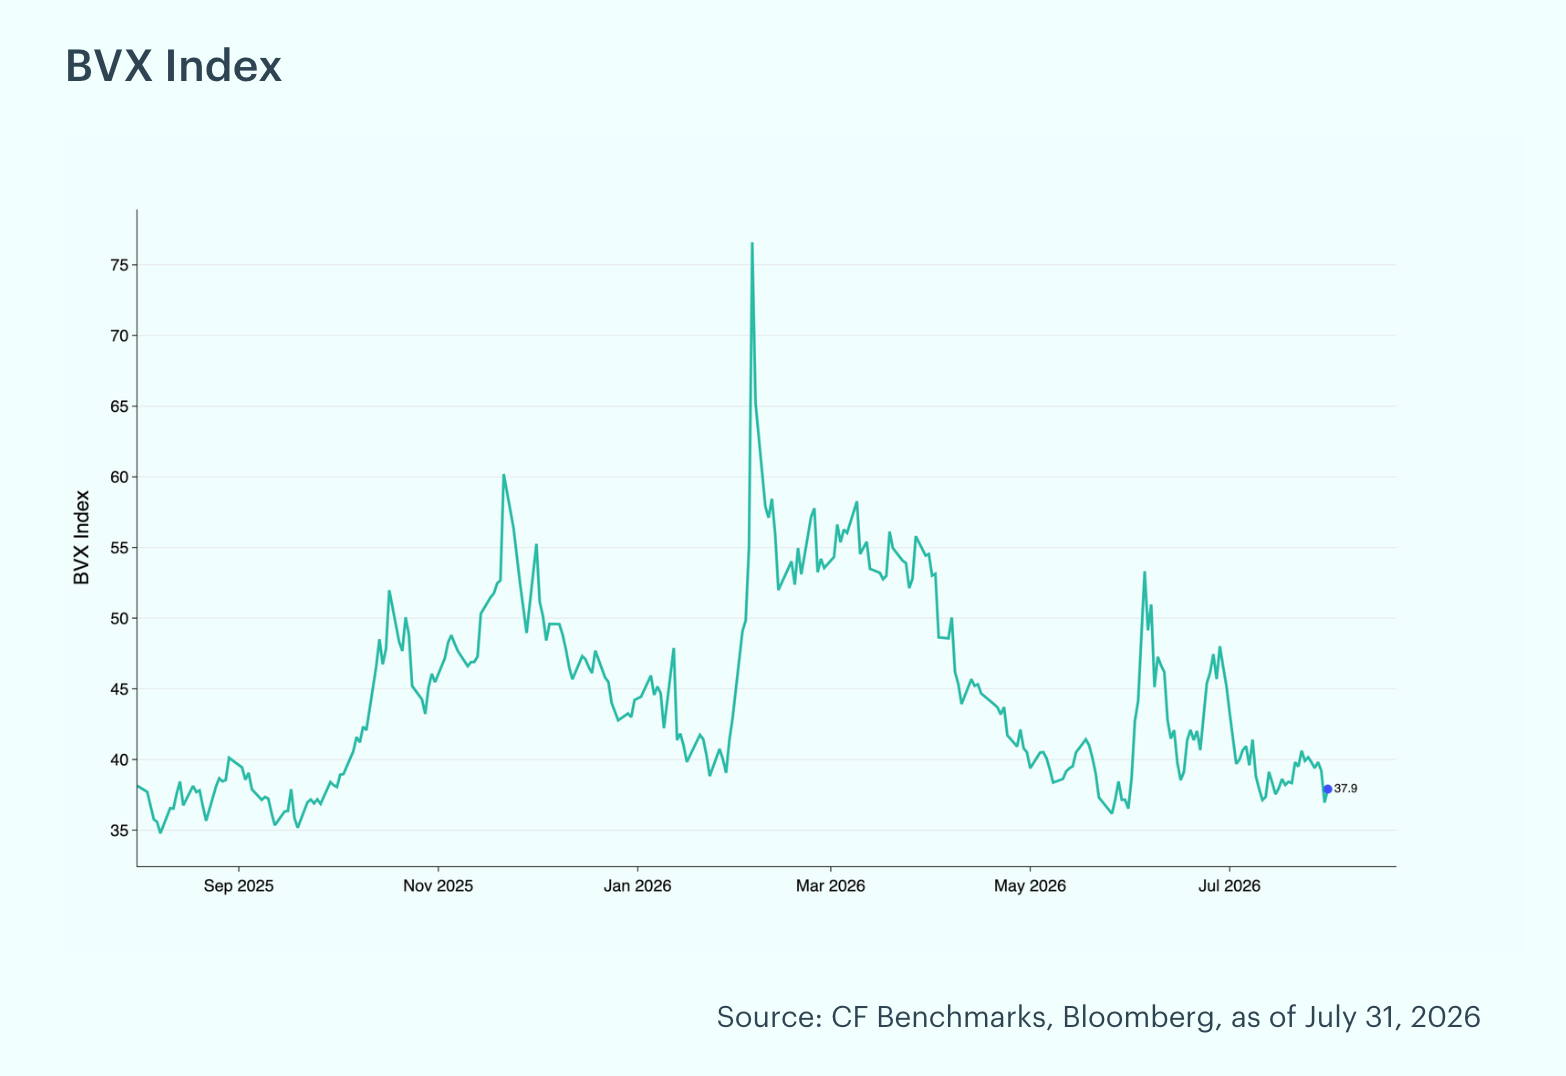
Bitcoin Volatility Compresses: The CF Bitcoin Volatility Index Settlement Rate (BVXS) is a daily benchmark that provides a forward-looking, 30-day constant-maturity measure of implied volatility, derived from CFTC-regulated Bitcoin option contracts traded on the CME. The BVX reflects the fair strike of a variance swap. The BVX fell in July, trading in a 36.95 to 43.28 range and closing the month at 37.90, down 16.2% from 45.21 at the end of June and in the 15th percentile of its trailing-year range. The rolling 30-day z-score finished at -1.03 and stayed negative throughout the month, ranging from -1.72 to -0.02, indicating implied volatility ran persistently below recent norms.
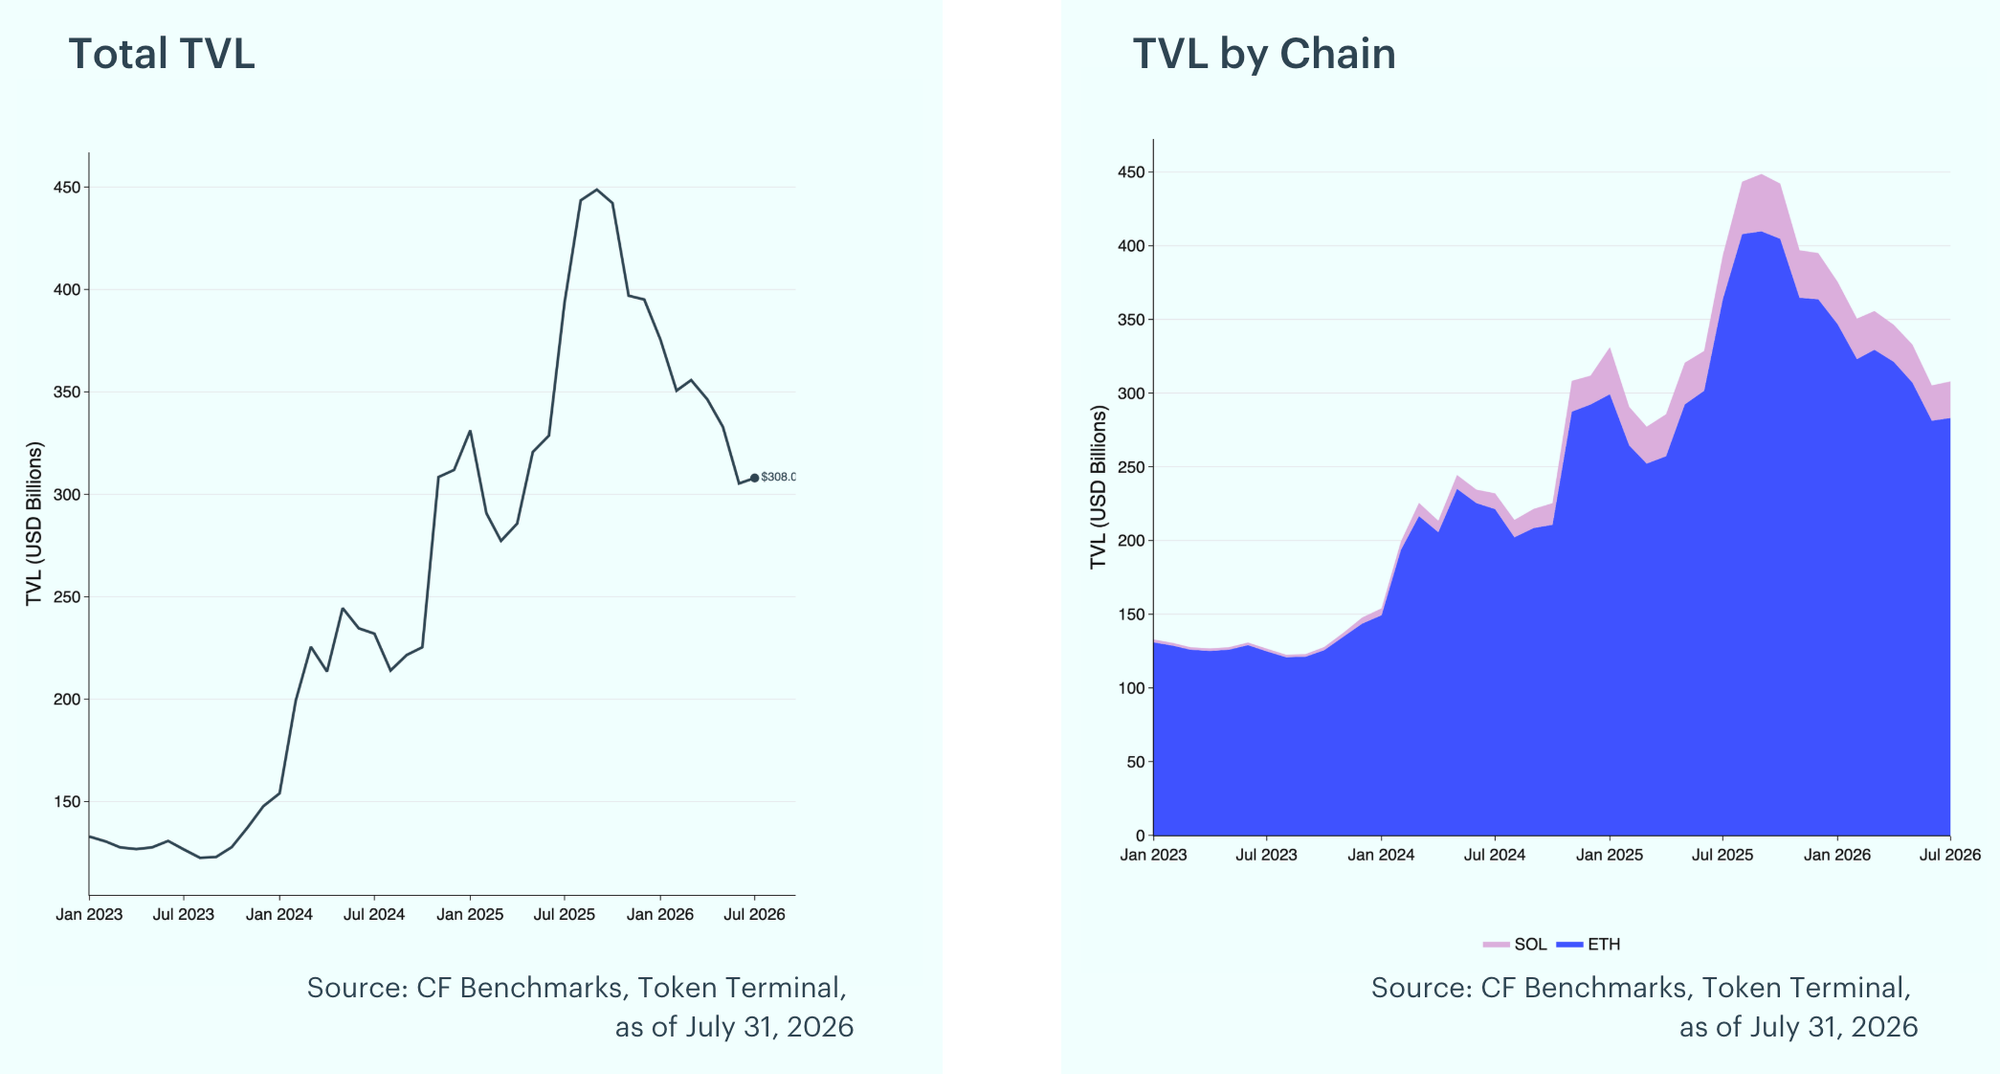
DeFi TVL Edges Higher: Total Value Locked rose 0.9% in July to $308.0 billion, up from $305.3 billion in June. Ethereum TVL edged higher to $283.1 billion, a 0.7% gain, while Solana TVL rose to $24.8 billion, up 3.4%, leaving Ethereum at roughly 92% of the tracked total.
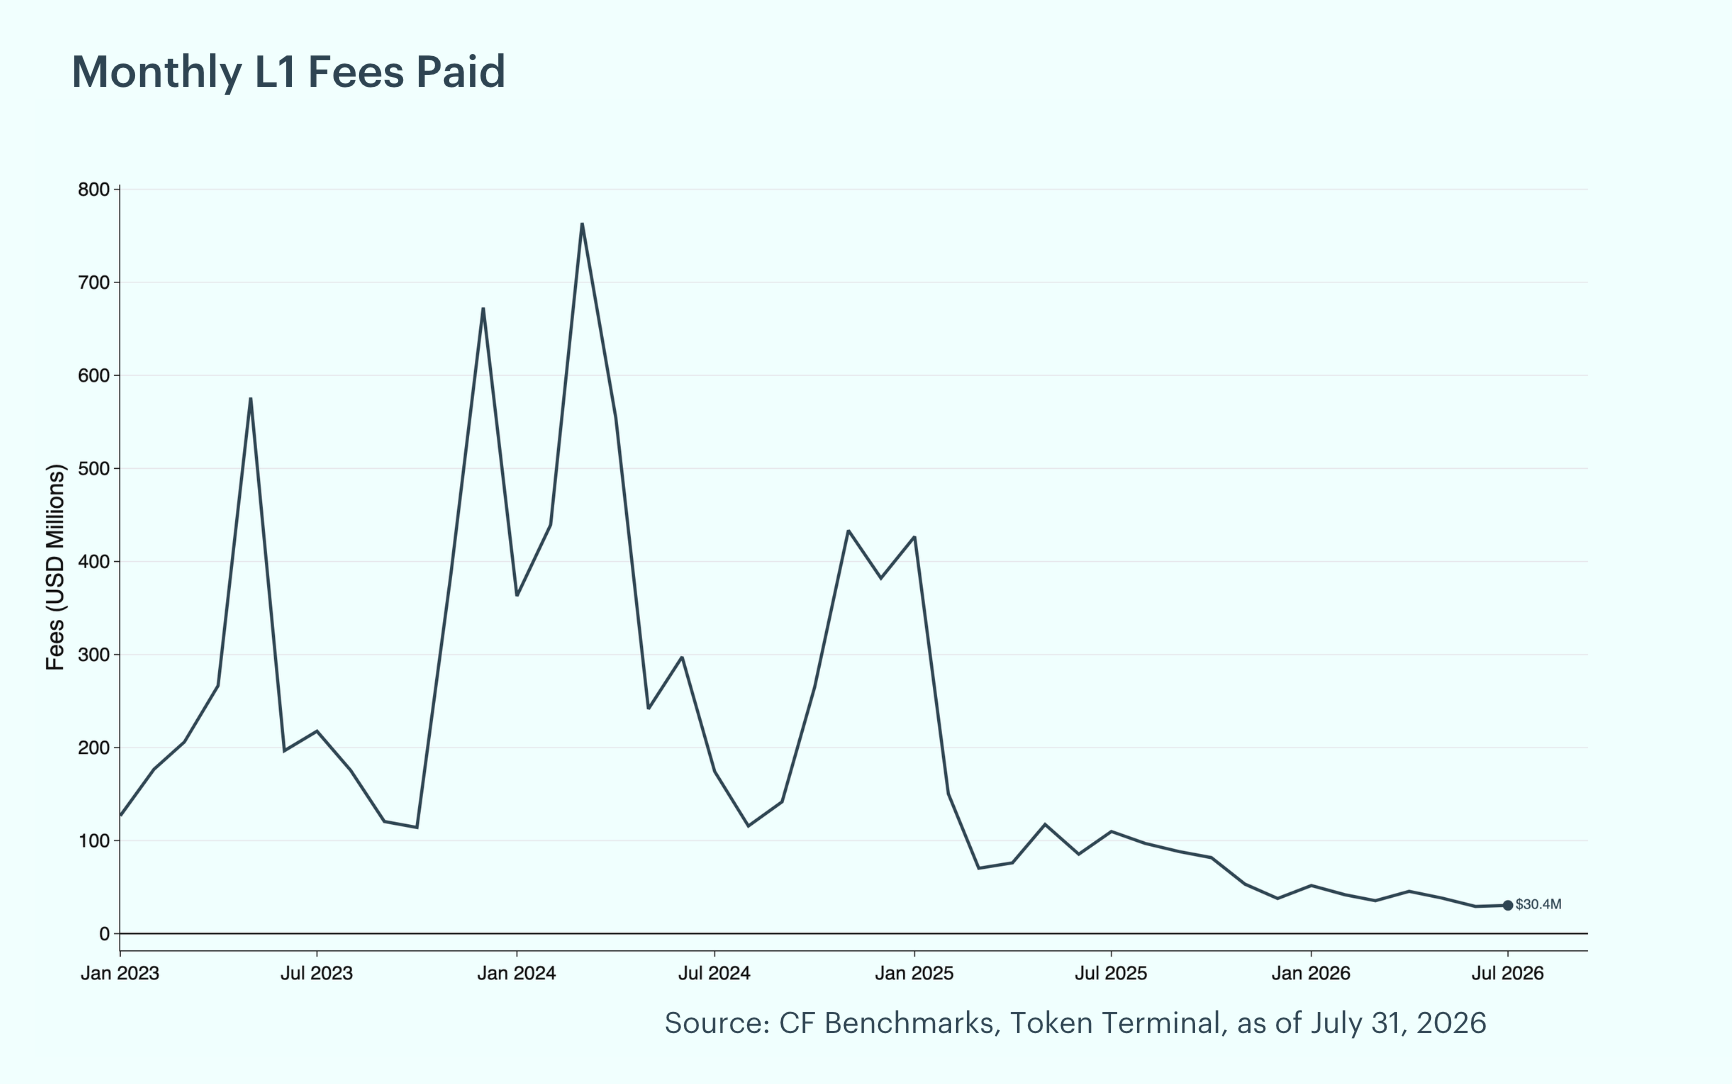
Layer-1 Fees Rise, Solana Extends Its Lead: Total Layer-1 fees rose 3.7% month-over-month in July to $30.4 million from $29.3 million in June. Solana led with $15.8 million, 51.9% of the total, on a 37.1% increase that broke a five-month run of softening fee generation, followed by Ethereum at $8.4 million, 27.8% of the total and down 25.4%, and Bitcoin at $6.0 million, 19.7% and down 4.3%. Solana now generates close to twice Ethereum's layer-1 fees, a reversal of the near-parity that held in June.
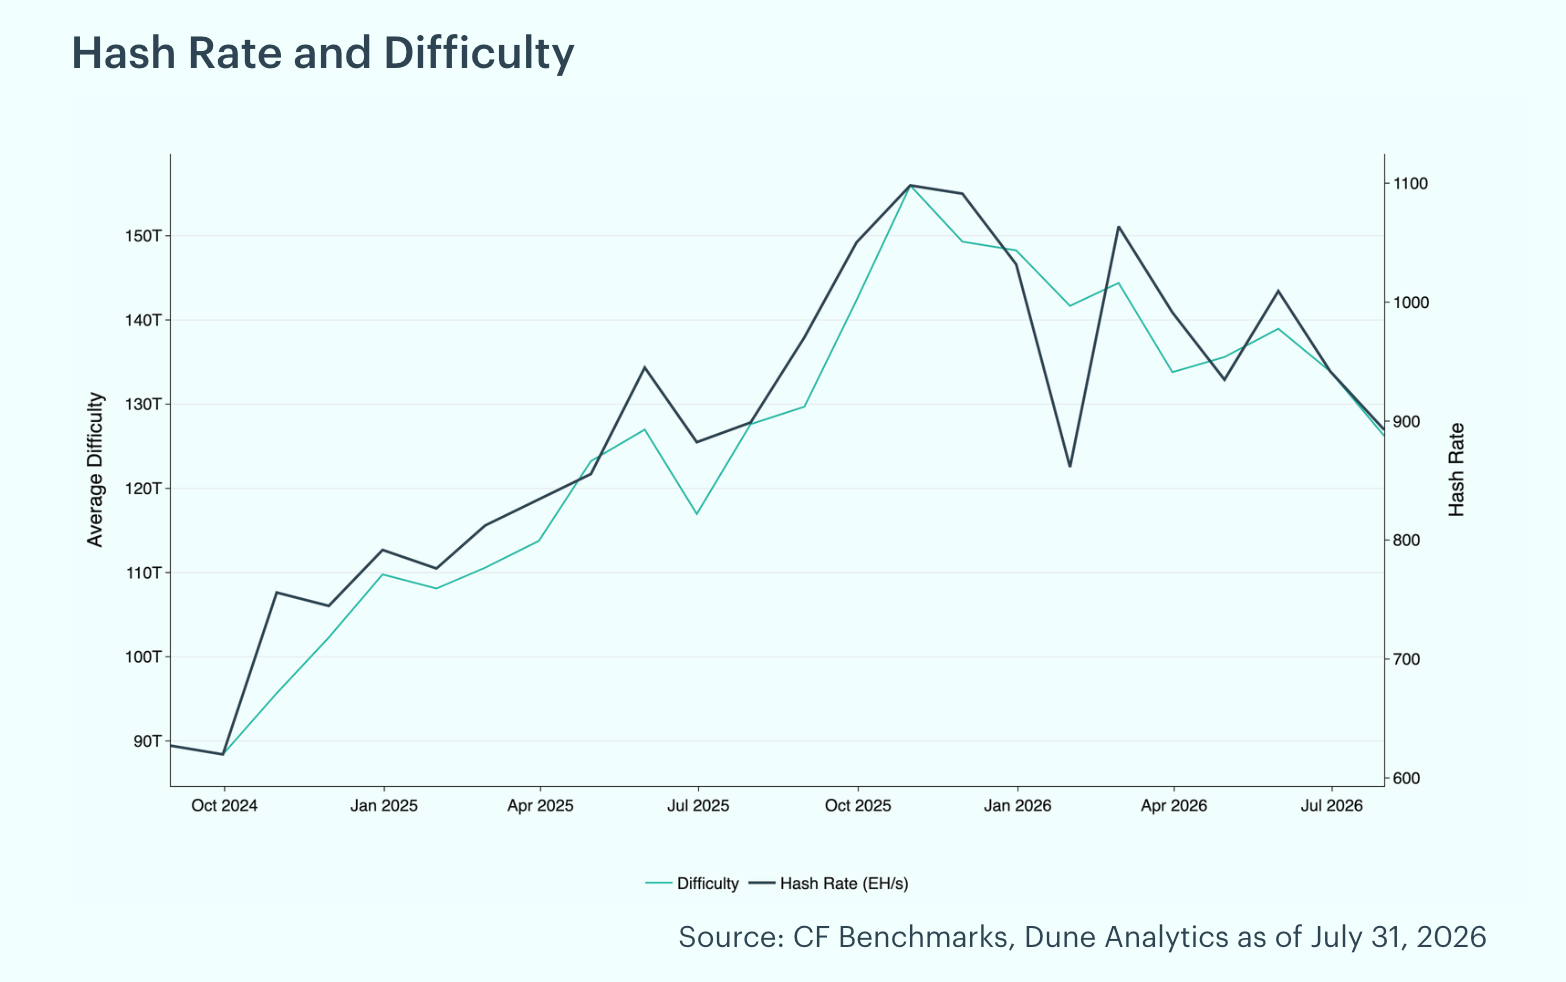
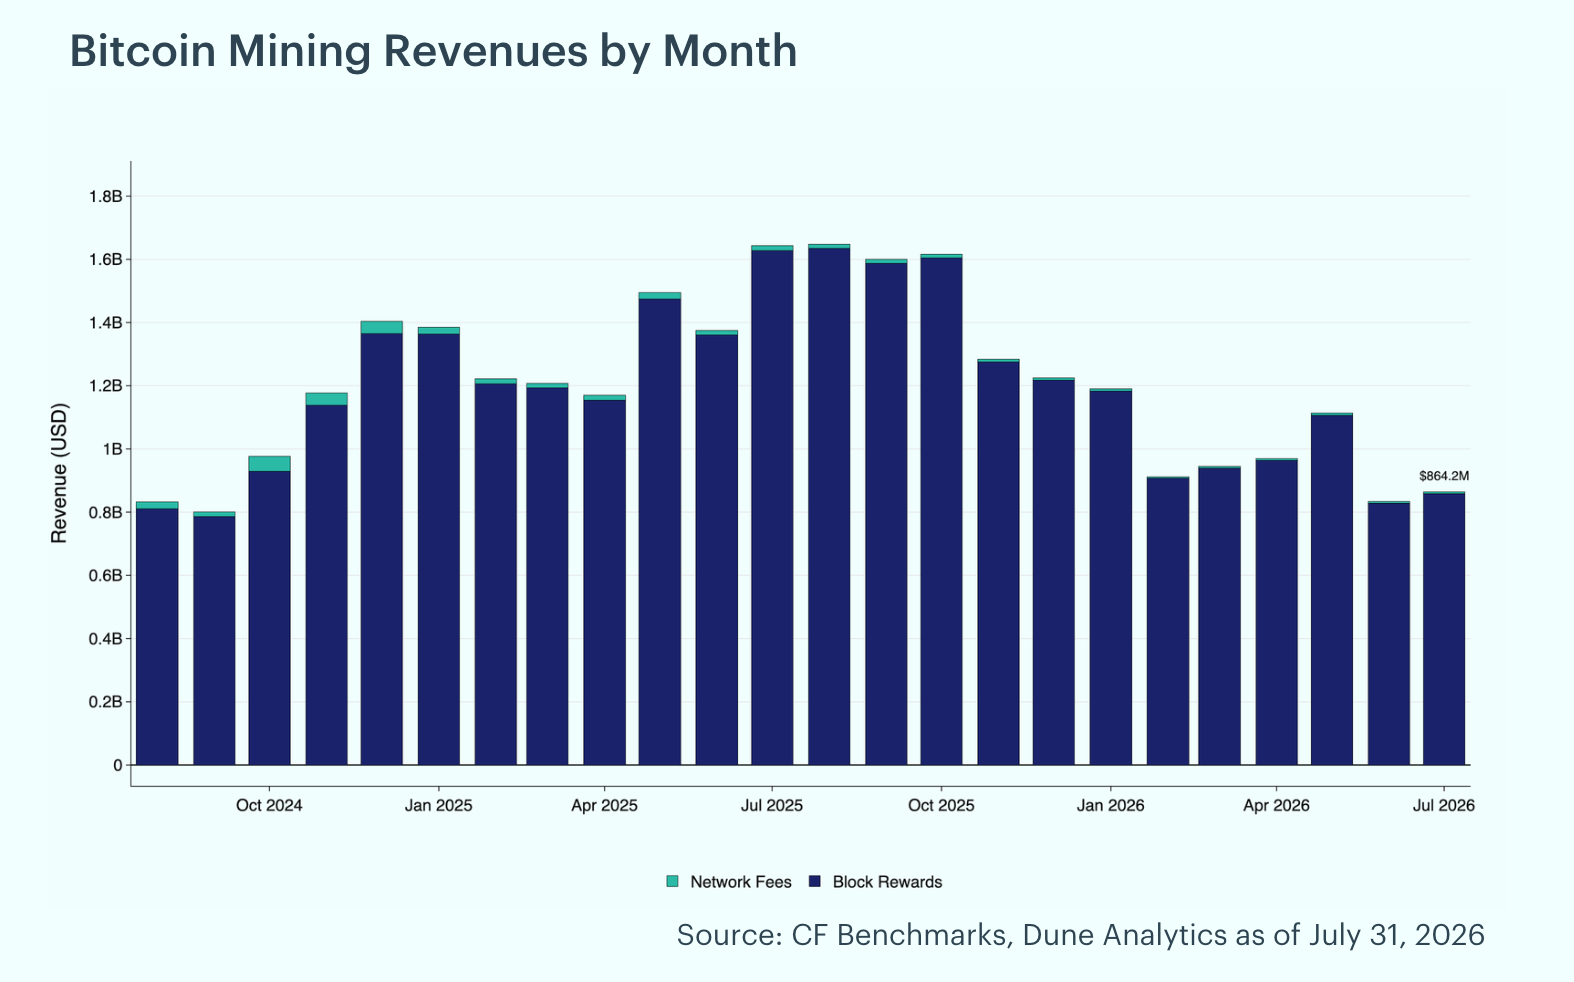
Hash Rate Eases, Mining Revenue Rises: Bitcoin's hash rate eased 5.2% in July, slipping to 893 exahashes per second from 942 EH/s at June's end, and ranged between 846 and 940 EH/s during the month. Mining difficulty, which measures the computational effort required to mine a new block and adjusts to maintain consistent block times, declined 5.7% to 126.2T as the network loosened alongside the pullback in hash power. Miners saw a 3.6% increase in revenue, with total mining revenue of $864.2 million. Of the total rewards earned during the month, 0.7% came from transaction fees, with block rewards totaling $858.2 million and fees contributing $6.0 million. Revenue rose even as hash rate fell, as Bitcoin's 6.6% price gain through the month more than offset the decline in hash power and lifted revenue per unit of hash.
To read the complete report, click here to view a PDF version. Additionally, please do not forget to subscribe to our latest news and research for the most relevant institutional insights on digital assets and the top digital assets by market cap.
The information contained within is for educational and informational purposes ONLY. It is not intended nor should it be considered an invitation or inducement to buy or sell any of the underlying instruments cited including but not limited to cryptoassets, financial instruments or any instruments that reference any index provided by CF Benchmarks Ltd. This communication is not intended to persuade or incite you to buy or sell security or securities noted within. Any commentary provided is the opinion of the author and should not be considered a personalised recommendation. Please contact your financial adviser or professional before making an investment decision.
Note: Some of the underlying instruments cited within this material may be restricted to certain customer categories in certain jurisdictions.
Factor Friday - September 18, 2026
Value led CF Benchmarks' factor table for a third straight week at 1.85%, even as its pace cooled. Growth flipped positive while Downside Beta turned negative for the first time in three weeks, and the Market's decline eased sharply to 0.70% from last week's near-5% drop.

Mark Pilipczuk
Changes to the Token Market Price Benchmarks Series - Market Prices – 15 September 2026
The Administrator has confirmed changes to the Token Market Price Family for the period 08 September 2026 to 15 September 2026
CF Benchmarks
Emerging Leaders, Established Activity
The CME CF Emerging Crypto Index provides rules-based exposure beyond Bitcoin and Ether, capturing networks that account for most observed protocol fees and user activity while applying the institutional standards required for a credible benchmark.
CF Benchmarks
By clicking Accept, you consent to CF Benchmarks's use of cookies.
Visit Cookie Settings to learn how CF Benchmarks uses cookies and to adjust your preferences.