
Sep 15, 2026
Emerging Leaders, Established Activity
Bitcoin and Ether account for most institutional digital-asset exposure, and their liquidity, custody and regulatory standing justify that concentration. But the exposure has a gap. In July 2026, most blockchain network fee revenue and most fee-paying users sat outside Bitcoin and Ether entirely. The CME CF Emerging Crypto Index (ECI) is a rules-based attempt to close that gap. It holds ten liquid networks selected under the same institutional eligibility framework used across the CME CF index family, with Bitcoin and Ether excluded by construction.
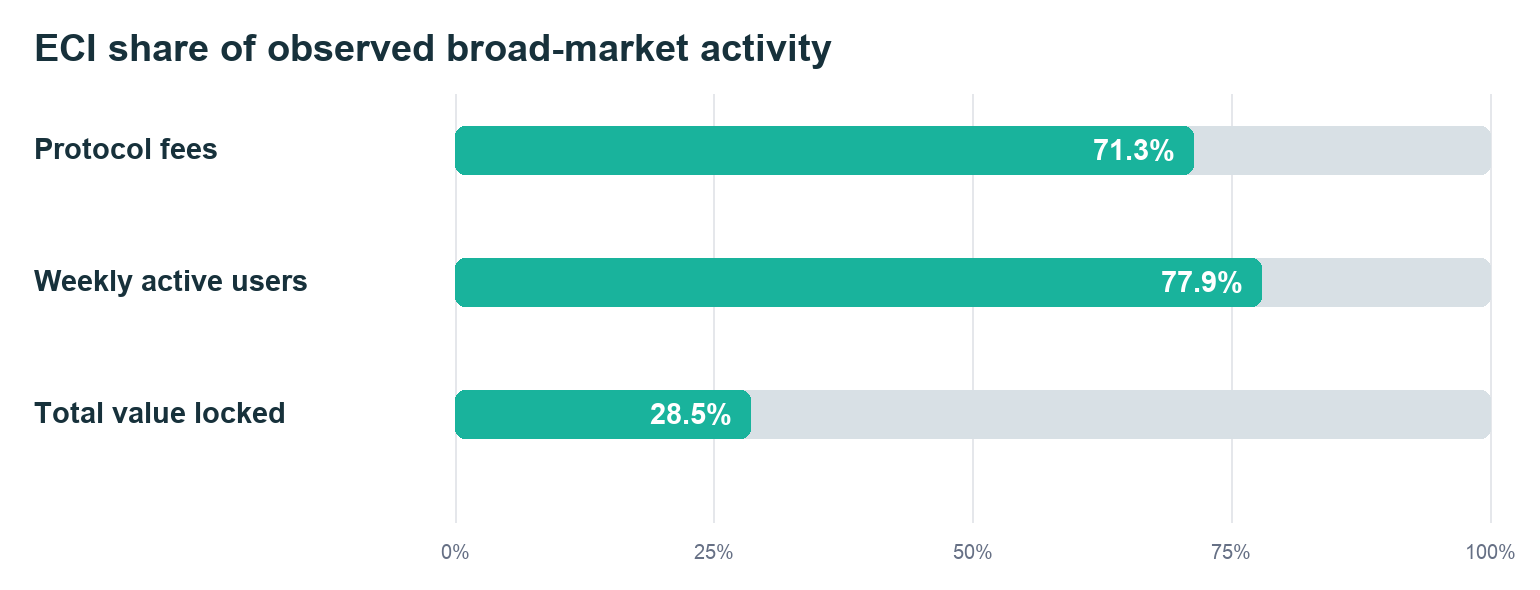
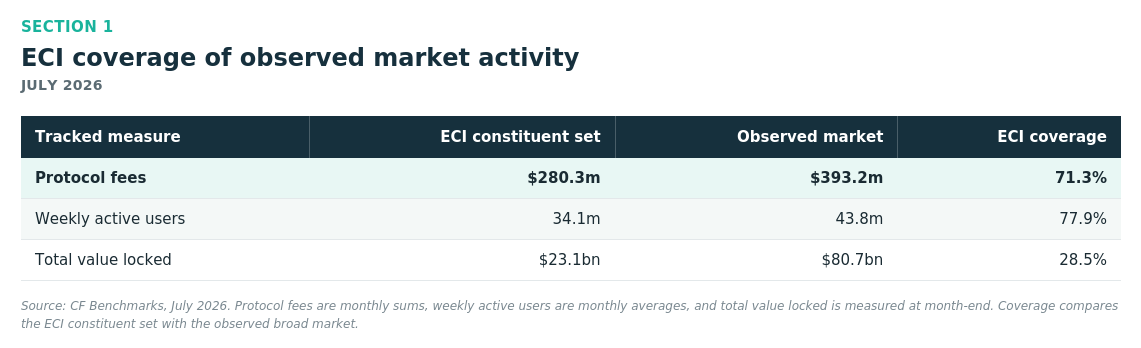
Fee and user coverage run well ahead of total value locked. We read that gap as structural, not a data problem. Ether, the largest comparable TVL network in the observed market, cannot be held by an index that excludes it by definition, so locked capital stays concentrated where ECI cannot follow. Fees and users do not concentrate the same way.
Before going further into how the index is built, we want to state plainly what it is not. ECI is not a broad altcoin basket, and it is not a substitute for a market benchmark. It is a concentrated, higher-volatility allocation designed to complement an established BTC and ETH core, and the risk section below sets out exactly what that costs.
What the index actually is
ECI draws from the CF Investible Universe, applies the same institutional eligibility screens used elsewhere in the CME CF family, excludes Bitcoin and Ether, and selects the ten highest-ranked remaining assets by free-float market capitalization. Weighting follows free-float market capitalization. Returns are calculated on a price-return basis, and the index is reviewed semiannually, with rank buffers, on the first London and New York business day in March and September.
The name is easy to misread. Emerging describes the access, not the assets. Every constituent is an established protocol with a multi-year operating history and deep exchange listings, and as the coverage numbers above show, this cohort already accounts for most observed fee revenue and user activity. What has been missing is a formal, rules-based benchmark providing systematic exposure to it.
One mechanical note for anyone comparing return series: several constituents carry native staking or protocol-level yield that a price-return index does not capture. Total-return comparisons should account for that gap first.
Standards without compromise
Building a basket of large assets outside BTC and ETH is not hard. Building one where every constituent clears institutional tests for liquidity, exchange listing, custody, codebase provenance and classification requires an actual screen, applied in sequence, with the Bitcoin and Ether exclusion coming after the screening rather than in place of it.
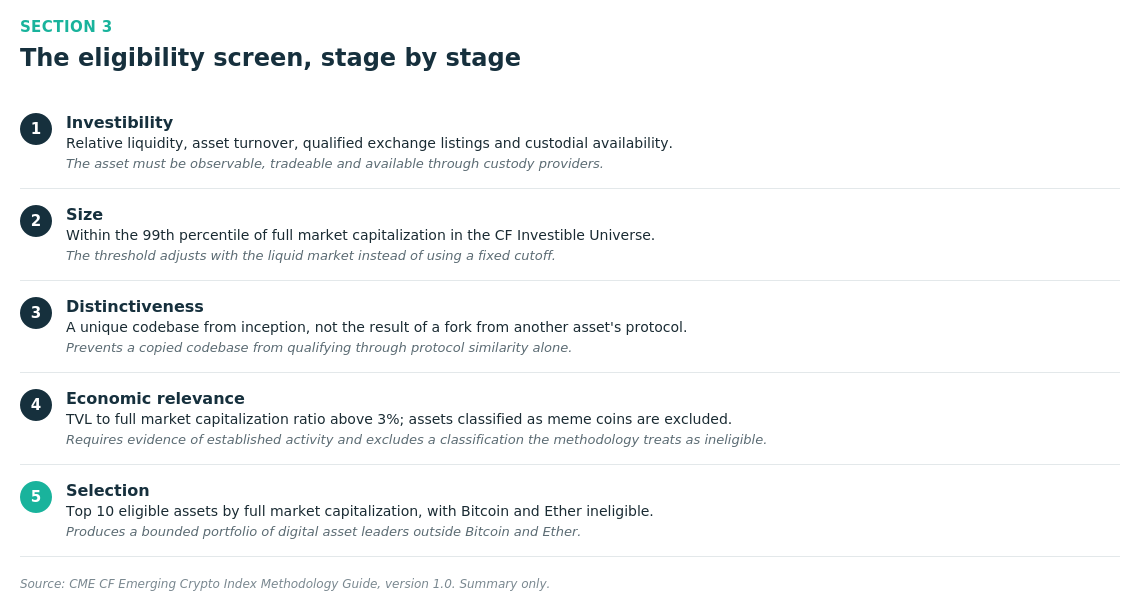
Selection itself is buffered rather than based on a hard cutoff. A new asset ranked seventh or higher enters and replaces the lowest-ranked incumbent outright. Rank eight only enters if an incumbent has fallen to twelfth or lower, rank nine needs an incumbent at thirteenth or lower, and rank ten needs an incumbent at fourteenth or lower. The effect is to let genuine new leaders in while damping the churn that would otherwise come from small rank changes near the cutoff.
The portfolio
At the 13 August 2026 backtest endpoint, the index held ten assets across payment networks, general-purpose and specialized smart-contract platforms, trading infrastructure, lending and oracle services.
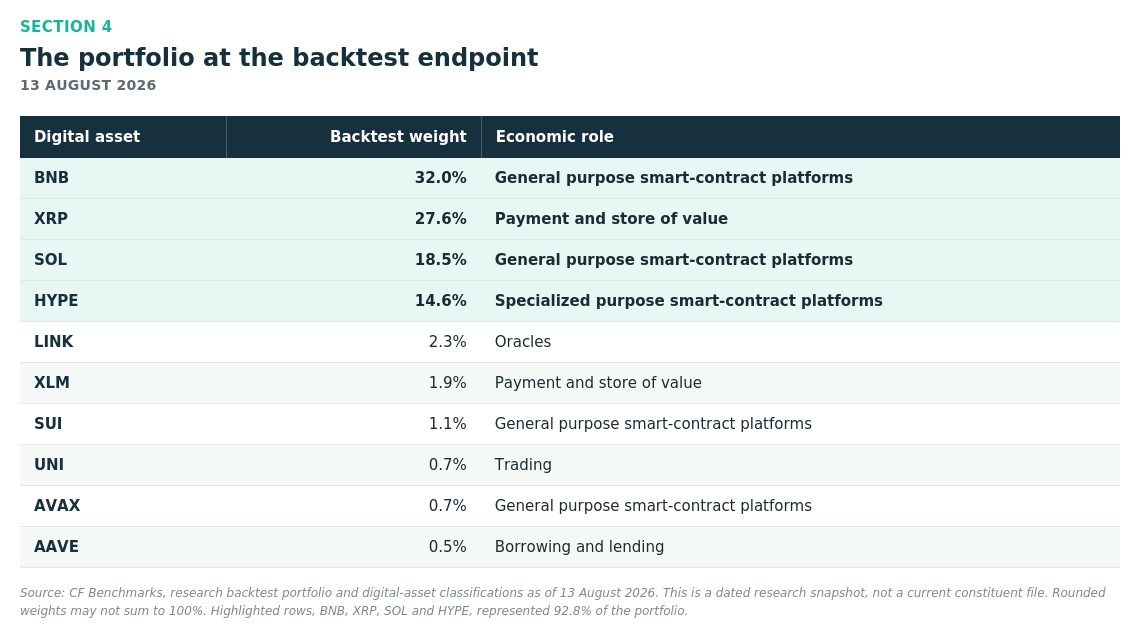
BNB, XRP, SOL and HYPE alone made up 92.8% of the portfolio. That is not a flaw particular to ECI. Free-float market-capitalization weighting in a concentrated market produces a concentrated benchmark, the same way it does in equities, so we treat concentration as a defining feature of this index rather than a footnote. The tail names add role diversity and give the review process somewhere to route future leadership changes, but at these weights they do little to move the overall return profile.
Risk, and how to size it
We would flag this as the section that matters most for anyone deciding how ECI fits into a portfolio. We are direct about it. ECI makes no outperformance claim.
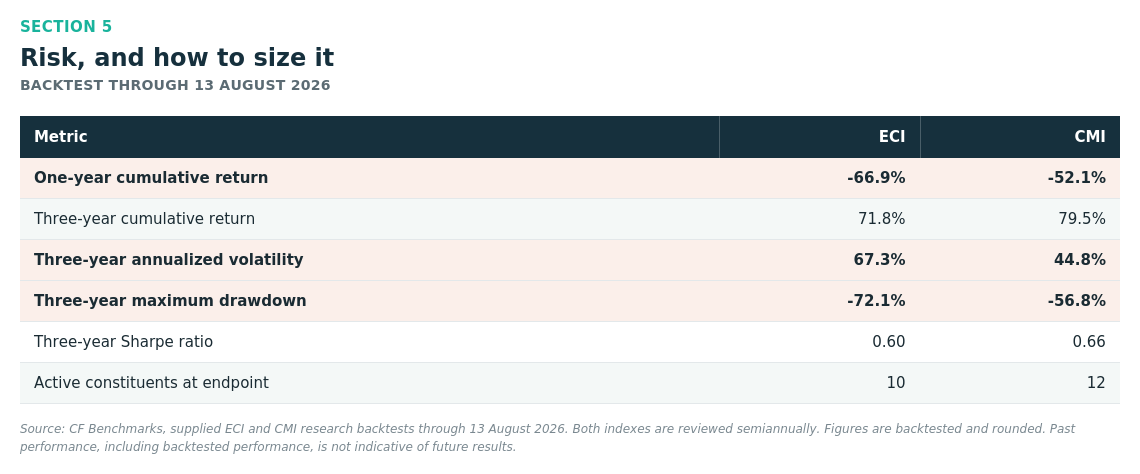
Against CMI, the broad-market index, ECI trailed on both horizons in the backtest. It ran 14.8 pp behind over one year and 7.7 pp behind over three years, with 22.5 pp higher annualized volatility and a maximum drawdown roughly 15.3 pp deeper. On this evidence, the additional risk was not compensated.
One counterpoint belongs here rather than in a footnote. During the eleven months when CMI itself gained more than 10%, ECI averaged a 31.4% return against 19.6% for CMI and beat it in six of those eleven months. ECI can amplify the upside in a strong advance. That is a narrower claim than saying the extra risk pays off across a full cycle, and the backtest does not support the broader version.
We would also add a caveat on the numbers themselves. The Sharpe ratios, 0.60 for ECI against 0.66 for CMI, look close enough to read as roughly comparable risk-adjusted performance. They are not, once volatility drag is accounted for. Sharpe ratios built on arithmetic mean returns understate how much compounding cost comes from volatility, and at 67.3% annualized, that cost is not trivial. On a compound-return basis, the gap between the two series is wider than 0.60 versus 0.66 suggests.
None of this makes ECI a tactical instrument to trade around individual months. It is built as a strategic sleeve, rebalanced on a fixed policy schedule, meant to sit alongside a BTC and ETH core rather than substitute for one. The volatility and drawdown numbers above are the relevant constraints on how large that sleeve should be.
A distinct view of digital-asset leadership
ECI's case rests on coverage, not on outperformance. In July 2026, its ten constituents accounted for 71.3% of observed protocol fees and 77.9% of observed weekly active users, while holding 28.5% of observed locked capital and excluding the single largest comparable TVL network by construction. A BTC and ETH core does not provide systematic exposure to that activity today, and no formal, rules-based, institutionally screened instrument has offered allocators a way to get it.
Bitcoin and Ether give a portfolio the market's reserve asset and its settlement layer. ECI gives it rules-based exposure to the networks where the fees are actually being paid. Those are two different jobs, and the risk numbers above are the price of asking one instrument to do the second one.
The information contained within is for educational and informational purposes ONLY. It is not intended nor should it be considered an invitation or inducement to buy or sell any of the underlying instruments cited including but not limited to cryptoassets, financial instruments or any instruments that reference any index provided by CF Benchmarks Ltd. This communication is not intended to persuade or incite you to buy or sell security or securities noted within. Any commentary provided is the opinion of the author and should not be considered a personalised recommendation. Please contact your financial adviser or professional before making an investment decision.
Note: Some of the underlying instruments cited within this material may be restricted to certain customer categories in certain jurisdictions.
Factor Friday - September 18, 2026
Value led CF Benchmarks' factor table for a third straight week at 1.85%, even as its pace cooled. Growth flipped positive while Downside Beta turned negative for the first time in three weeks, and the Market's decline eased sharply to 0.70% from last week's near-5% drop.

Mark Pilipczuk
Changes to the Token Market Price Benchmarks Series - Market Prices – 15 September 2026
The Administrator has confirmed changes to the Token Market Price Family for the period 08 September 2026 to 15 September 2026
CF Benchmarks
Emerging Leaders, Established Activity
The CME CF Emerging Crypto Index provides rules-based exposure beyond Bitcoin and Ether, capturing networks that account for most observed protocol fees and user activity while applying the institutional standards required for a credible benchmark.
CF Benchmarks
By clicking Accept, you consent to CF Benchmarks's use of cookies.
Visit Cookie Settings to learn how CF Benchmarks uses cookies and to adjust your preferences.