
Jul 03, 2026
Factor Friday - July 3, 2026
Value Factor Leads as the Market Rebounds
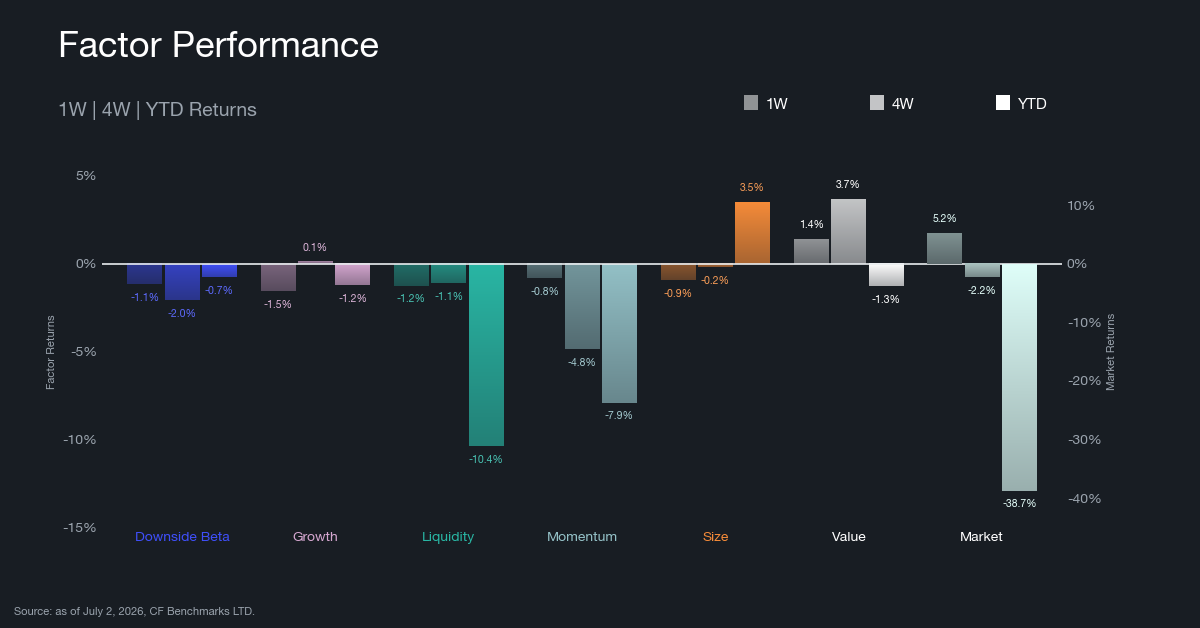
For the week ending July 2, the broad market staged a sharp rebound, with the Market gaining +5.22% after the prior week's -6.35% selloff. Cross-sectional factors largely sat out the bounce. Value was the only style factor in positive territory at +1.42%, while Momentum (-0.83%), Size (-0.92%), Downside Beta (-1.14%), Liquidity (-1.25%), and Growth (-1.55%) all finished lower. Over four weeks, Value leads at +3.67% against the Market still down -2.24%, and year-to-date the picture is unchanged in character: Size (+3.50%) remains the only style factor meaningfully positive while the Market has lost -38.71%. The takeaway for investors is that this week's gains were a beta event, a broad-market relief rally in which the defensive factors that held up during the selloff gave back a little ground, while the value factor quietly extended its recent run.
Rolling Factor Rankings and Rotation
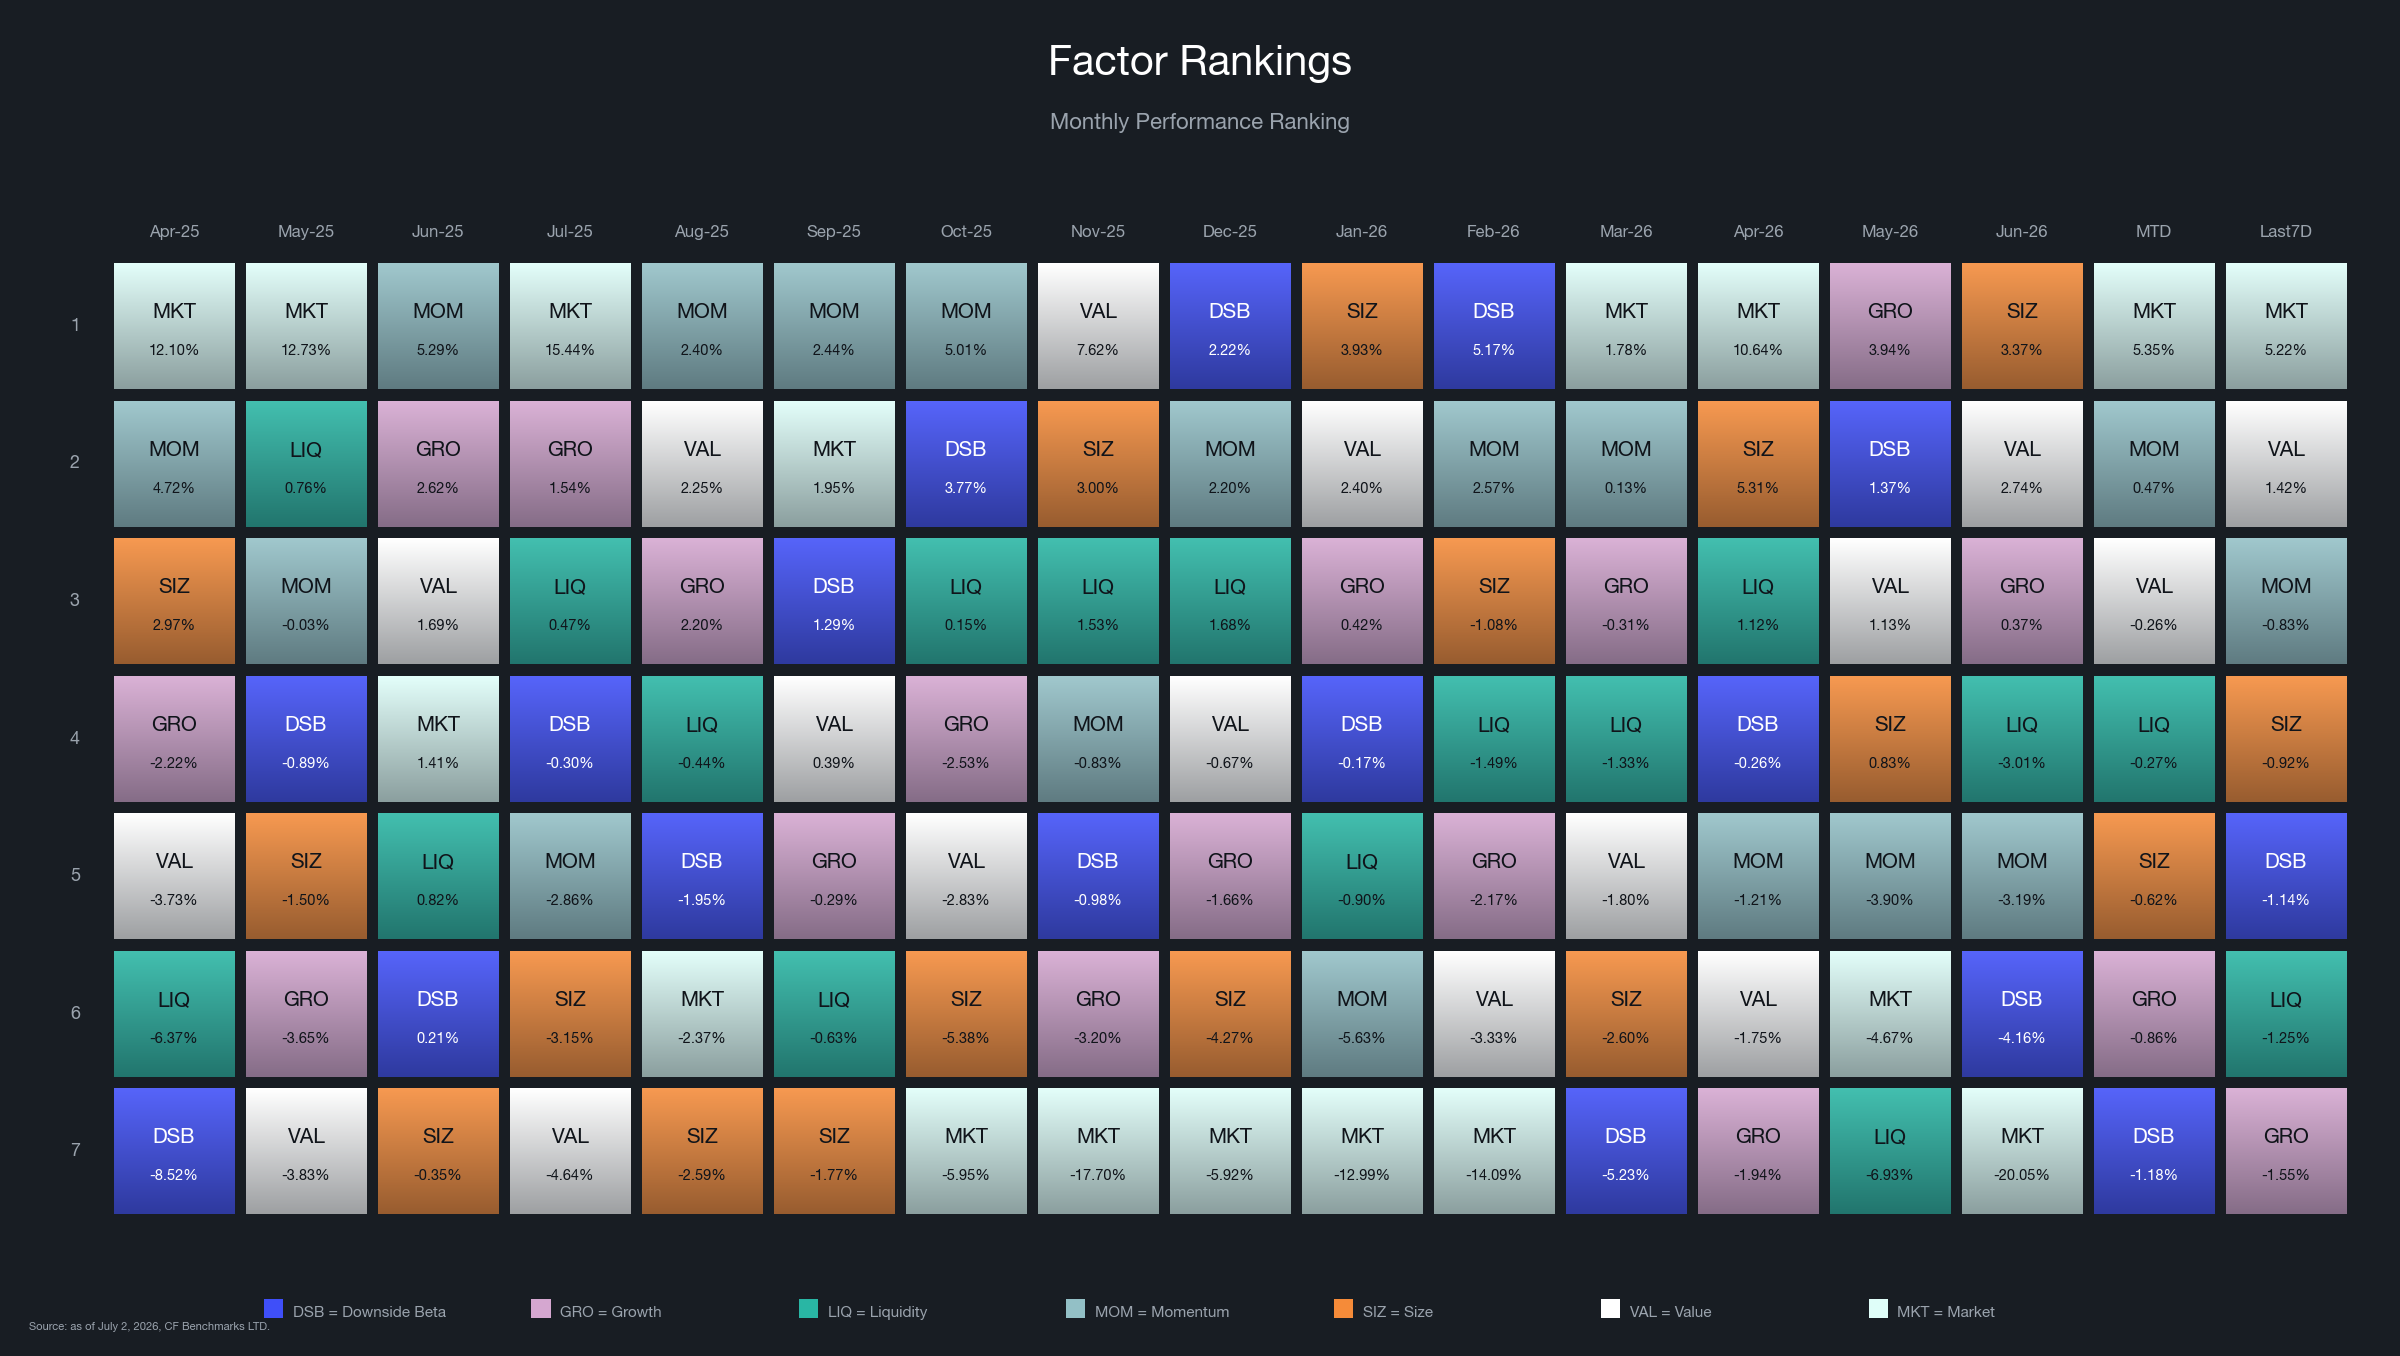
The quilt chart shows a leadership flip: Market jumped from last place, where it sat across every horizon a week ago, to the top of the weekly and month-to-date rankings at +5.22% and +5.35% respectively. Value ranked second on the week at +1.42%, its second consecutive week in positive territory, and it also finished second for June at +2.74%. Size, which led the June table at +3.37% and had held near the top of the rankings for several weeks, slipped to mid-pack on the week at -0.92% - its first weekly decline after an extended defensive run. Liquidity, last week's leader, reversed to -1.25%, and Growth fell to the bottom of the style field at -1.55% after topping the May rankings. Momentum remains stuck in its long negative trend, mid-pack on the week and negative on every longer horizon. The pattern is a classic relief-rally rotation: the high-beta market basket snapped back while the defensive factors that led during the drawdown - Liquidity, Size, Downside Beta - gave back ground. Value's persistence through both the selloff and the rebound is the more durable signal to watch.
Market and Key Factor Betas
Market Beta
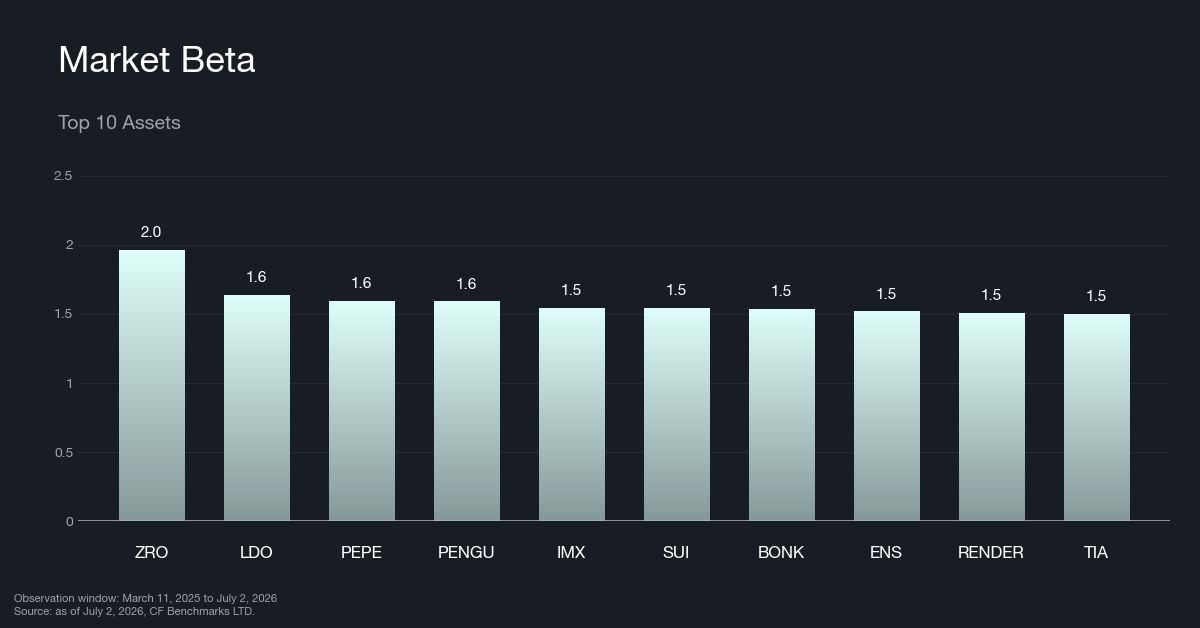
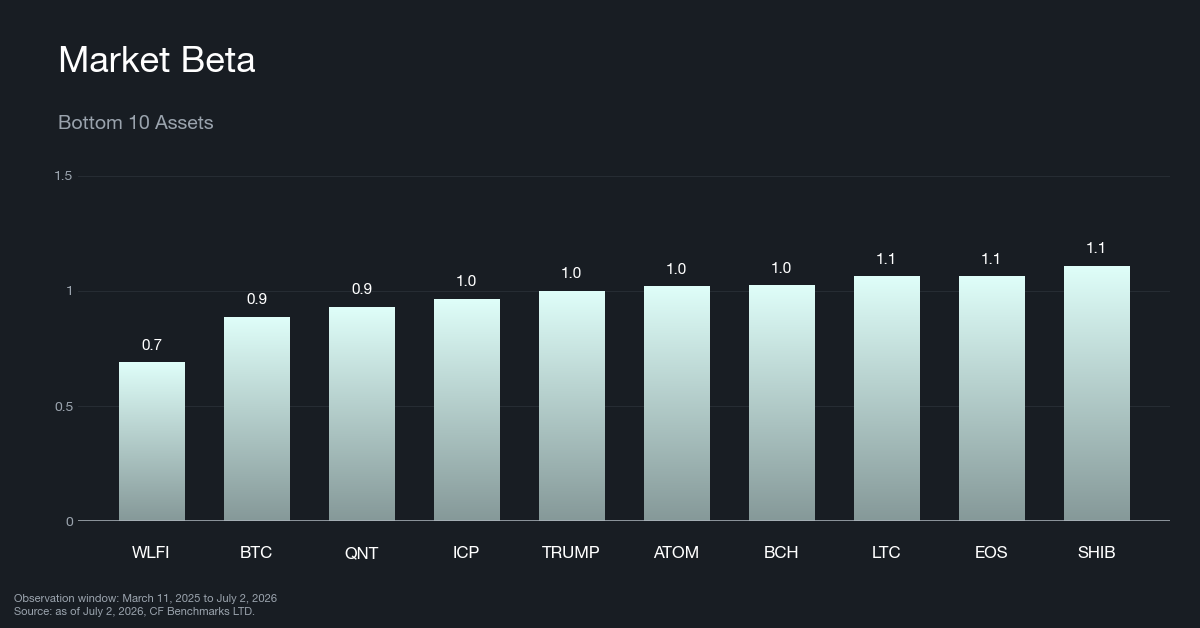
The high market-beta cohort remains concentrated in meme coins, layer-2 and interoperability tokens, and newer infrastructure names, with betas clustered above 1.5. A cross-chain messaging token entered the top 10 this week at the very top of the list with a beta near 2.0, displacing a layer-2 governance token - these are the assets that captured the most upside in this week's rebound, just as they bore the brunt of the prior week's selloff. At the defensive end the composition is unchanged: Bitcoin sits near 0.89 and a large-cap governance token anchors the bottom of the list below 0.7, with older payment and smart-contract chains filling out the low-beta group. With the Market factor up +5.22% on the week, the high-beta cohort was the clear winner, though its year-to-date drawdown remains severe.
Value
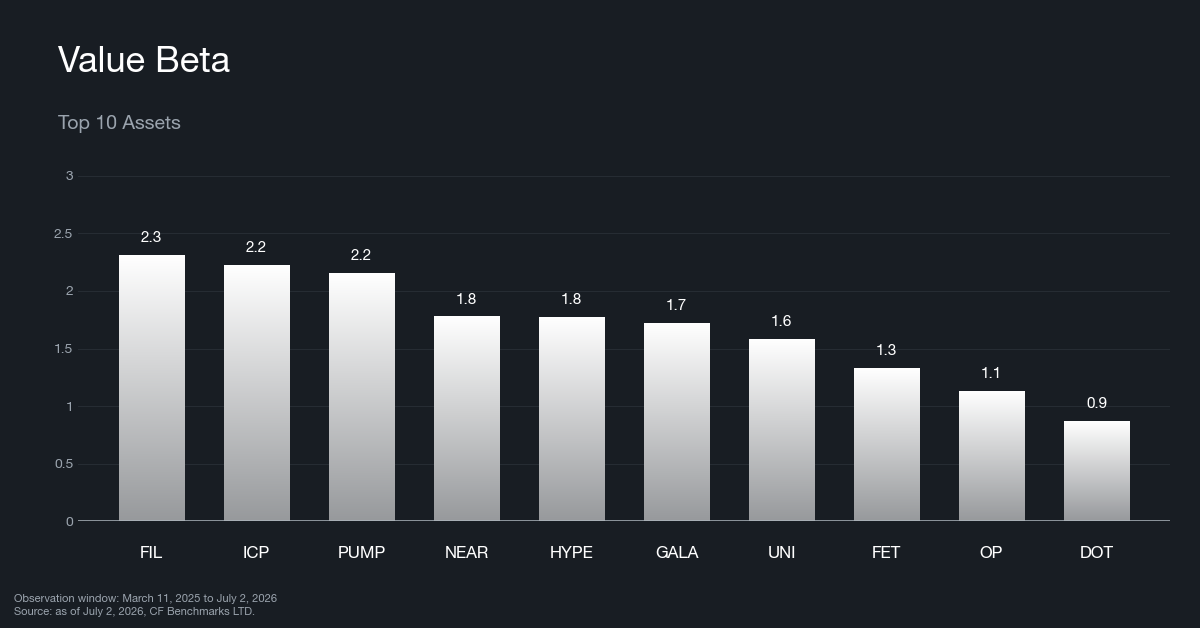
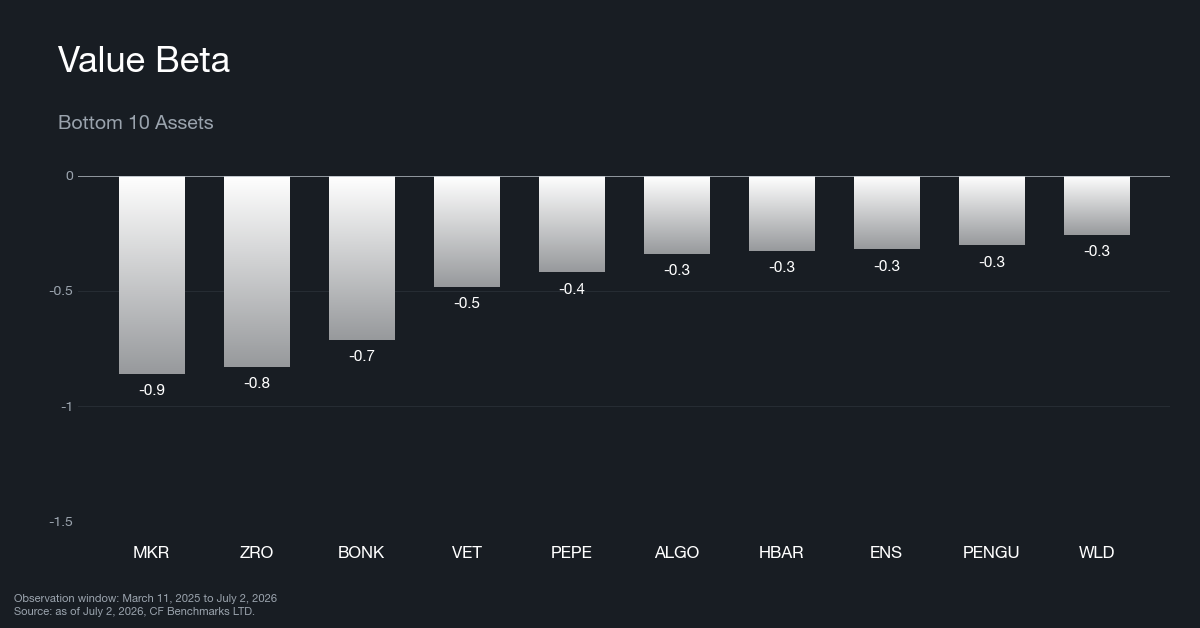
High value-beta assets continue to cluster in storage and compute networks, blue-chip DeFi protocols, and launchpad tokens - names generating meaningful economic output relative to their market capitalizations. A derivatives-exchange token entered the top 10 this week as a modular data-availability token exited, and a launchpad token's value beta rose notably, signs that fee-generating protocols are consolidating their hold on the high-value cohort. The low value-beta group remains dominated by meme and governance tokens priced well above current fundamentals, with the same cross-chain messaging token that tops the market-beta list also entering the value bottom 10 - high beta, low fundamental backing. Value returned +1.42% on the week, the only positive style factor, and leads all factors over four weeks at +3.67%. After spending most of the year negative, fundamental valuation is showing its most persistent stretch of outperformance this cycle.
Momentum
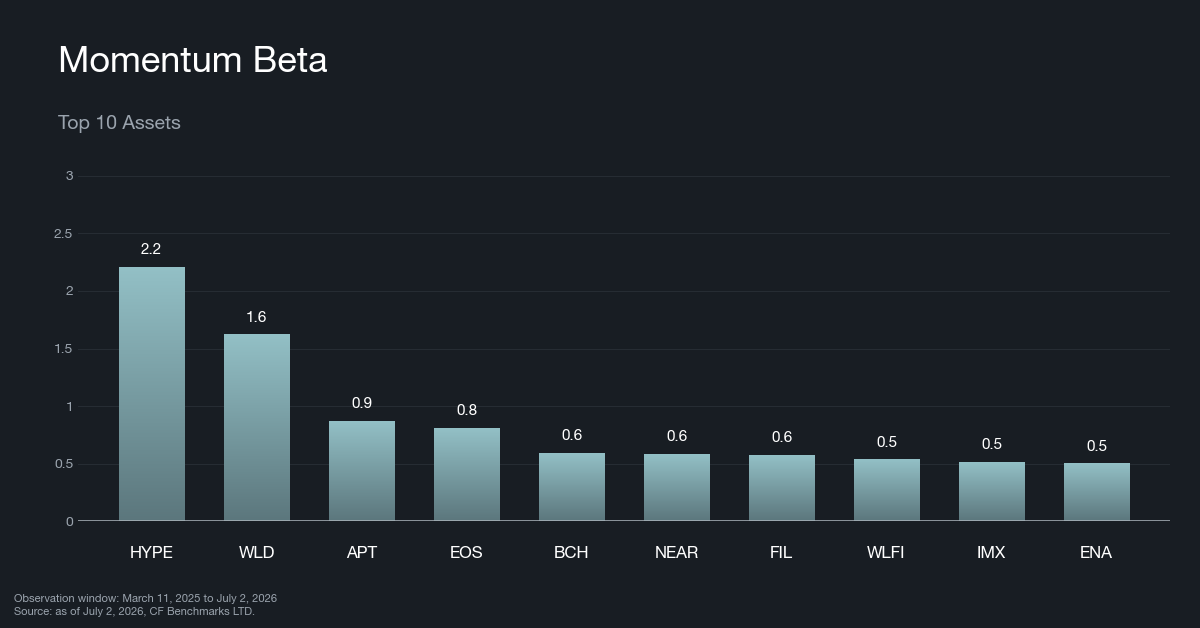
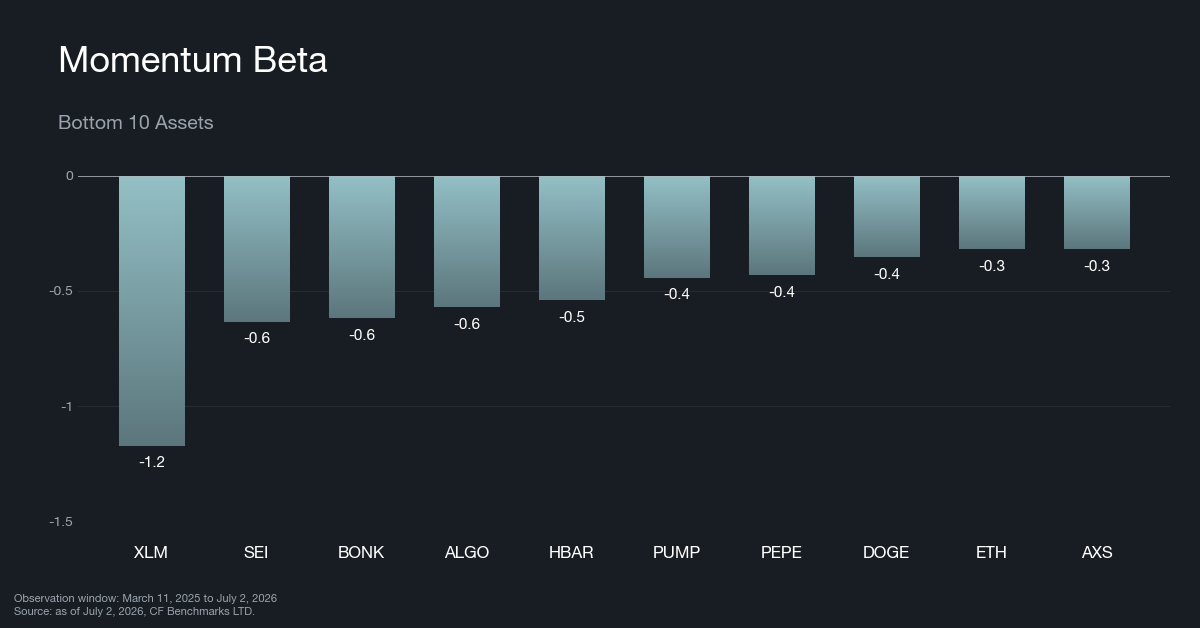
The high momentum-beta cohort spans this cycle's trend leaders across select layer-1s, storage names, and payment chains, and the same derivatives-exchange token that entered the value top 10 also debuted at the top of the momentum list with a beta above 2.2 - a name now carrying both strong trend and strong fundamentals. A synthetic-dollar protocol token also rotated in, while a gaming token and an enterprise middleware name dropped out. The low end remains anchored by assets in sustained downtrends, dominated by meme coins and older payment networks, and Ether remains in the bottom 10 for a second consecutive week - continued evidence that recent price weakness has kept even a core asset in the low-momentum group. Momentum itself fell -0.83% on the week despite the market rebound, and it remains negative on every longer horizon, reinforcing that trend-following has yet to find traction in this market.
What Factors are Driving Markets
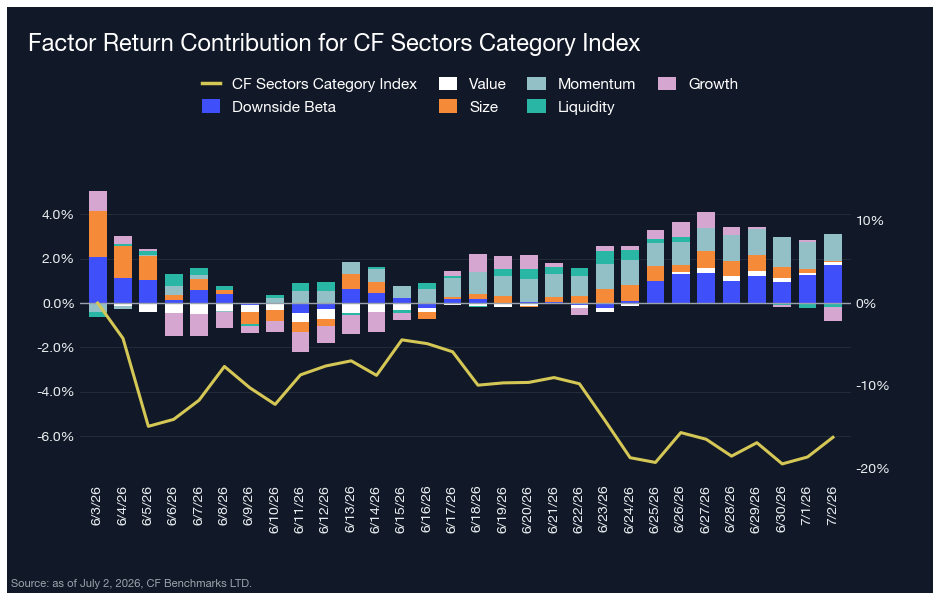
Factor contributions across the CF DACS Sectors universe sum to roughly +2.3% over the trailing 30 days, while the Sectors index fell -16.2% over the same window, a gap of about 19 percentage points - down from roughly 28 points last week as the index recovered. The composition of factor contribution shifted sharply: Downside Beta was the dominant contributor at +1.7% and Momentum added +1.2%, while Growth, last week's leading contributor, flipped to the largest drag at -0.6%. Systematic factor tilts continued to preserve value relative to passive Sectors exposure, but the narrowing gap shows the rebound lifting the index faster than the factor sleeve.
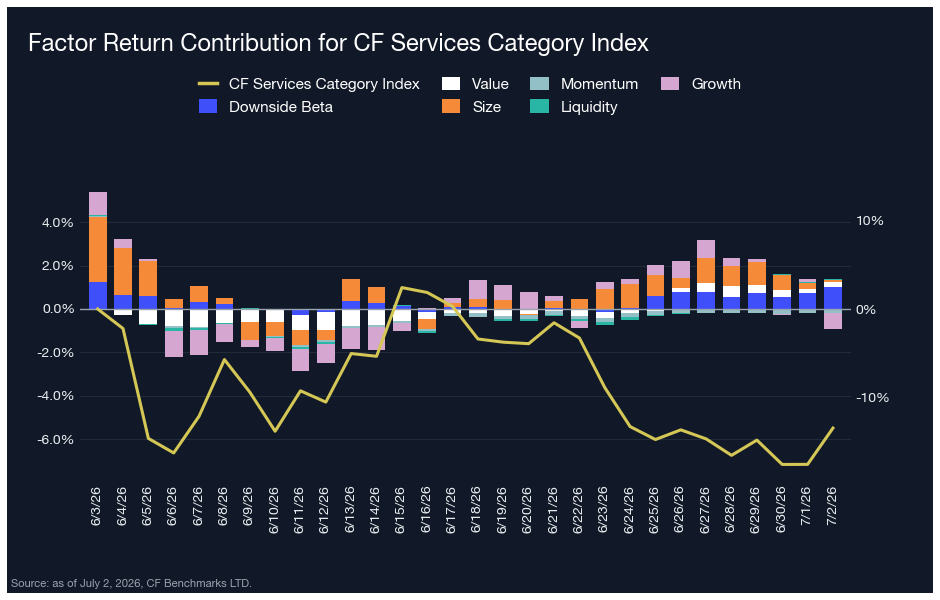
In the CF DACS Services universe, factor contributions total approximately +0.5% over 30 days against a Services index return of -13.4%, a gap of roughly 14 percentage points, narrower than last week's 19. Downside Beta was the primary contributor at +1.0% with Value adding +0.2%, while Growth swung from last week's +2.4% contribution to a -0.7% drag - the same reversal seen in Sectors. Factor-driven performance again exceeded passive index returns, though by a thinner margin as the rally compressed cross-sectional dispersion.
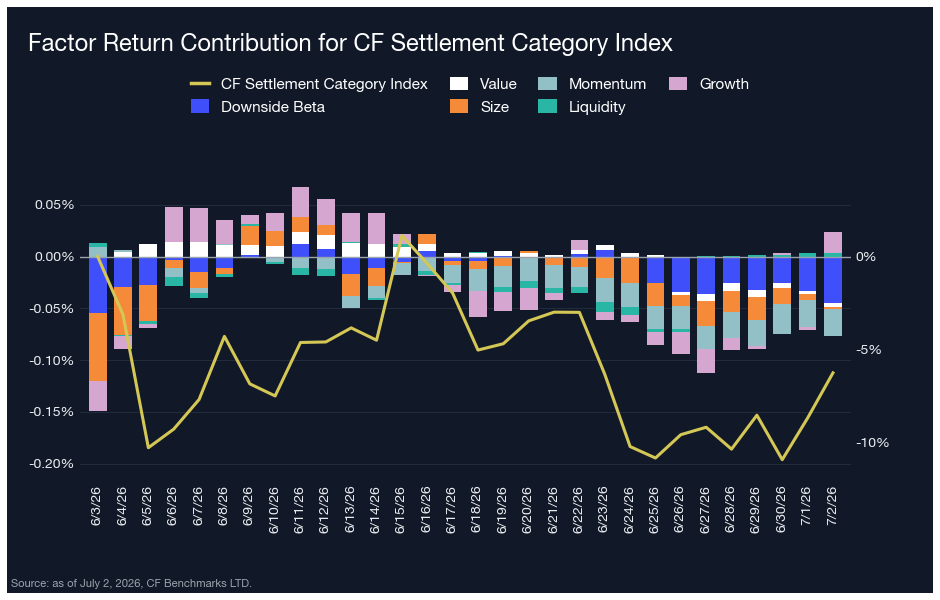
The Settlement universe, dominated by Bitcoin and core settlement-layer assets, continues to tell a different story. Factor contributions net to roughly -0.1% over the trailing 30 days while the Settlement index declined -6.3%, a gap of about 6 percentage points - far narrower than last week's 21 as the index recouped much of its drawdown. The negligible factor contribution again confirms that settlement-layer assets are driven primarily by broad market forces rather than cross-sectional style dispersion. Settlement remains a macro story, not a factor story, and this week the macro turned favorable.
Appendix: CF Factor Methodology
Market Factor
The market factor captures the broad, systematic risk that permeates the digital asset ecosystem. It reflects aggregate influences such as macroeconomic conditions, investor sentiment, and overall market volatility. As such, this factor is defined by the daily returns of the CF Broad Cap (Free Float Market Cap Weight) Index, offering a comprehensive and capitalization-weighted representation of the asset class.
Size Factor
The size factor captures the return differential associated with asset scale, reflecting the hypothesis that smaller-cap digital assets tend to outperform their larger-cap counterparts. This effect is understood to compensate for elevated operational and financial risks while exploiting potential market inefficiencies. In this framework, the size factor is defined by each asset’s fully diluted market capitalization. The value is sign-inverted so that higher z-scores are assigned to smaller assets and vice-versa.
Value Factor
The value factor reflects a protocol’s ability to generate economic output relative to its capital base and market valuation, combining measures of both efficiency and user engagement. It is constructed as the average z-score of two key ratios: transaction fees relative to total value locked (Fees/TVL) and daily active users relative to market capitalization (DAU/MCap). This composite metric captures how productively a protocol utilizes its resources while also serving as a proxy for user-driven demand. A higher combined score indicates efficient resource utilization and strong user engagement.
Momentum Factor
The momentum factor captures short-term price persistence by identifying assets that have recently exhibited strong performance. It is computed as the average z-score of two metrics: the 2 weeks cumulative performance and the 2 weeks risk-adjusted cumulative performance. This approach aligns with established findings in traditional financial literature and demonstrates empirical relevance in digital assets, where price trends tend to exhibit momentum over short horizons.
Growth Factor
The growth factor captures the expansion of a protocol’s network activity and user adoption. In the context of digital assets, it reflects metrics such as fee generation and user engagement, which serve as indicators of increased platform utilization and operational scale. The factor is defined as the average z-score of 30-day fee growth and 30-day weekly active user growth, thereby identifying assets exhibiting consistent and measurable increases in underlying network usage.
Downside Beta
The downside beta factor captures an asset’s sensitivity to adverse market conditions by isolating its behavior during periods of negative market returns. Empirical evidence shows that assets with lower downside beta tend to outperform their higher-beta counterparts over the long-term, due to their reduced participation in market drawdowns and more stable return profiles during periods of elevated volatility. As such, it is estimated through a regression of the asset’s daily returns over the most recent four-week period against market returns observed exclusively during negative sessions. The resulting value is sign-inverted to ensure that assets with lower downside exposure are assigned higher z-scores.
Liquidity Factor
The liquidity factor captures the ease with which a digital asset can be traded without significantly impacting its price. Empirical evidence shows that illiquid assets tend to command a higher risk premium than their more liquid counterparts, serving as compensation for trading friction and price volatility. To quantify this, the factor is measured using token turnover, defined as trading volume as a percentage of circulating supply. The value is sign-inverted such that higher z-scores are assigned to less liquid assets.
For further detail, view the CF Factors Methodology Document, the CF Factor Data Suite, and Our paper “A Factor Model for Digital Assets” in Springer Nature’s Mathematical Research for Blockchain Economy
The information contained within is for educational and informational purposes ONLY. It is not intended nor should it be considered an invitation or inducement to buy or sell any of the underlying instruments cited including but not limited to cryptoassets, financial instruments or any instruments that reference any index provided by CF Benchmarks Ltd. This communication is not intended to persuade or incite you to buy or sell security or securities noted within. Any commentary provided is the opinion of the author and should not be considered a personalised recommendation. Please contact your financial adviser or professional before making an investment decision.
Note: Some of the underlying instruments cited within this material may be restricted to certain customer categories in certain jurisdictions.
Factor Friday - July 24, 2026
Beta's four-week grind higher stalled this week as style leadership rotated again: Momentum took the top spot, last week's leader Value fell to the bottom, and Growth stayed July's weakest factor. Size remains the only style factor positive on the year; beta, not style selection, is setting returns.

Mark Pilipczuk
Changes to the Token Market Price Benchmarks Series - Market Prices – 21 July 2026
The Administrator has confirmed changes to the Token Market Price Family for the period 14 July 2026 to 21 July 2026.
CF Benchmarks
Softer CPI Reprices July Hike Risk & Lifts Digital Assets
Digital assets extended their recovery over the past week as cooler US inflation prints repriced Fed expectations; the bid was broad across the large cap indices, growth factor leadership returned, stablecoin funding repriced lower, and stress stayed isolated in names hit by token-specific news.
Mark Pilipczuk
By clicking Accept, you consent to CF Benchmarks's use of cookies.
Visit Cookie Settings to learn how CF Benchmarks uses cookies and to adjust your preferences.