
Jun 02, 2025
ETF Inflows Lift Bitcoin as New Tax Bill Lifts Spending
Key takeaways for the month
- Bitcoin Hits $112K as Washington Hits the Spending Button: Bitcoin surged to a new all-time high of $112,000, buoyed by strong ETF inflows and improving macro sentiment. The launch of CME's regulated XRP futures expanded institutional access to crypto markets. Spot Bitcoin ETFs, led by BlackRock's IBIT, saw robust capital inflows (+$6.7B), though momentum slowed by month's end. Easing trade tensions supported risk assets, though uncertainty persisted amid new developments on U.S. tariffs, as the Trump administration agreed to temporarily reduce tariffs on China. Meanwhile, a sweeping tax-and-spend bill passed in the House of Representatives, sparking debate over deficit expansion and its potential long-term economic implications for fiscal stability.
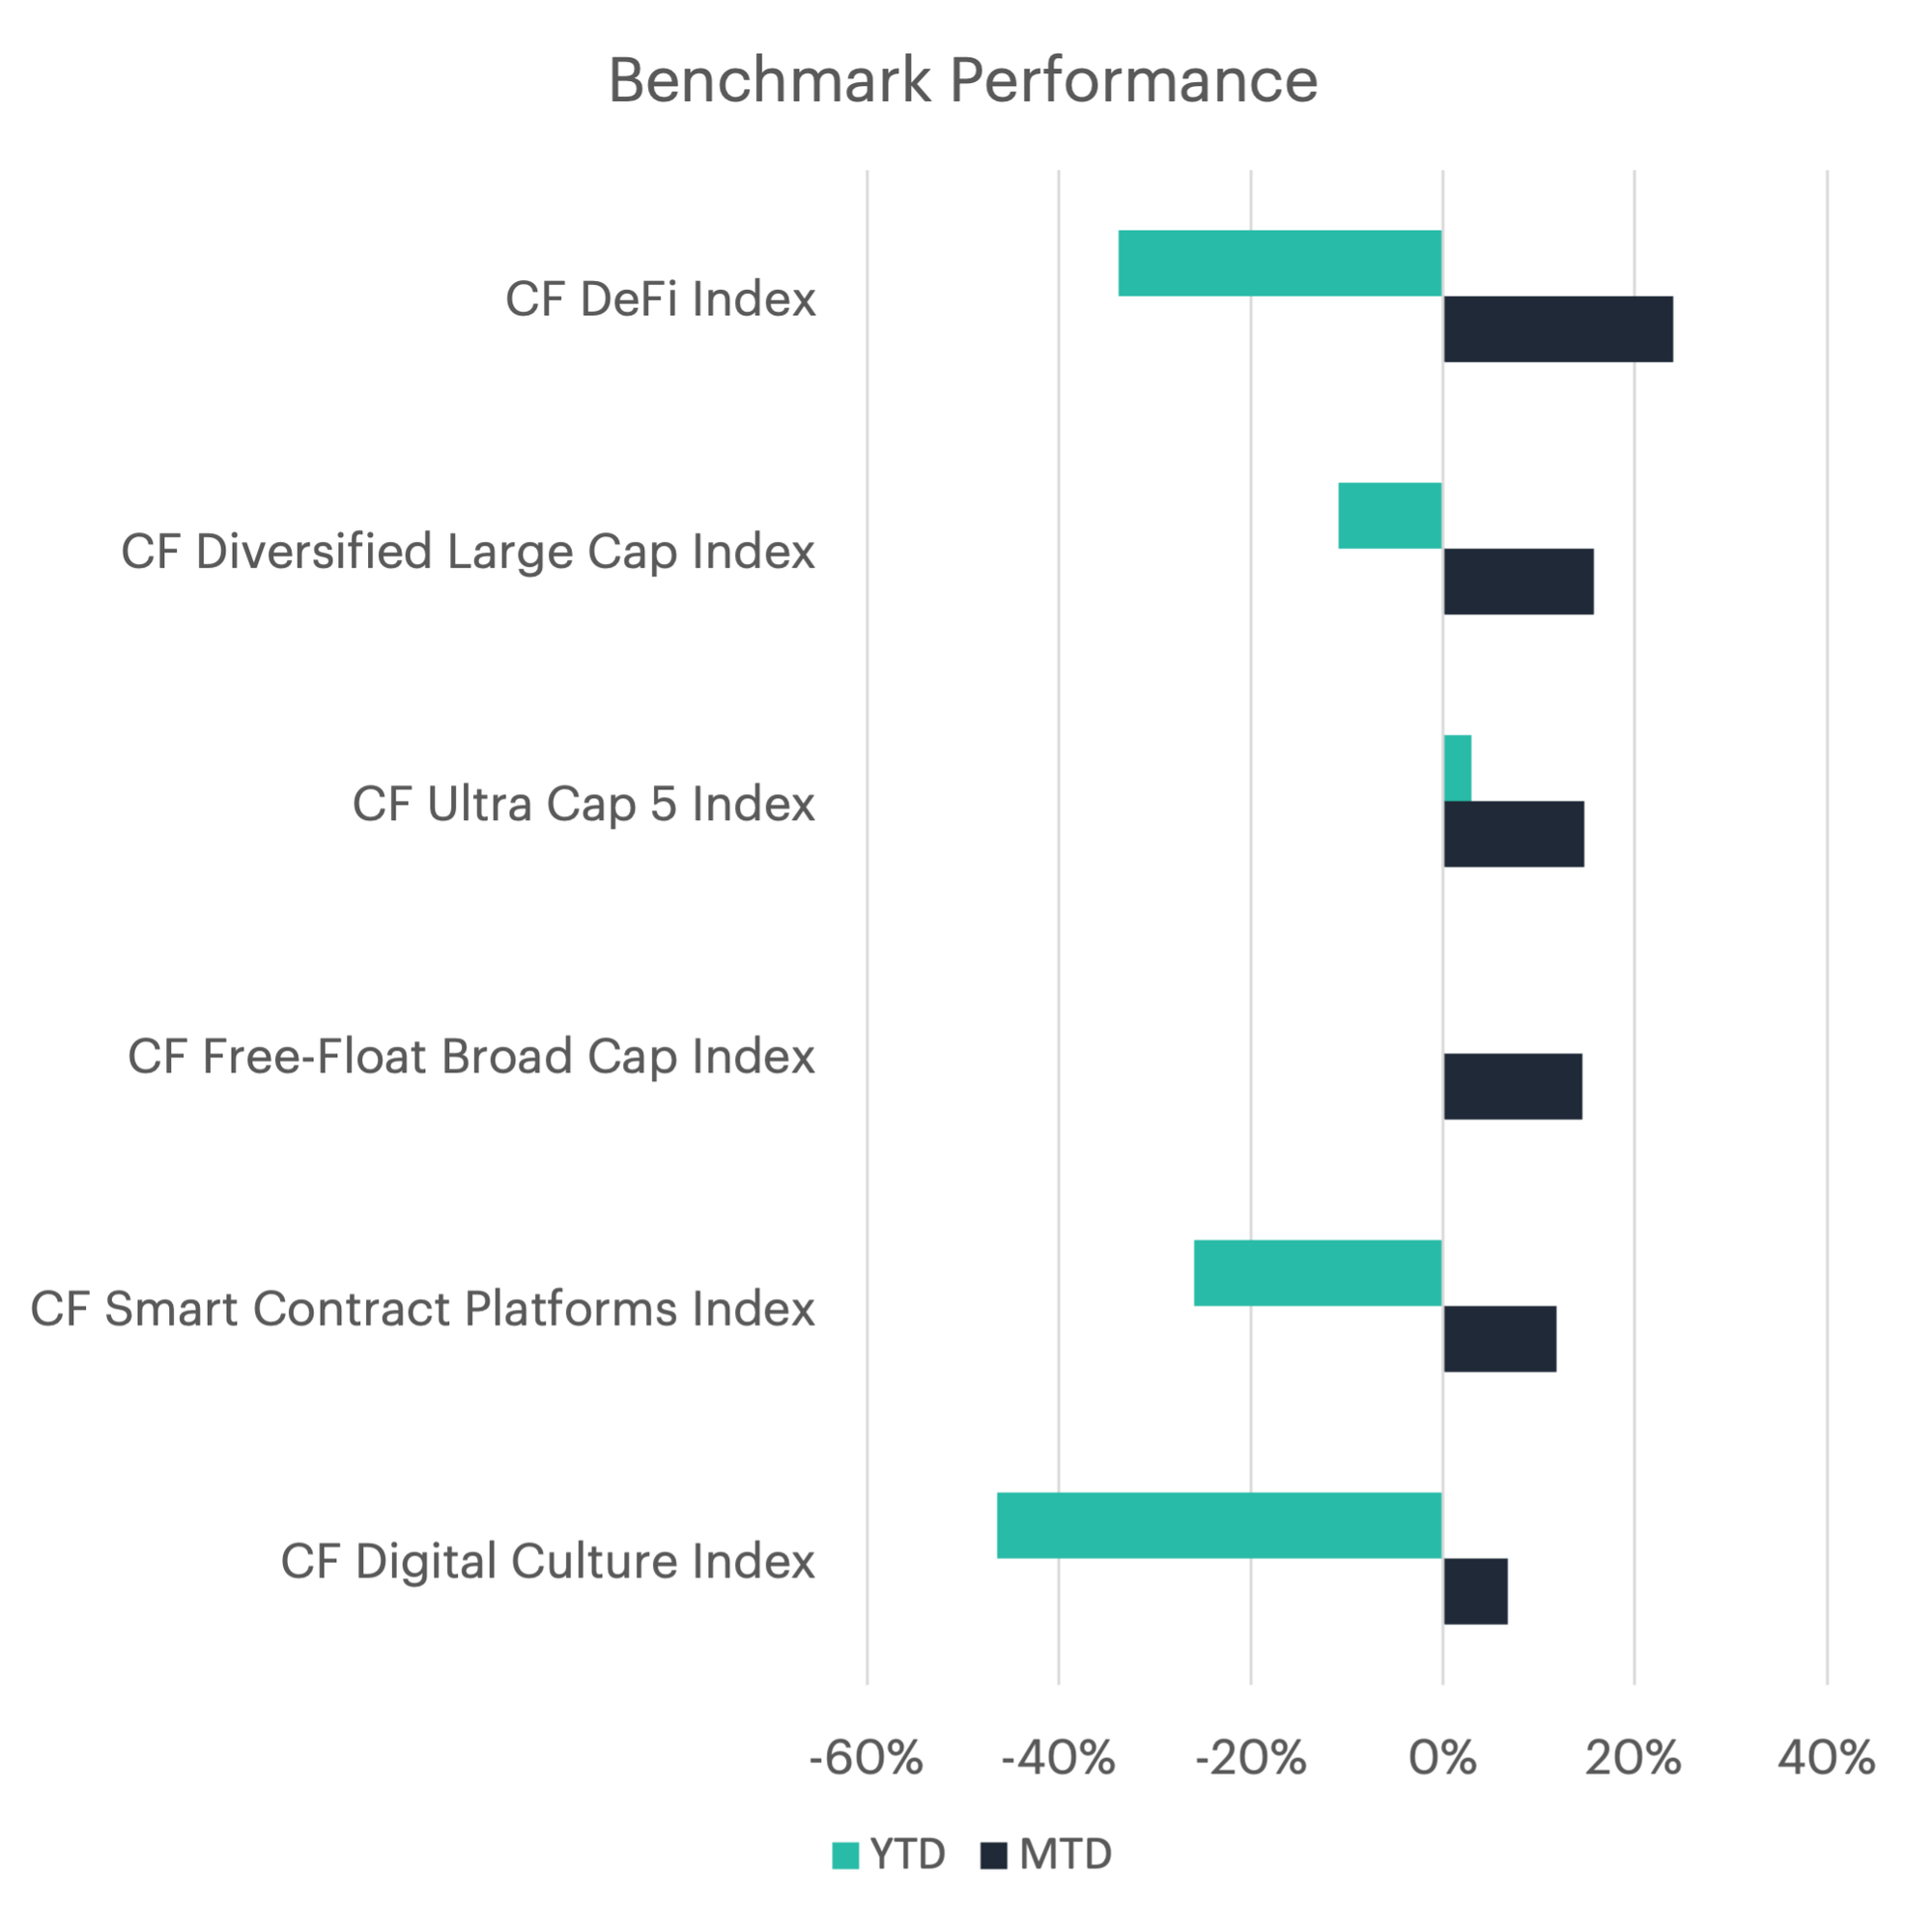
- DeFi Dominates While Large Caps Deliver: The CF DeFi Index led returns, surging 23.99% month-to-date despite remaining down 33.83% year-to-date. The CF Diversified Large Cap Index followed, gaining 15.69% (YTD -10.86%), while the CF Ultra Cap 5 Index rose 14.76% (YTD +3.01%). The CF Free-Float Broad Cap Index added 14.49% (YTD -0.07%), and the CF Smart Contract Platforms Index increased 11.79% (YTD -25.96%). Sector-specific indices posted mixed results, with the CF Digital Culture Index rising 6.80% (YTD -46.41%). Investor preference continued to lean toward large-cap and blue-chip assets over speculative segments, with CF Ultra Cap 5 alone showing definitive YTD gains.
- Aave Surges & Ether Emerges: Aave rallied 49.7% in May as adoption of its GHO stablecoin accelerated. Ether followed with a 41.7% jump, buoyed by the Pectra upgrade in early May. Bitcoin Cash added 14.1%, supported by anticipation of its virtual machine upgrade, which expands smart contract capacity, and spillover interest from Bitcoin's latest all-time-high rally. Fantom sank 21.4% despite its Sonic mainnet upgrade going live in May, while Decentraland slid 13.3% as interest in the metaverse continued to fade. Algorand and Polygon retreated 11.1% and 9.0%, respectively, following their own network upgrades, suggesting that investors chose to "sell the news" on these tokens.
- Fund Inflows Jump: May saw continued inflows into digital asset funds, with investors allocating approximately $6.7 billion. Bitcoin accounted for $5.7 billion of that total, while Ethereum attracted an impressive $896 million. From a regional perspective, fund inflows were concentrated in North America, which saw a net inflow of approximately $8.3 billion. Meanwhile, Asia Pacific attracted capital for the first time in 2025, recording inflows of around $145 million for the month.
- CME Ethereum Open Interest Explodes: Net sentiment positioning in Bitcoin declined, with short positions outpacing longs. As a result, net futures positioning on the CME fell to -475 contracts, down from -247. Total open interest in CME Ether futures increased sharply, rising 71.2% from the previous month and marking a new all-time high. Meanwhile, open interest in Bitcoin futures grew by 18.5% month over month.
- Hash Rate Rises Sharply, Putting Pressure on Miners: Bitcoin's average monthly hash rate grew in May, increasing by 1.6% to 722 exahashes per second. Mining difficulty, which measures the computational effort required to mine a new block and adjusts to maintain consistent block creation times, increased by 3.0% over the month. The next difficulty adjustment is expected in the second week of June and is currently trending toward a 5.4% decrease. Bitcoin miners saw a 27.7% increase in mining revenue. Of the total rewards earned during the month, 1.3% came from transaction fees, staying flat from 1.3% in April. The growth in revenue was driven entirely by Bitcoin's price appreciation during the month.
- Fee Frenzy Continues: Total fees paid on the Solana network grew by 90.1% from the previous month, reaching $39.9 million. MEV accounted for approximately 41.5% of total fees, reflecting increased demand for block space amid rising network activity. Meanwhile, total fees paid on the Ethereum network increased by 68.5% compared to the previous month, reaching $30.2 million. While overall fees rose, a 69.5% increase in the average fee per interaction suggests that transaction demand slightly outpaced available block space.
To read the complete report, kindly click on the provided link (or click here to view a PDF version). Additionally, please do not forget to subscribe to our latest news and research for the most relevant institutional insights on digital assets and the top digital assets by market cap.
The information contained within is for educational and informational purposes ONLY. It is not intended nor should it be considered an invitation or inducement to buy or sell any of the underlying instruments cited including but not limited to cryptoassets, financial instruments or any instruments that reference any index provided by CF Benchmarks Ltd. This communication is not intended to persuade or incite you to buy or sell security or securities noted within. Any commentary provided is the opinion of the author and should not be considered a personalised recommendation. Please contact your financial adviser or professional before making an investment decision.
Note: Some of the underlying instruments cited within this material may be restricted to certain customer categories in certain jurisdictions.
Factor Friday - July 10, 2026
The relief rally extended for a second week with Market +2.27%, but the real story is risk appetite: Liquidity led styles at +1.51% as thinner, less liquid names caught a bid. Value paused at -0.79% yet still leads over four weeks. Defensive tilts kept unwinding into the bounce.

Mark Pilipczuk
2026 Mid-Year Market Outlook
Iran risk, regulatory policy, Bitcoin rebalancing, tokenization, and protocol revenue are reshaping the outlook. Growth is narrowing, but regulatory progress and productive on-chain activity create offsets. Dispersion, not broad beta, should define the next year.
Gabriel Selby
Changes to the Token Market Price Benchmarks Series - Market Prices – 07 July 2026
The Administrator has confirmed changes to the Token Market Price Family for the period 30 June 2026 to 07 July 2026.
CF Benchmarks
By clicking Accept, you consent to CF Benchmarks's use of cookies.
Visit Cookie Settings to learn how CF Benchmarks uses cookies and to adjust your preferences.