
May 04, 2026
Weekly Index Highlights, May, 4, 2026
Market Performance Update
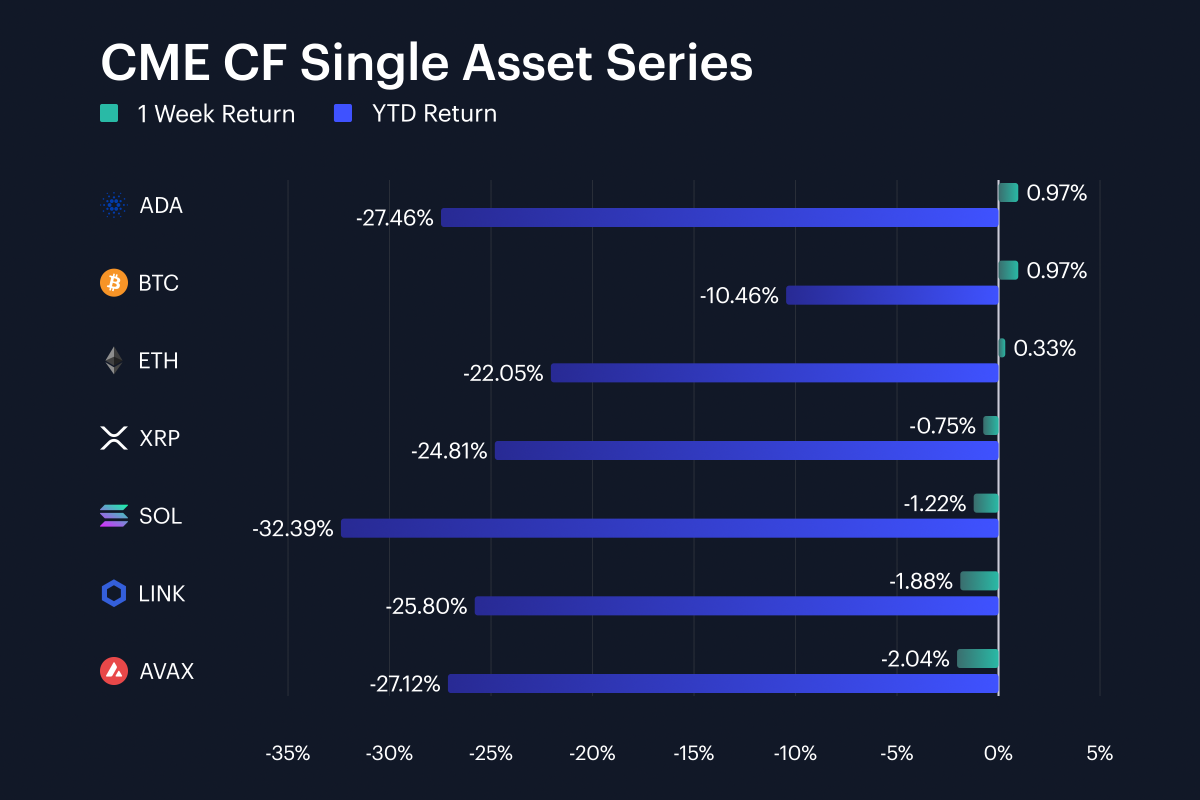
There was a mixed extension of gains into a third straight week across large and mega-cap digital assets, with Bitcoin adding 1.0% week-on-week (w/w), taking its year-to-date return to -10.5%, while Ether added 0.3% w/w, and so largely holding steady on a YTD basis at -22.0%. Cardano also gained 1.0% w/w, but the rest of the CME CF Single Asset Series posted a negative week: XRP fell 0.7%, Solana was -1.2%, Chainlink -1.9%, and Avalanche -2.0%. The weekly range of -2.0% to +1.0%, a 3.0 percentage point (pp) band, was far narrower than the prior week’s +0.2% to +3.6% positive spread. That combination leaves the tape firmer at the top of the market, with BTC and ADA carrying the positive side, and performance still uneven across higher-beta large assets. The YTD picture remains weak: every name in the set is down at least -10.5% for 2026, and Solana’s -32.4% YTD return is the deepest drawdown in the group. Avalanche and Cardano also remain down more than -27% YTD, so the week’s gains did little to repair the current poor showing for 2026 overall.
Volatility Analysis
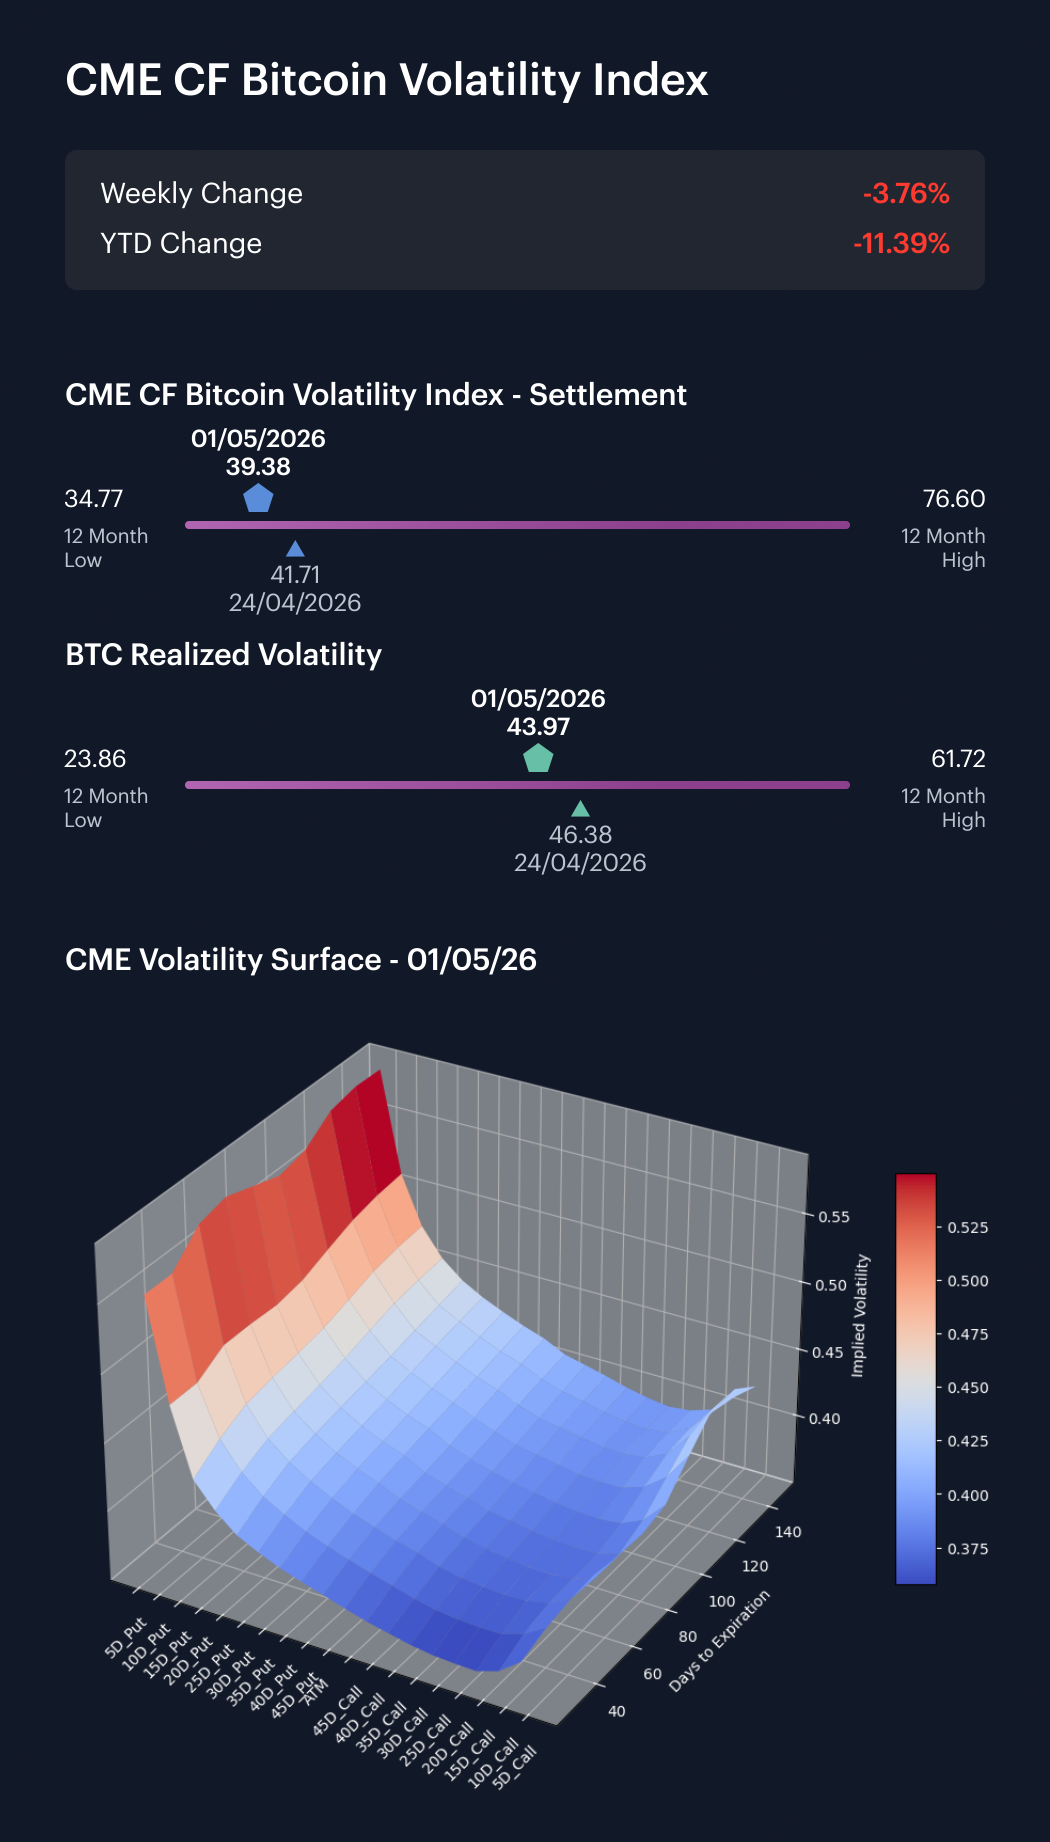
Bitcoin implied volatility softened further over the recent week, while realized volatility remained above implied by the close of the business week on Friday, May 1st. The CME CF Bitcoin Volatility Index – Settlement (BVXS) moved from 41.71 on April 24th to 39.38 on May 1st, a -2.33 vol. point change, after opening on the Monday at 40.92. Realized volatility moved from 46.38 to 43.97 over the same Friday-to-Friday window, a -2.41 vol point change, after opening on Monday April 27th at 42.23. The implied-realized spread was thus -4.59 vol. points on May 1st, close to the -4.67 vol. point spread one week earlier. During the business week itself, realized rose 1.74 vol. points from 42.23 to 43.97, while BVXS fell 1.54 vol. points from 40.92 to 39.38. That left spot price behavior looking more volatile than the options-implied settlement measure at the end of the week. Realized volatility also remained 20.11 vol. points above its 12-month low of 23.86, so this latest weekly easing of BVXS has not structurally returned Bitcoin to a low-volatility regime.
Market Cap Index Performance
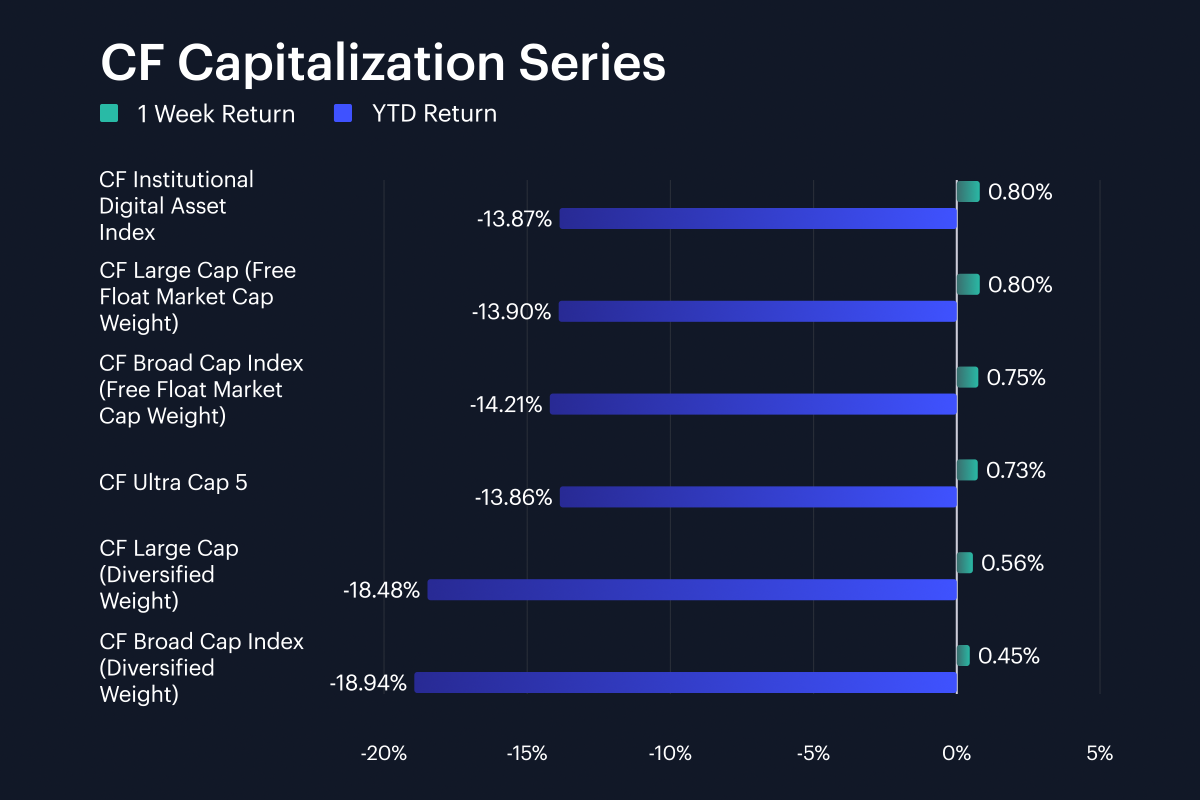
The CF Capitalization indices finished the week in a tight positive band, with returns between +0.45% and +0.80% w/w. CF Large Cap (Free Float Market Cap Weight) led at +0.80% w/w, approximately level with the CF Institutional Digital Asset Index, also at +0.80% on a rounded basis. The CF Broad Cap Index (Free Float Market Cap Weight) returned +0.75%, and CF Ultra Cap 5 added +0.73%. Diversified-weight exposure lagged by a small margin: CF Large Cap (Diversified Weight) gained +0.56%, while CF Broad Cap Index (Diversified Weight) rose +0.45%. The spread between the strongest and weakest capitalization index was only 0.35 percentage points, so size tiering did little to separate outcomes this week. YTD returns stayed negative across the complex, from -13.9% for CF Ultra Cap 5 to -18.9% for CF Broad Cap Index (Diversified Weight), which keeps the weekly rebound inside a still-negative 2026 return profile. The gap between Broad Cap (Diversified) and Broad Cap (Free Float) was 0.31 percentage points, pointing to a mild penalty for breadth.
Factor Analysis
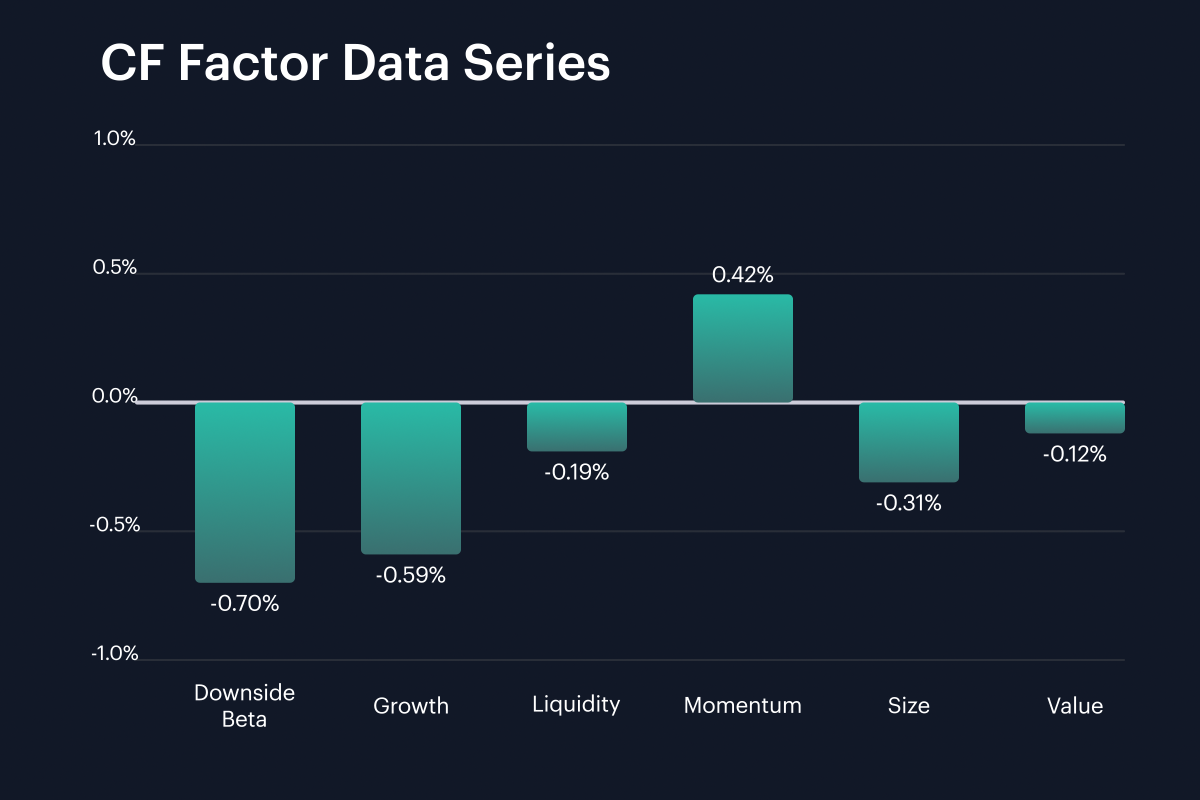
Cumulative factor returns were led by Momentum at +0.42% for the week, while the other five factors closed below zero. Downside Beta finished at -0.70%, Growth at -0.59%, Size at -0.31%, Liquidity at -0.19% and Value at -0.12%. The factor set spanned -0.70% to +0.42%, a 1.11 percentage point range. Compared with the previous week, Downside Beta swung from +0.95% to -0.70%, a -1.64 percentage point move, and Growth moved from +0.65% to -0.59%, a -1.23 percentage point move. Momentum improved from -0.64% to +0.42%, a +1.06 percentage point change. Size moved from +1.08% to -0.31%, which makes it the clearest reversal outside Downside Beta. Liquidity was less negative than the prior week, improving from -0.36% to -0.19%, a +0.17 percentage point move. All told, the factor read-through suggests a narrowing of underlying thematic demand, somewhat contrasting with the week’s pockets of extended gains among large and mega caps.
Read our latest weekly crypto factors report: Factor Friday - May 1, 2026
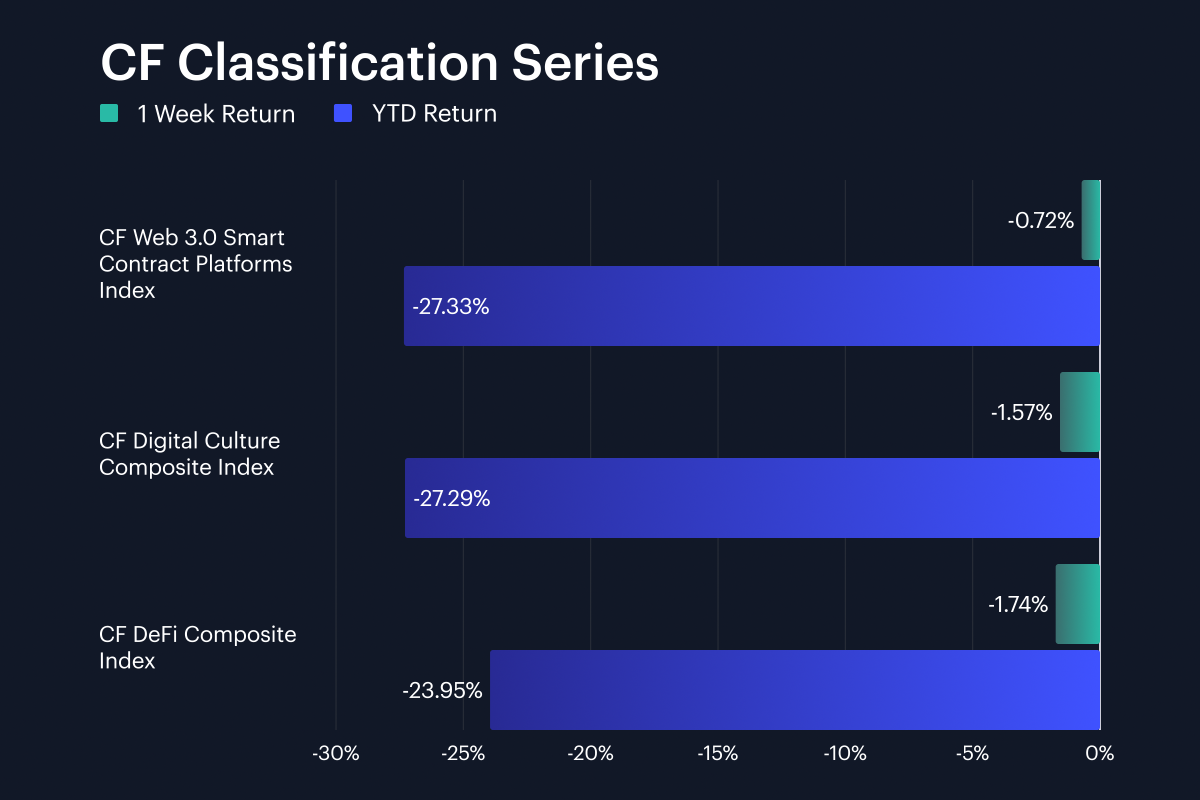
Classification Series Analysis
Across the CF Classification Series, the week showed a clear loss of thematic breadth after the prior week’s positive tape. The CF Web 3.0 Smart Contract Platforms Index returned -0.72% w/w and ended the week at -27.3% YTD. The CF Digital Culture Composite Index returned -1.57% w/w, and also stood at -27.3% YTD, while the CF DeFi Composite Index fell -1.74% w/w and stood at -23.9% YTD. Web 3.0 platforms led the classification set by 0.85 percentage points versus Culture and by 1.02 percentage points versus DeFi, but leadership here was only relative: all three classification indices closed lower on the week. The weekly range of -1.74% to -0.72% shows a negative thematic tape even as BTC, Ether and Cardano were positive in the single-asset table. DeFi’s -1.74% weekly return placed it at the bottom of the three classifications, although its -23.9% YTD return remains less negative than the -27.3% prints for Web 3.0 platforms and Culture. The classification data therefore point to cooling thematic participation, not a continuation of the prior week’s broader advance.
Sector Analysis
Tiered performance across the CF Digital Assets Classification Structure (CF DACS) narrowed after the prior week’s broad gains, with Finance the only positive Sub-Category on average at +0.93% w/w. That positive average was helped by KNC at +19.3%, JTO at +15.0% and ONDO at +5.8%. Utility was the weakest Sub-Category average at -2.49% across six tokens, with BICO down -9.0% and ANKR down -4.6%. Infrastructure was closer to flat at -0.17%, while Culture averaged -0.59%, Non-Programmable -1.47% and Programmable -1.52%. The Sub-Category-average range of -2.49% to +0.93%, or 3.42 percentage points, captures only part of the week’s dispersion though. Culture had APE at +22.5% and CHZ at -18.9% in the same block. Infrastructure had TAO at +14.9% and HNT at -11.2%. This was therefore a narrower, more selective tape across our digital asset universe than the prior week, with token-level dispersion much wider than the headline sector averages. Finance’s 3.42 percentage point lead over Utility was the clearest sector-level signal.
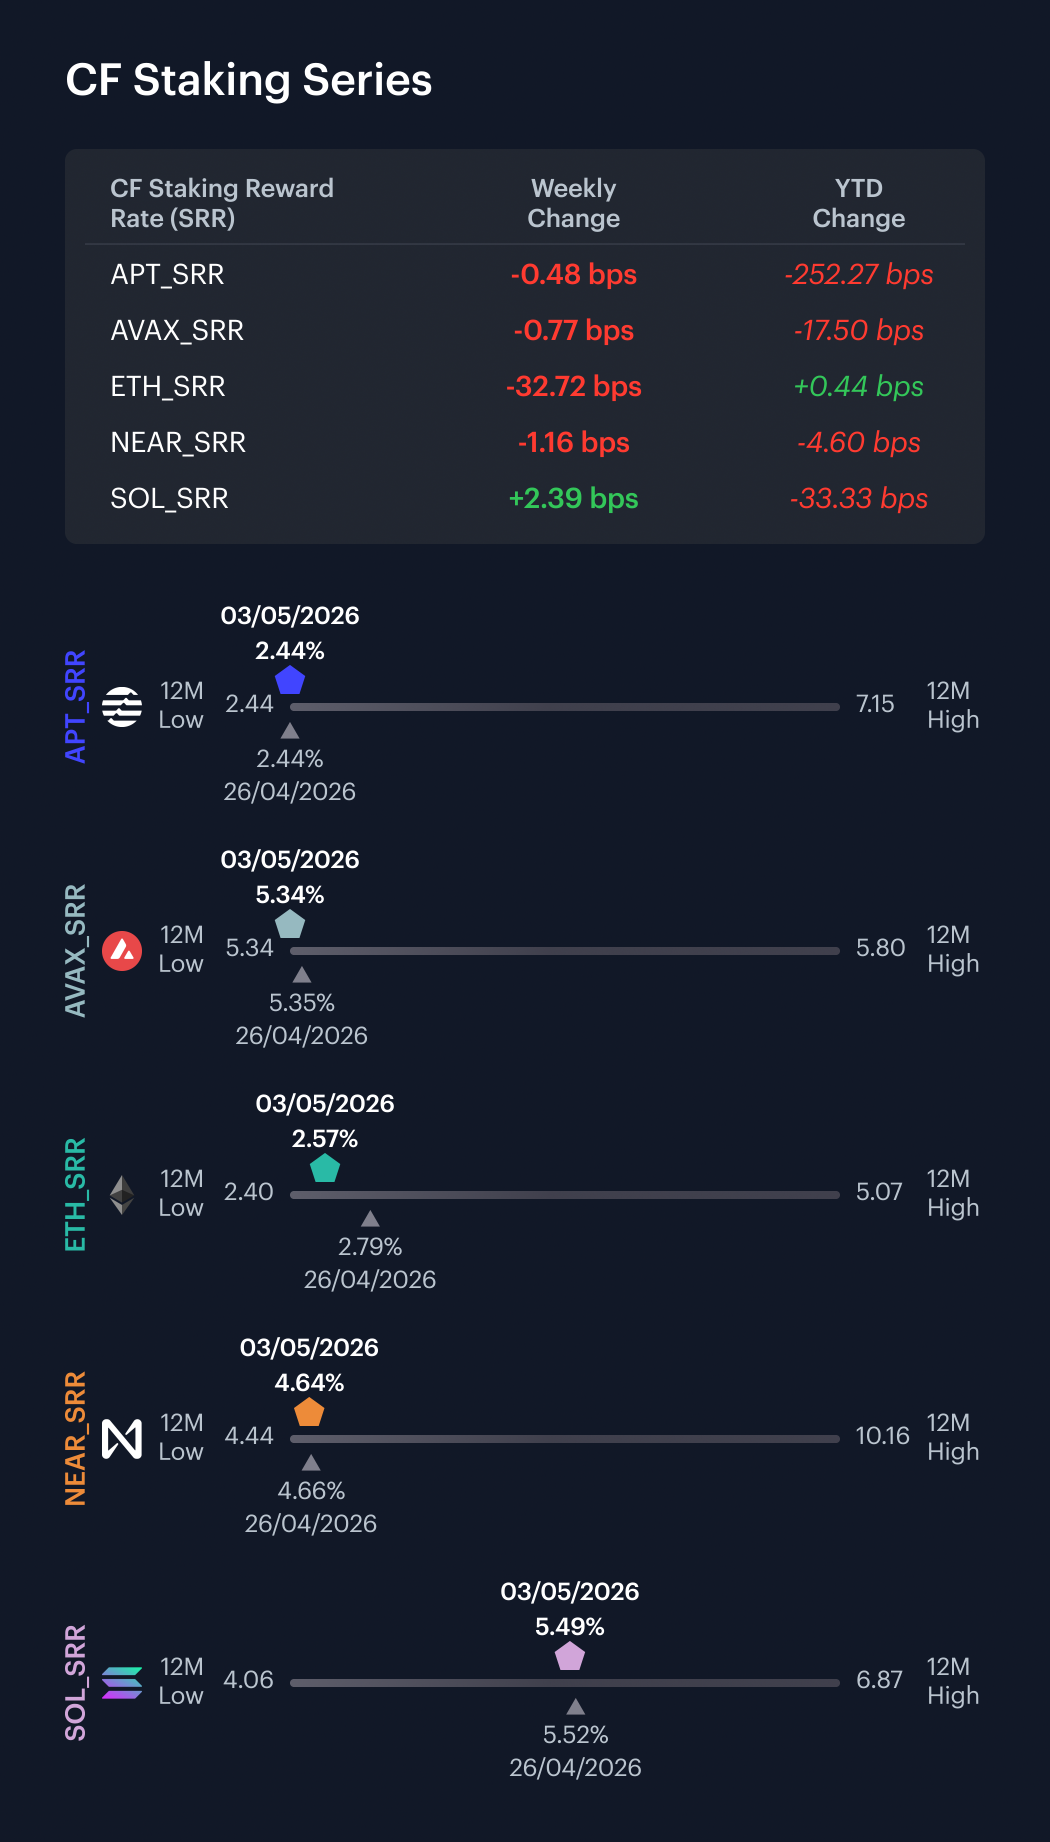
CF Staking Series
Within the CF Staking Series, SOL Staking was the only positive relative change at +0.4% w/w, while AVAX Staking posted a relative change of -0.1%, APT Staking -0.2%, NEAR Staking -0.2% and ETH Staking -11.3%. Between Day 1 and Day 7, ETH's reward rate moved from 2.90% to 2.57%, a -32.72 bps change. APT moved from 2.45% to 2.44%, a -0.48 bps change. AVAX moved from 5.35% to 5.34%, a -0.77 bps change, and NEAR moved from 4.65% to 4.64%, a -1.16 bps change. SOL's reward rate moved from 5.47% at the start of the observed period to 5.49% at the end, a +2.39 bps change. Reward-rate moves ranged from -32.72 bps to +2.39 bps, with ETH accounting for almost all of the rate-side downside. Excluding ETH, the reward-rate band was only -1.16 bps to +2.39 bps, which keeps the rest of the staking set comparatively stable. The -11.3% ETH Staking relative change was also the only double-digit move in the staking change table.
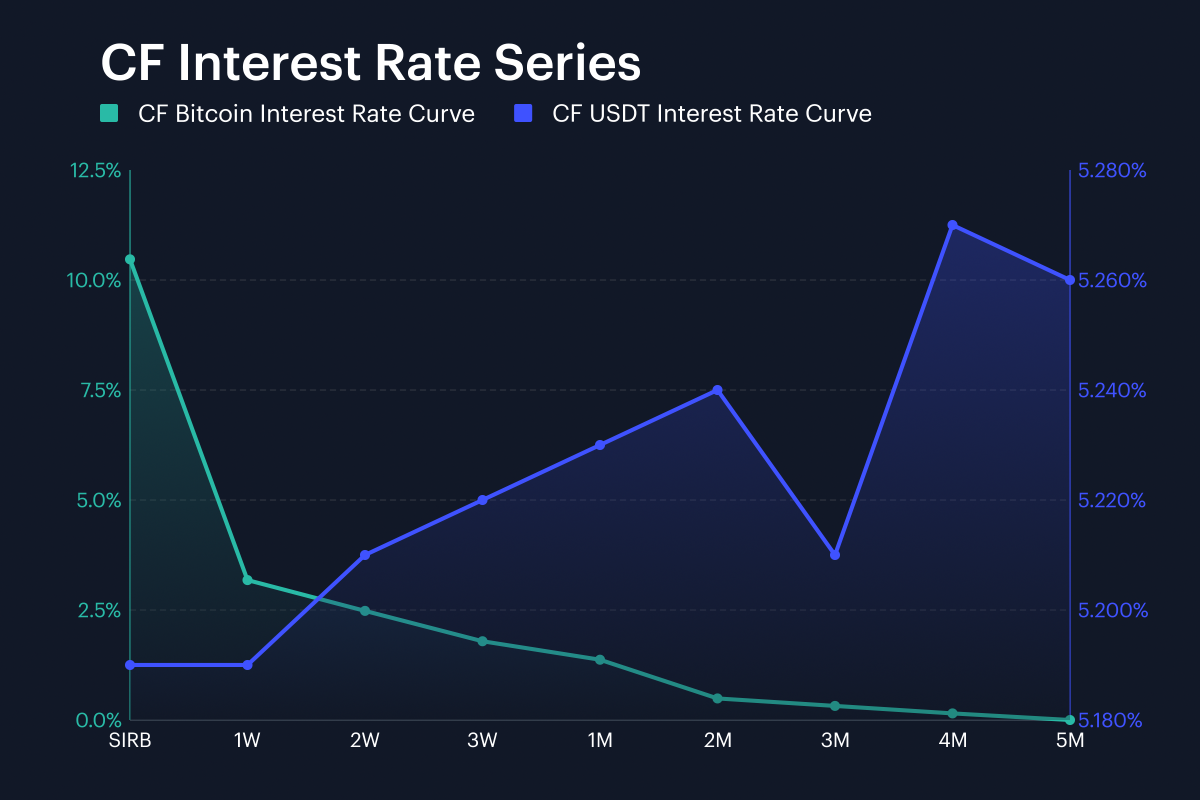
Interest Rate Analysis
Funding conditions across the CF BIRC curves were again split sharply for another week between BTC and USDT. BTC SIRB moved from 0.33% to 10.47%, a +1,013.7 bps jump, while USDT SIRB moved from 11.02% to 5.19%, a -583.0 bps decline. The BTC front end also repriced higher: the 1W tenor moved from 0.65% to 3.18%, a +252.9 bps change, and the 2W tenor moved from 0.65% to 2.48%, a +183.6 bps change. Further out, BTC 3M fell from 0.53% to 0.32%, a -21.1 bps change. USDT compressed across the curve, with 1W down -583.0 bps and 3M down -585.3 bps. Across both curves and all tenors, changes ranged from -585.3 bps to +1,013.7 bps, leaving BTC short-rate pressure much higher and USDT premia materially lower across the listed tenors. The BTC curve also steepened at the very front, with SIRB 10.47 percentage points above the 5M tenor at 0.00%.
The information contained within is for educational and informational purposes ONLY. It is not intended nor should it be considered an invitation or inducement to buy or sell any of the underlying instruments cited including but not limited to cryptoassets, financial instruments or any instruments that reference any index provided by CF Benchmarks Ltd. This communication is not intended to persuade or incite you to buy or sell security or securities noted within. Any commentary provided is the opinion of the author and should not be considered a personalised recommendation. Please contact your financial adviser or professional before making an investment decision.
Note: Some of the underlying instruments cited within this material may be restricted to certain customer categories in certain jurisdictions.
Softer CPI Reprices July Hike Risk & Lifts Digital Assets
Digital assets extended their recovery over the past week as cooler US inflation prints repriced Fed expectations; the bid was broad across the large cap indices, growth factor leadership returned, stablecoin funding repriced lower, and stress stayed isolated in names hit by token-specific news.

Mark Pilipczuk
Notice of the Demising of CF Dai-Dollar Settlement Price and Spot Rate
The Administrator announces that it will demise the CF Dai-Dollar Settlement Price (DAIUSD_RR) and CF Dai-Dollar Spot Rate (DAIUSD_RTI) which are members of the CF Digital Asset Index Family.
CF Benchmarks
Addition of the Tether Gold Settlement Price and Spot Rate to the CF Digital Asset Index Family
The Administrator announces the addition of the Tether Gold Settlement Price and Spot Rate to the CF Digital Asset Index Family - Single Asset Series.
CF Benchmarks
By clicking Accept, you consent to CF Benchmarks's use of cookies.
Visit Cookie Settings to learn how CF Benchmarks uses cookies and to adjust your preferences.