
Sep 02, 2026
Debasement Trade Drives August Rally as Warsh Turns Hawkish
Key takeaways for the month
We read August's rally in digital assets as a debasement trade, not a broad easing in financial conditions. The Treasury doubled the cap on long dated buyback operations to at least $4 billion starting in September, an attempt to steady a bond market that had faced a buyers' strike in longer duration debt since late June. Persistent fiscal deficits and elevated interest costs kept the dollar's long term purchasing power in focus. A weak July payrolls print early in the month supported the case for eventual Fed accommodation, though Chair Warsh's Jackson Hole keynote late in August pushed back on that sentiment, calling inflation the Fed's main problem and leaving the door open to a hike. Demand still strengthened for assets viewed as hedges against monetary and fiscal dilution, and Bitcoin was the primary beneficiary, with spot ETF inflows accelerating to their strongest month of 2026 at $3.4 billion.
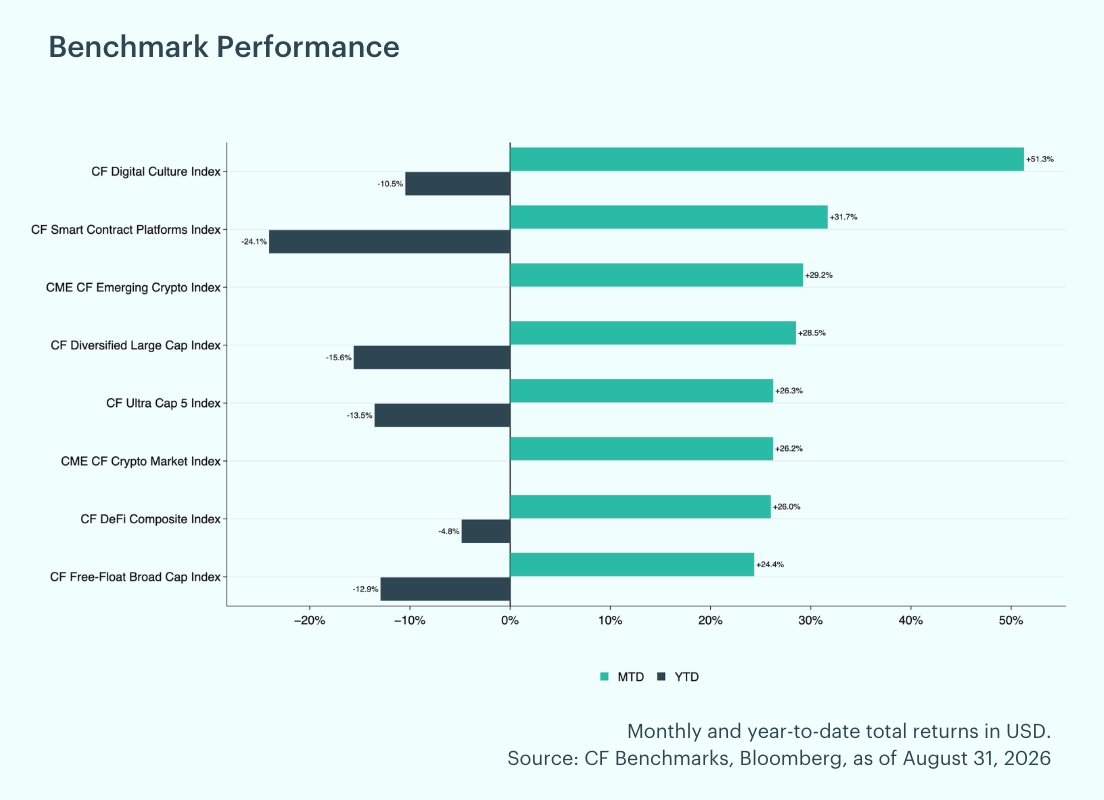
Broad Rally Lifts All Eight Indices Into Double Digits: Last month's price action delivered a broad based advance, with all eight CF Benchmarks indices posting double digit monthly gains. The CF Digital Culture Index led, up 51.3% month to date (MTD), followed by the CF Web 3.0 Smart Contract Platforms Index at 31.7% and the CME CF Emerging Crypto Index at 29.2%. The CF Diversified Large Cap Index added 28.5%, the CF Cryptocurrency Ultra Cap 5 Index and CME CF Crypto Market Index both gained 26.3%, and the CF DeFi Composite Index rose 26.0%, with the CF Free Float Broad Cap Index the laggard at 24.4%. Year to date losses narrowed across the board but persisted, ranging from 4.8% for the CF DeFi Composite Index to 24.1% for the CF Web 3.0 Smart Contract Platforms Index. The two CME CF indices lack a full year of history for a YTD figure.
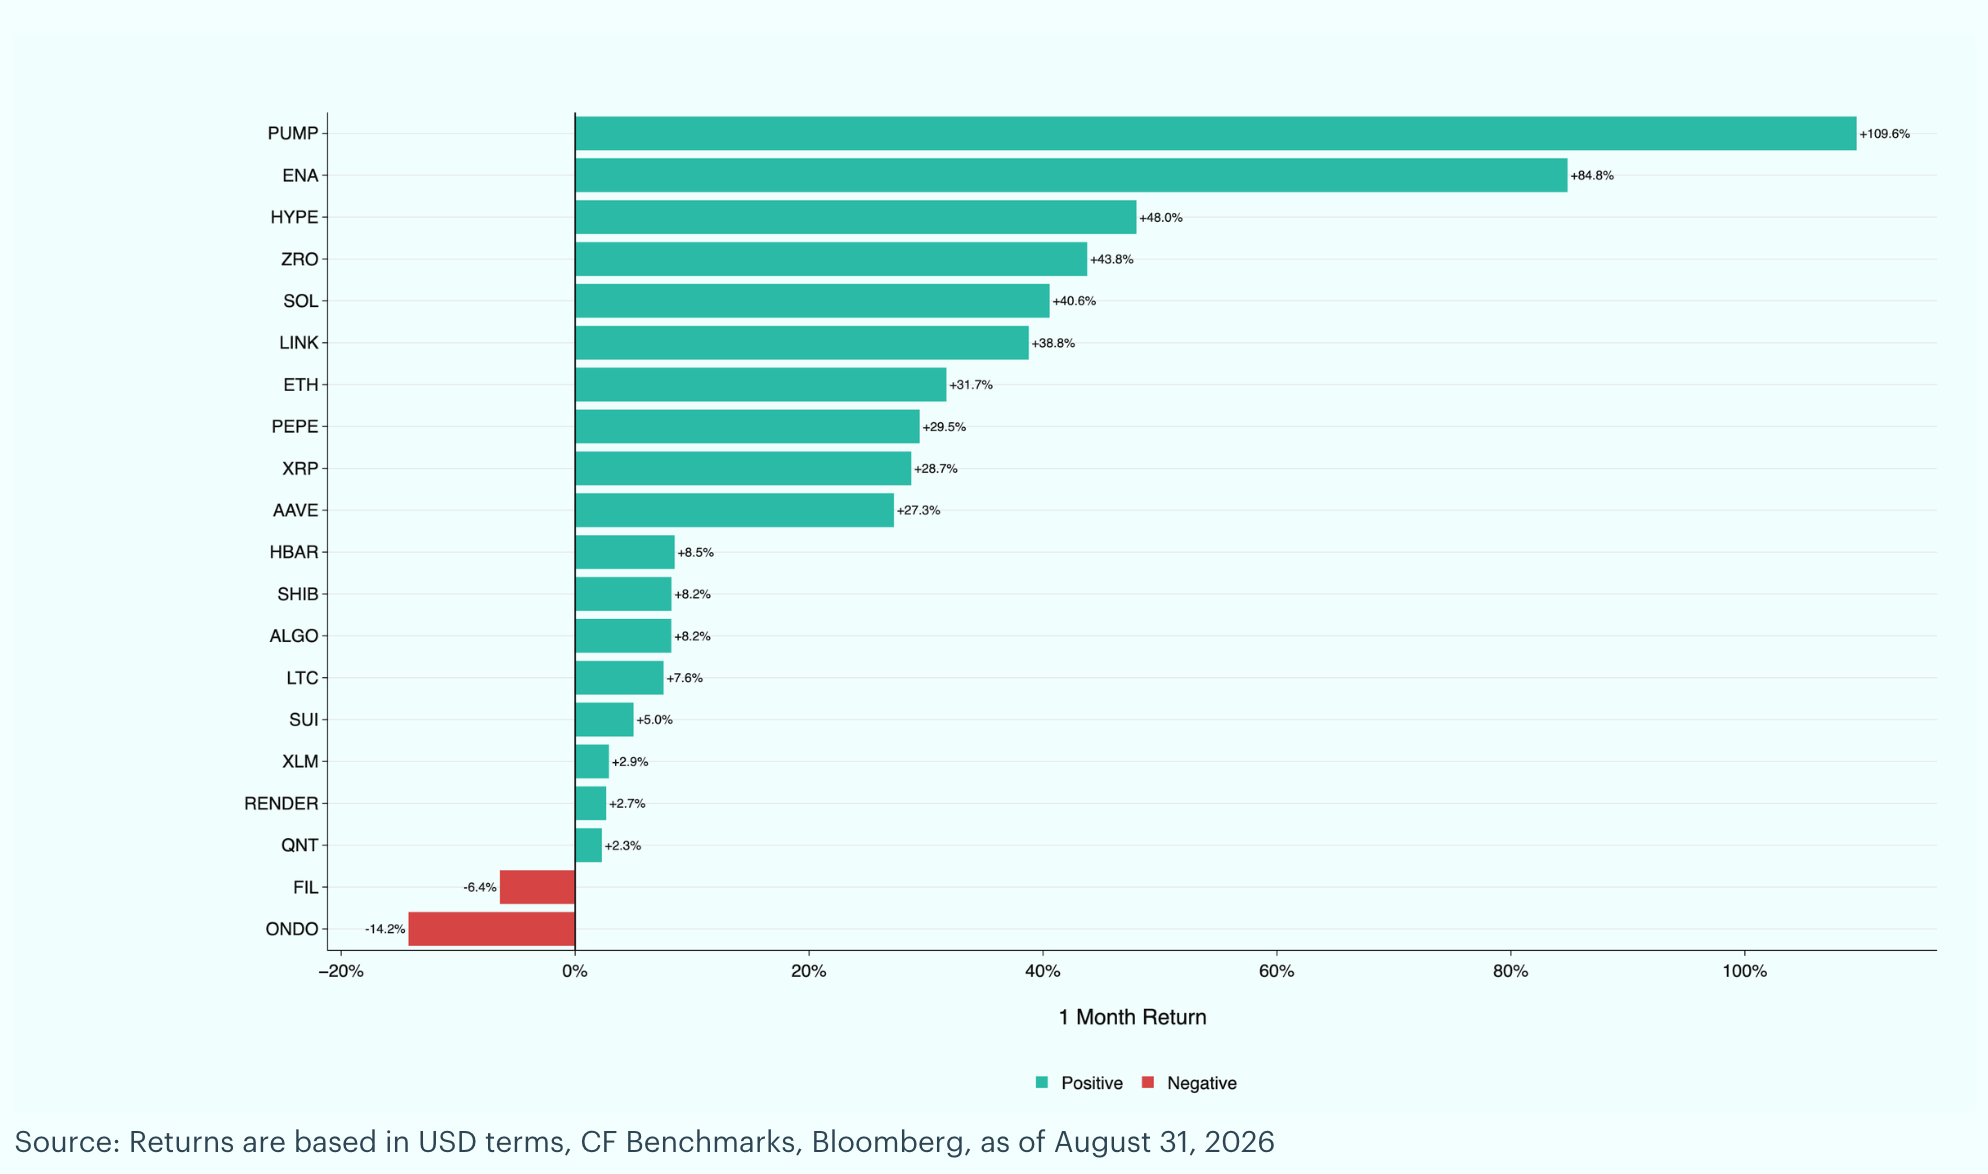
Pump.fun and Ethena Lead, Ondo Lags: Pump.fun (PUMP) led the major crypto pairs in August, rising 109.6% month over month (MoM), the largest gain in the group, after an August 7 zero fee cross chain trading launch and buybacks that topped $1 million per day in late August. Ethena (ENA) rose 84.8% after FalconX's August 20 announcement of a $1 billion warehouse financing facility for USDe backed institutional loans. Hyperliquid (HYPE) gained 48.0%, hitting an $86.64 all time high on August 27 following a mention by the president during the White House crypto summit. Ondo (ONDO) was the weakest major, down 14.2% MoM, as continued token unlock supply growth outpaced demand even though the Ondo Stocks product grew to $1.01 billion in tracked value, and Filecoin (FIL) fell 6.4%, trading near its all time low for much of the month.
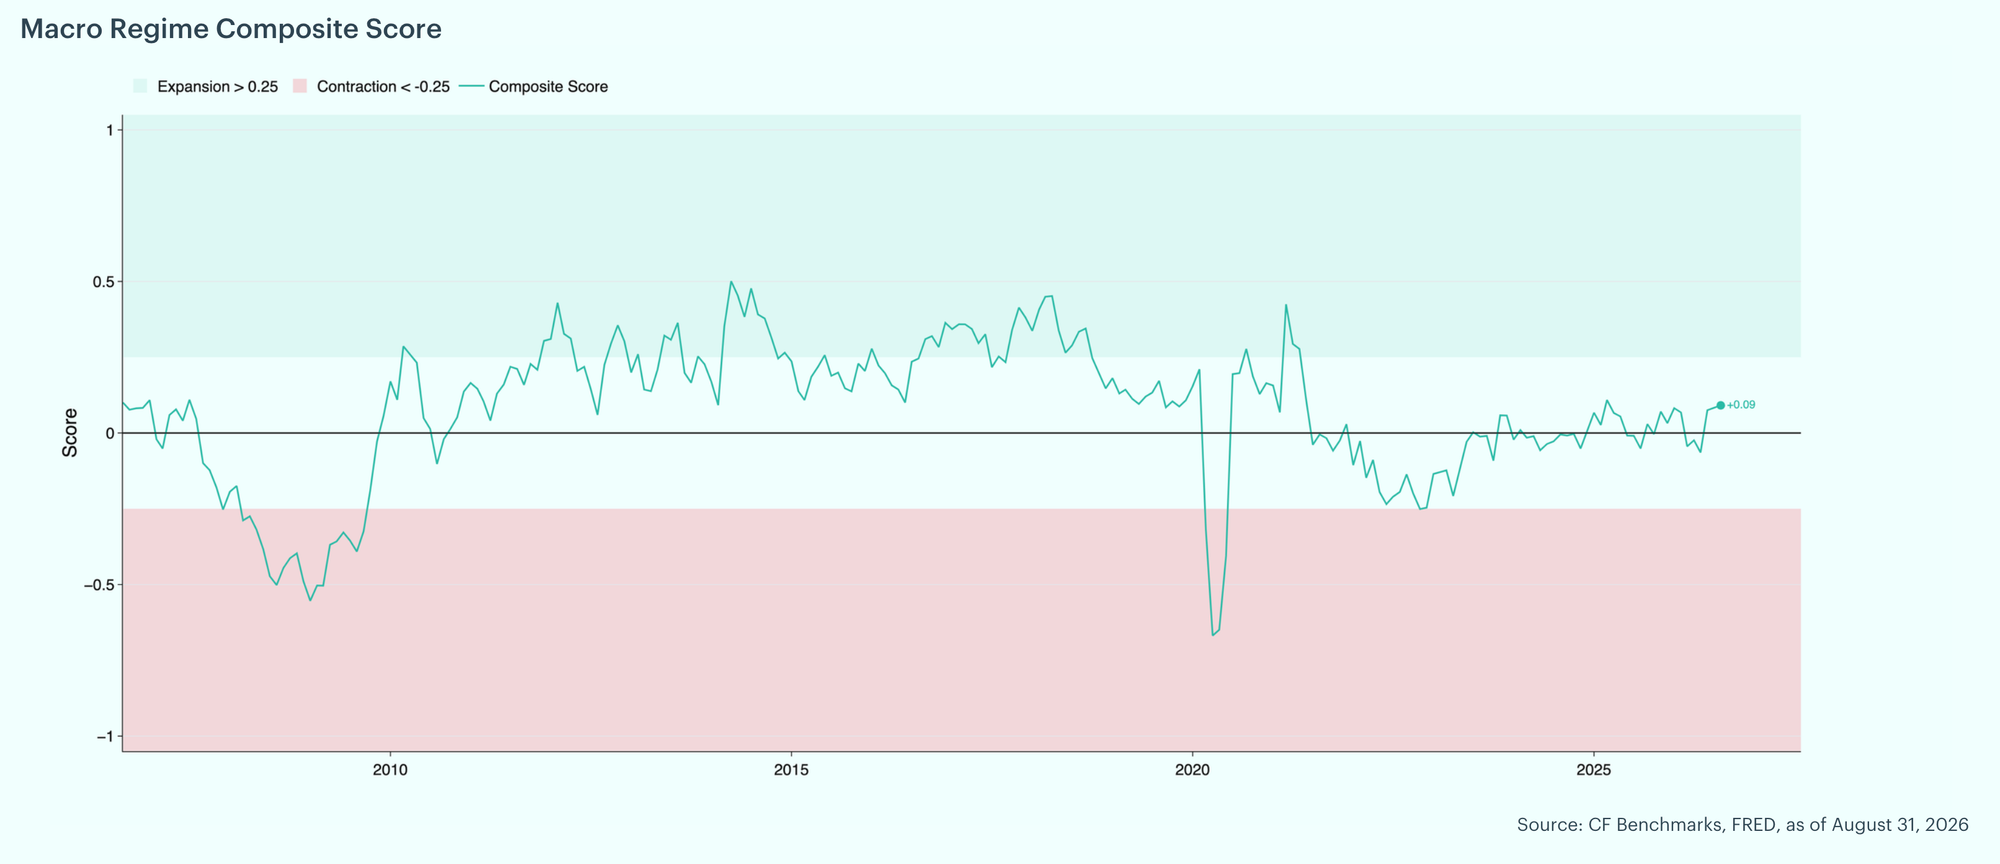
Late Cycle Macro Tilts Positive but Stops Short of Expansion: The CF Benchmarks Macro Regime Composite Score rose modestly to +0.09 from +0.06, still in the neutral zone (expansion above +0.25, contraction below negative 0.25) and tilting positive but short of a confirmed expansion signal. The cycle still reads flat and late stage. Narrowing credit spreads, firmer equities, and cooling headline and core inflation sit on the improving side, with the ICE BofA High Yield option adjusted spread narrowing to 2.60% from 2.85%, a move of 0.25 percentage points (pp), and the S&P 500's six month change firming to +12.1% from +7.9%, up 4.2 pp MoM. Employment conditions held steady, with the unemployment rate easing to 4.1% from 4.2% and the ISM Services PMI holding at 54.0, above the 50 expansion threshold despite slipping from 54.5. On the deteriorating side, a contractionary reading from the Brave Butters Kelley leading index (negative 0.60), falling labor force participation (61.4% from 61.5%), softer freight volumes (Cass Freight Shipments, down 4.8% year over year), and rising services input costs (ISM Services Prices Paid up to 70.3 from 67.7) point to fraying breadth beneath the improving headline figures.
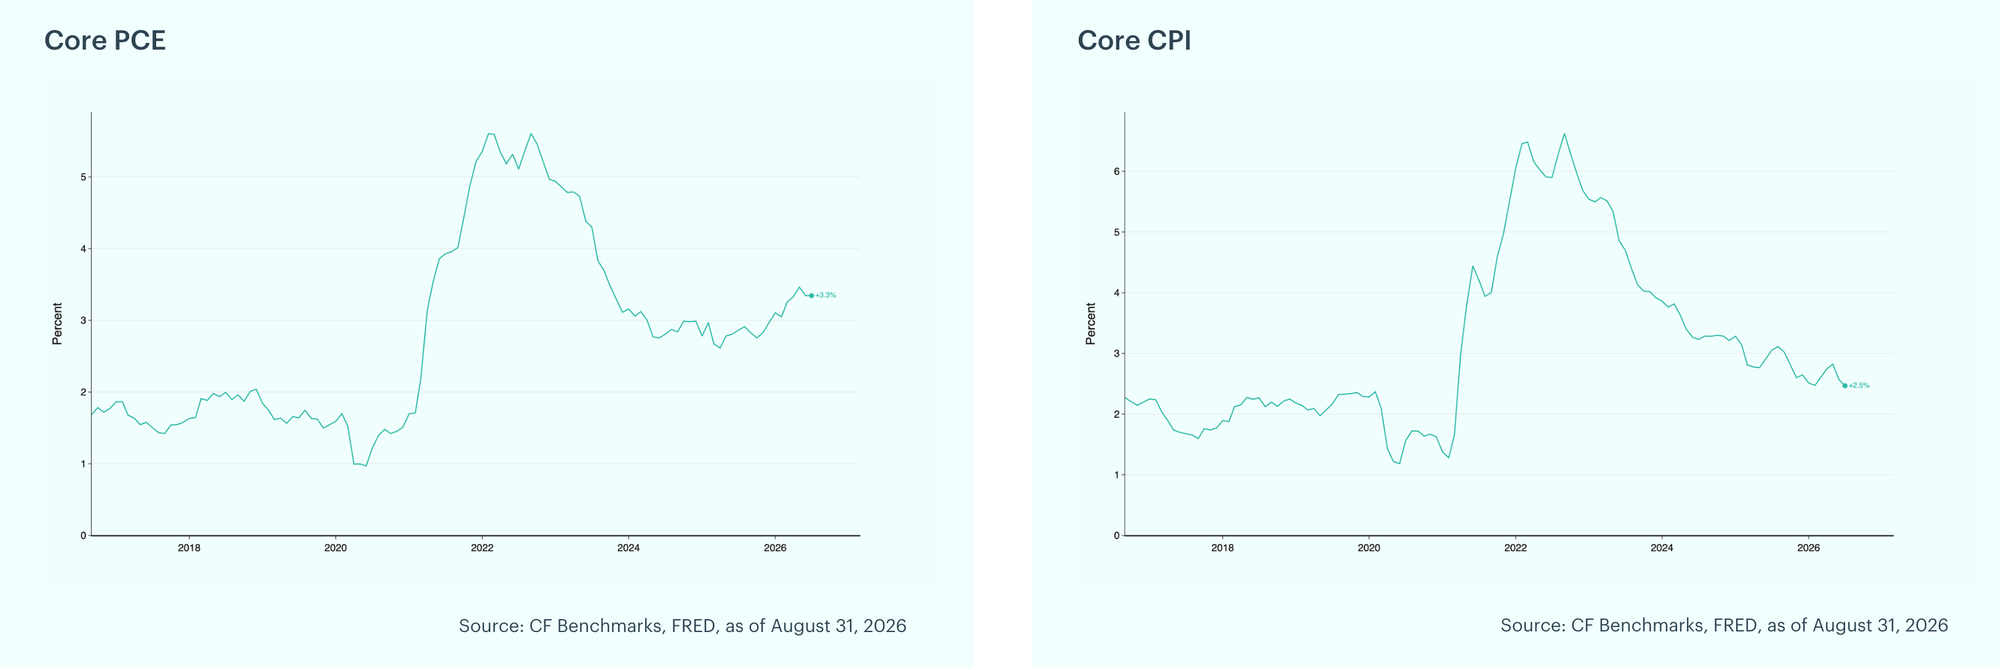
Core Inflation Holds the Key to the Hawkish Case: We are watching the core inflation measures closely, as any pickup in these could solidify the Federal Reserve's hawkish stance following Chair Warsh's tone at Jackson Hole. Core PCE inflation, the Fed's preferred gauge, was flat at 3.3% year over year (YoY), unchanged MoM and still more than a percentage point above the 2% target. Core CPI eased to 2.5% YoY from 2.6%, a 0.1 pp decline that keeps the disinflation trend intact for now. A print that moves either measure back toward its recent highs would corroborate the hawkish repricing already underway.
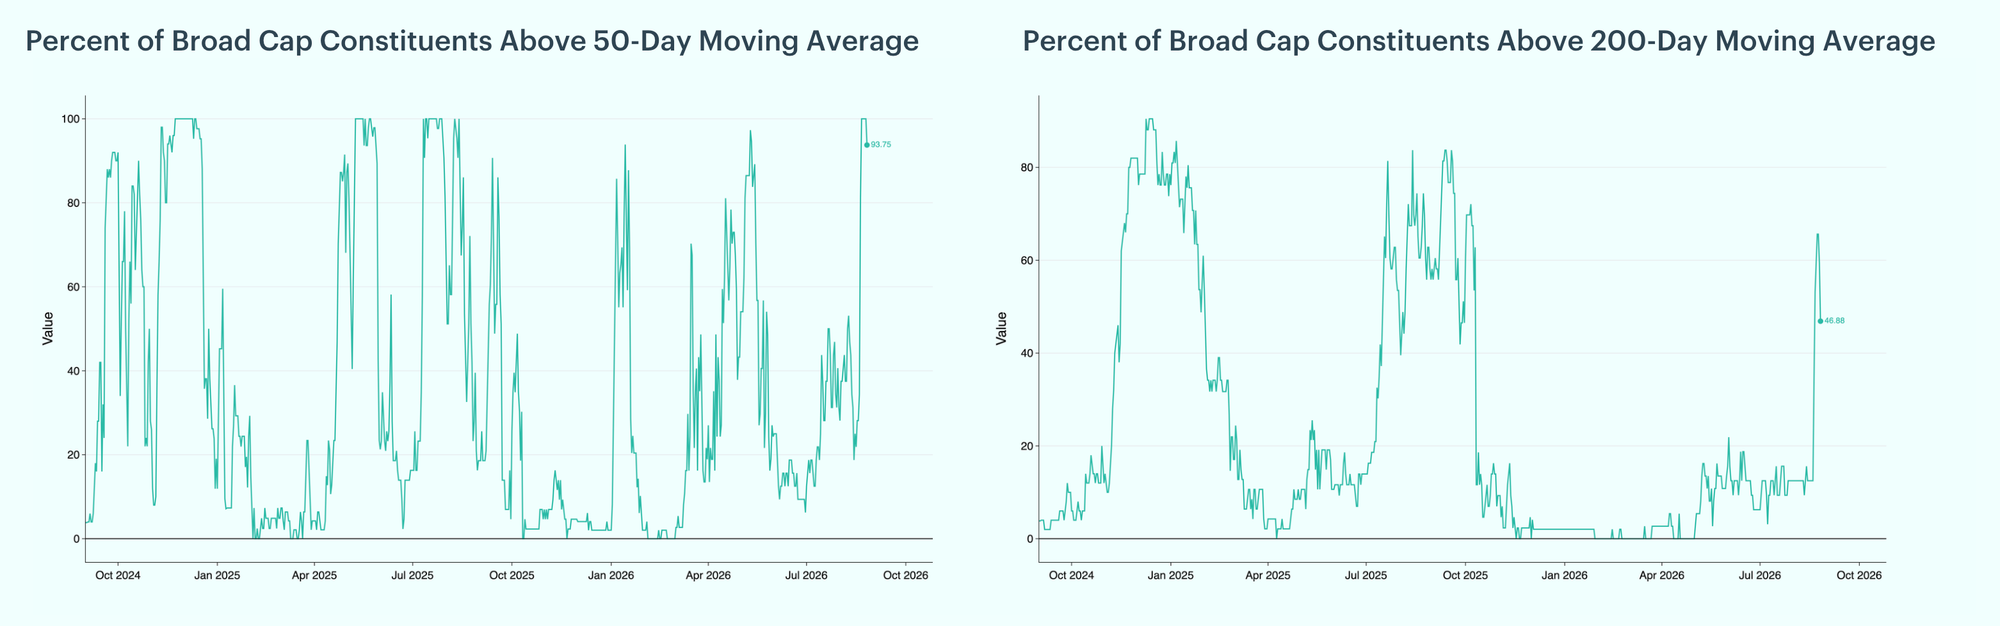
Market Breadth Turns Decisively Positive: Both measures of market breadth turned decisively higher after mid August. The share of Broad Cap constituents trading above their 50 day moving average surged from 12.5% on August 16 to 100% by August 21, the first 100% reading since August 13, 2025, before easing to 93.8% into month end. The 200 day measure climbed to a monthly high of 65.6% on August 23 to 24, its first print above 50% since October 2025, before pulling back to 46.9% as the rally cooled. Unlike prior rallies led by a handful of large caps, this advance carried most of the Broad Cap universe with it.
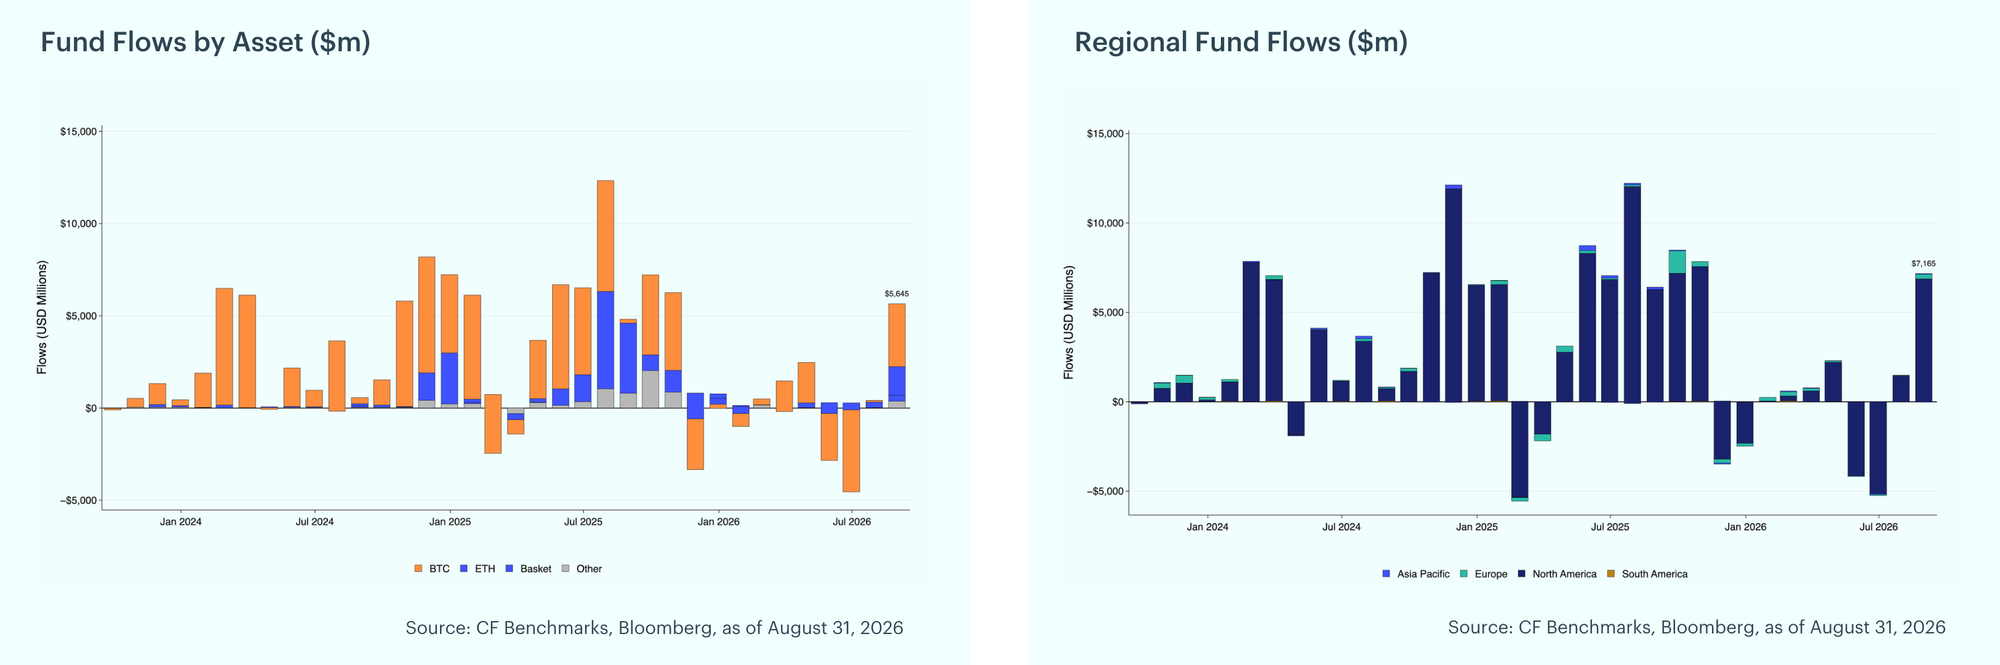
Fund Flows Post Their Strongest Month of the Year: Digital asset funds extended their rebound in August, taking in $5.6 billion after $409 million of inflows in July. Bitcoin funds led with $3.4 billion, the largest monthly figure in this series, up from $90 million in July. Ether funds drew $1.6 billion, up from $297 million, while Basket funds added $311 million and Other Single Crypto funds added $379 million. Regional flows, which cover a broader fund universe and do not sum to the headline figure, were led by North America at $6.9 billion, up from $1.4 billion in July, with Europe adding $259 million and Asia Pacific and South America little changed.
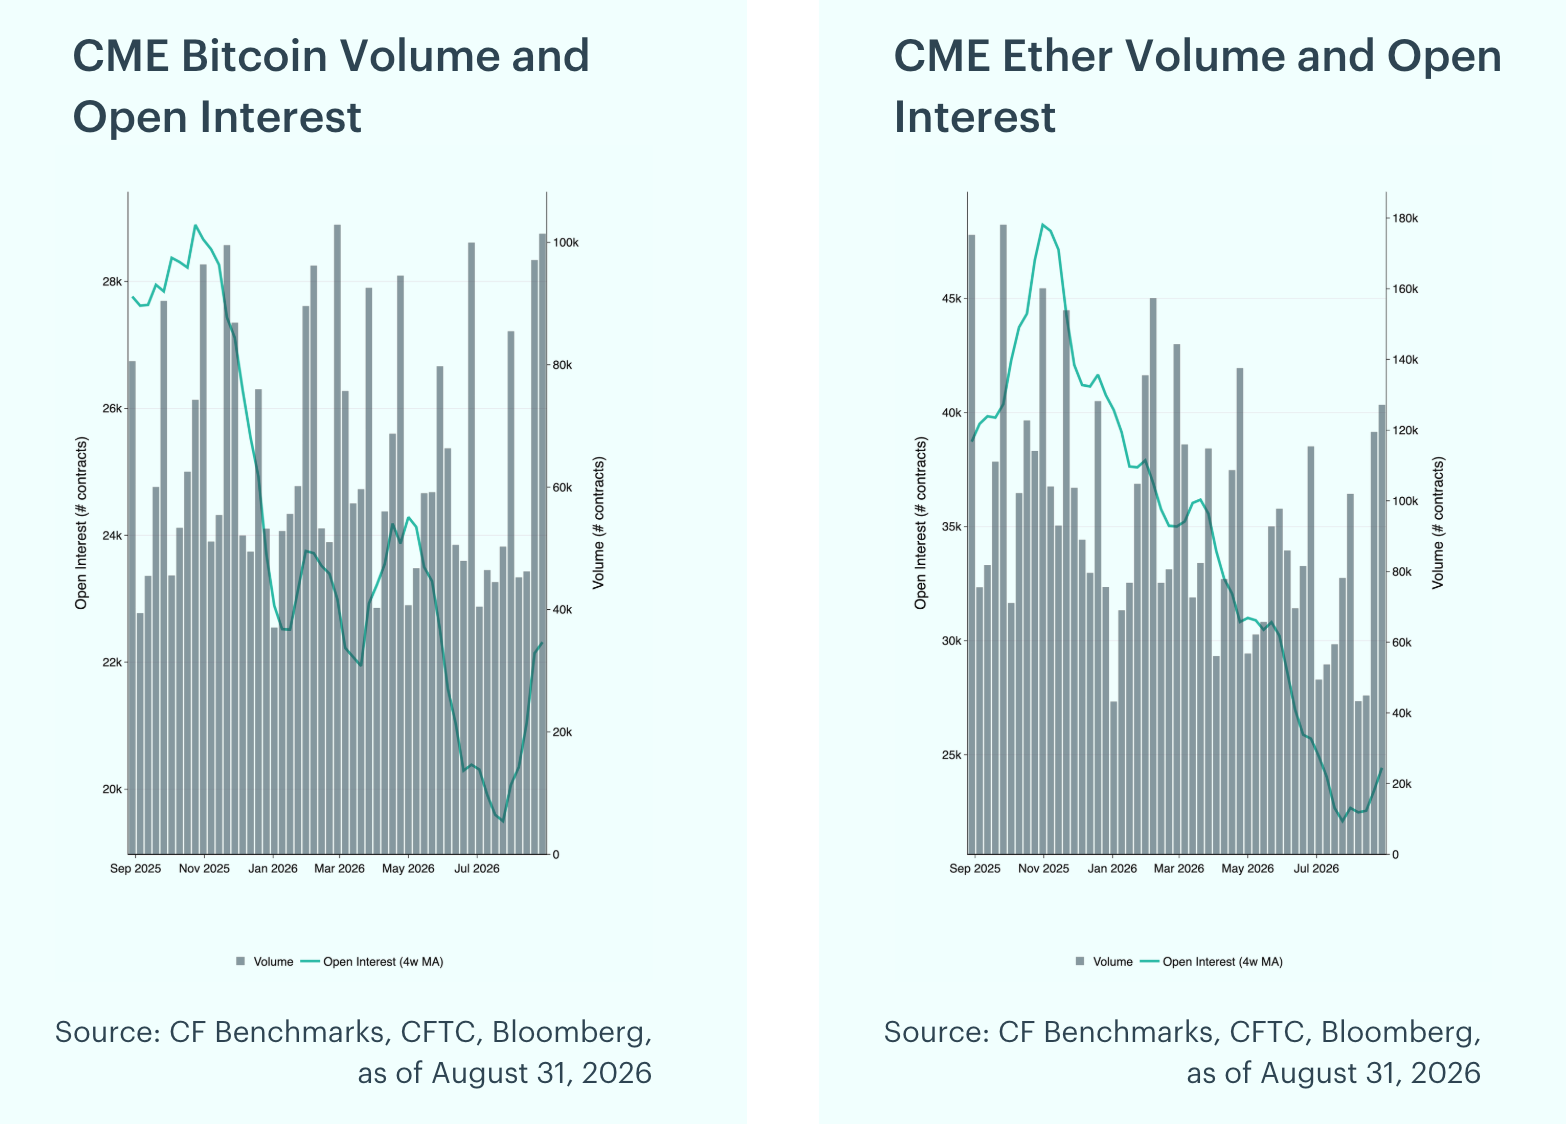
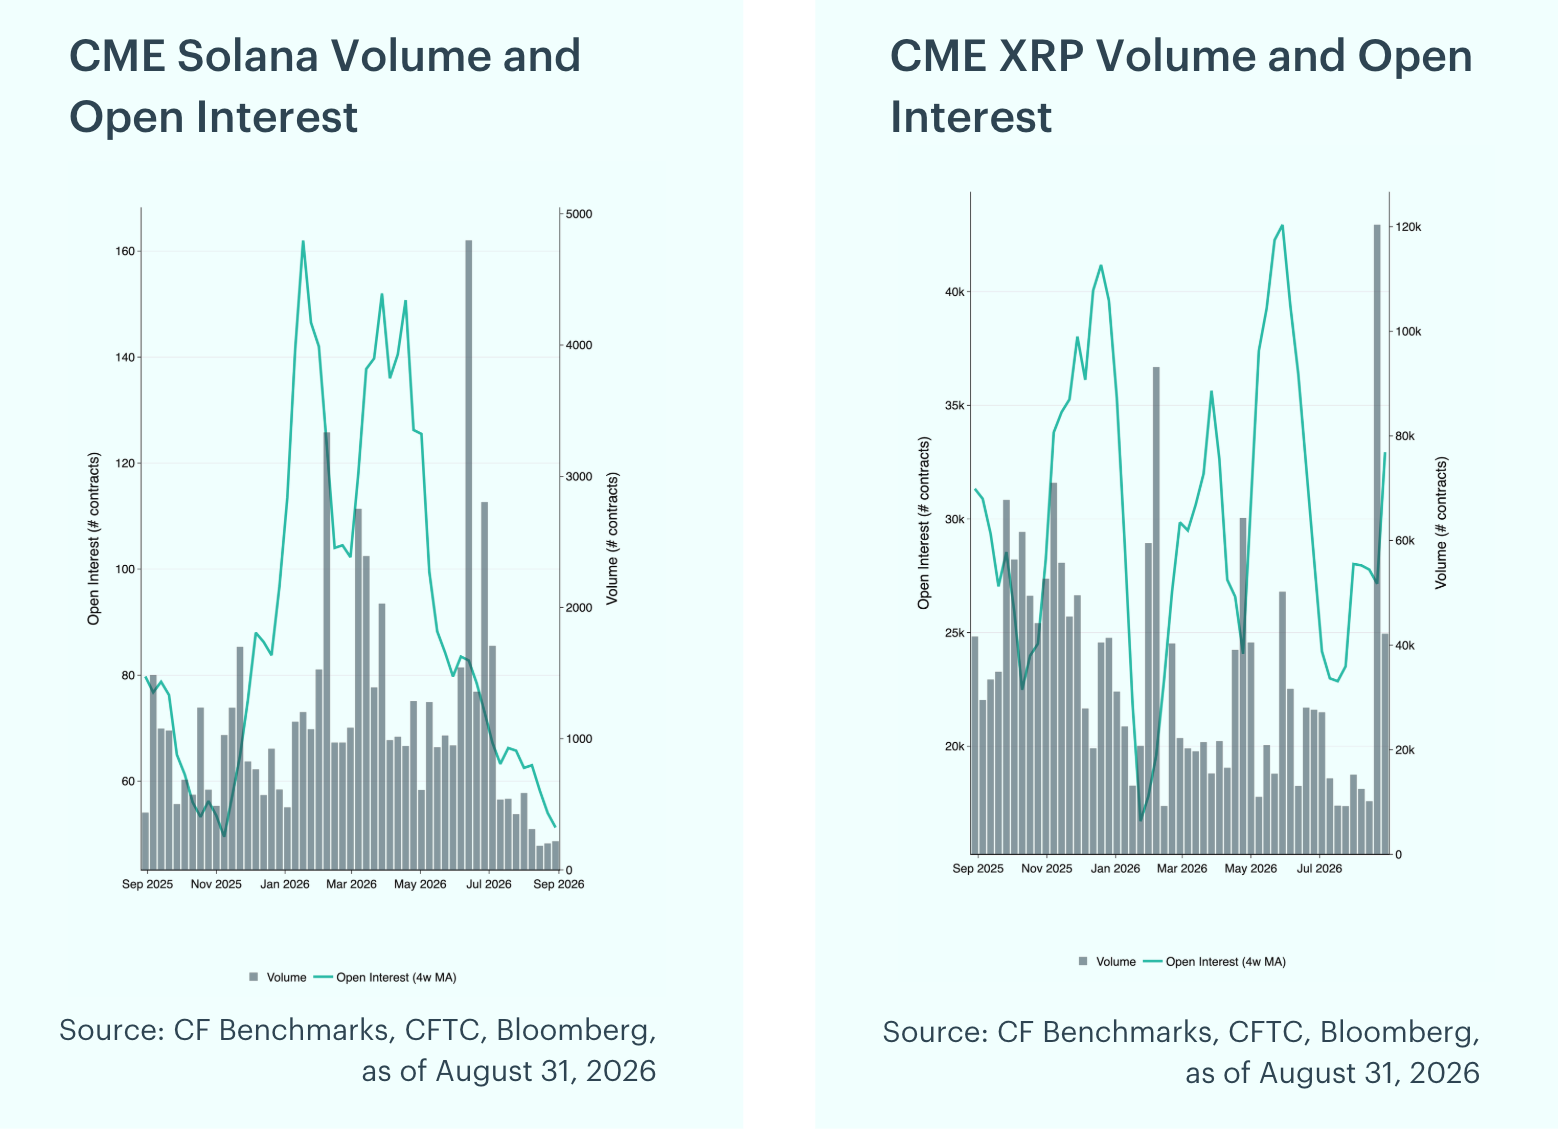
Futures Positioning Rises Broadly, XRP Leads: CME futures positioning rose broadly in August. On a four week moving average basis, XRP open interest rose to roughly 32,936 contracts from 28,021, the largest gain in the group, and Ether (ETH) rose 7.8% to about 24,430 contracts, while Bitcoin (BTC) added 11.2% to roughly 22,315 contracts and Solana (SOL) eased to about 51 contracts. XRP's single week open interest also jumped 87.8%, from 27,606 to 51,835 contracts. Peak weekly volume was highest in Ether at 180,410 contracts, ahead of Bitcoin's 147,056 and XRP's 120,373.
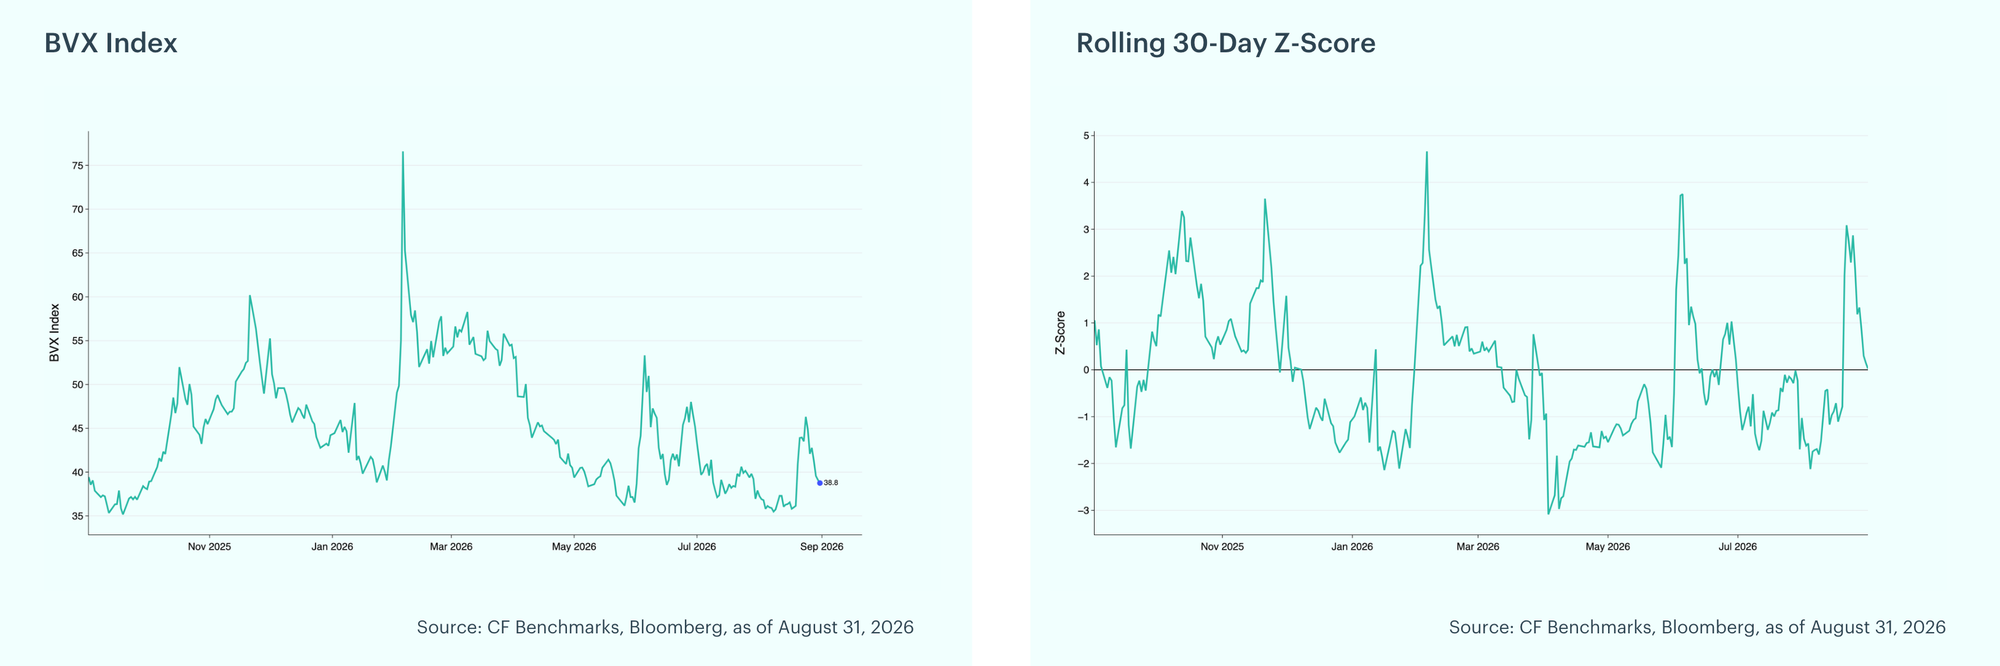
Bitcoin Volatility Ticks Higher, Stays Near Neutral: The CF Bitcoin Volatility Index (BVX), a daily benchmark providing a forward looking, 30 day constant maturity measure of implied volatility derived from CFTC regulated Bitcoin option contracts traded on the CME, rose in August. The index traded in a 35.49 to 46.31 range and closed the month at 38.75, up 2.2% from 37.90 at the end of July and in the 22nd percentile of its trailing year range. The rolling 30 day z score ended the month near neutral at 0.03, after swinging between negative 2.12 and 3.09 during August.
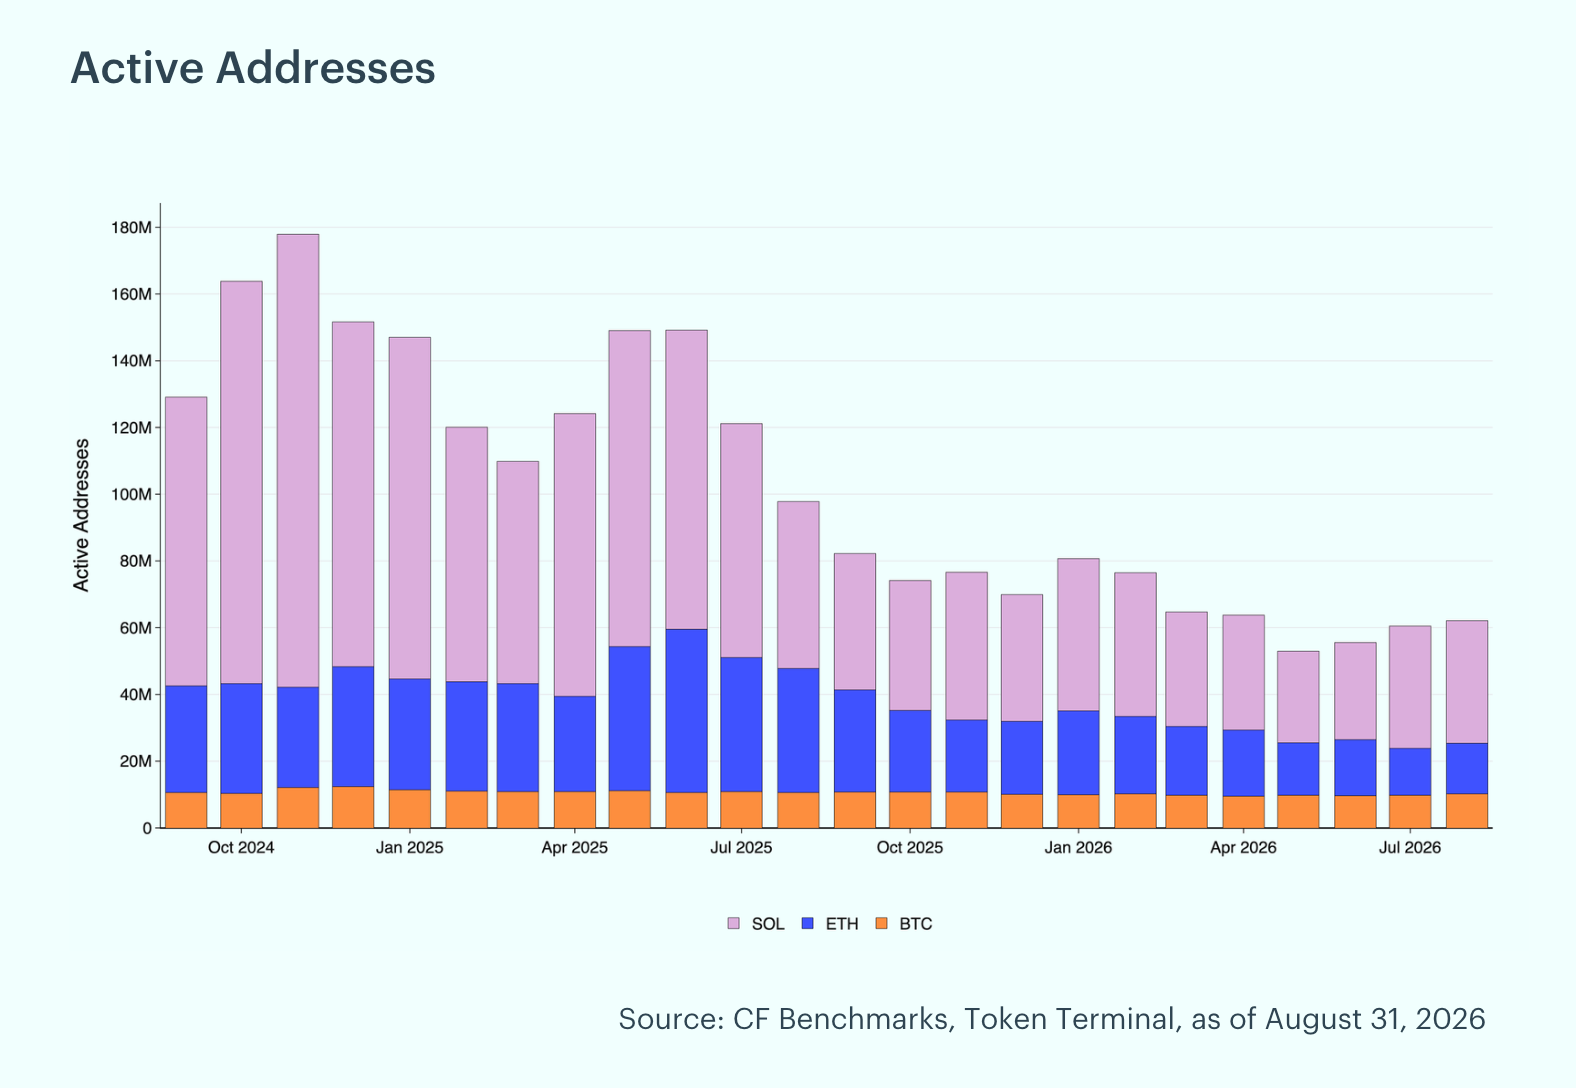
Active Addresses Rise on Ethereum Strength: Monthly active addresses rose to 62.1 million across the three tracked networks in August, up 2.7% MoM from 60.5 million. The gain was driven by Ethereum (ETH), where active addresses climbed 7.8% to 15.1 million, with Bitcoin (BTC) adding 4.3% to 10.2 million. Solana (SOL) was little changed at 36.8 million, up 0.3%, and remained roughly 59% of the tracked total.
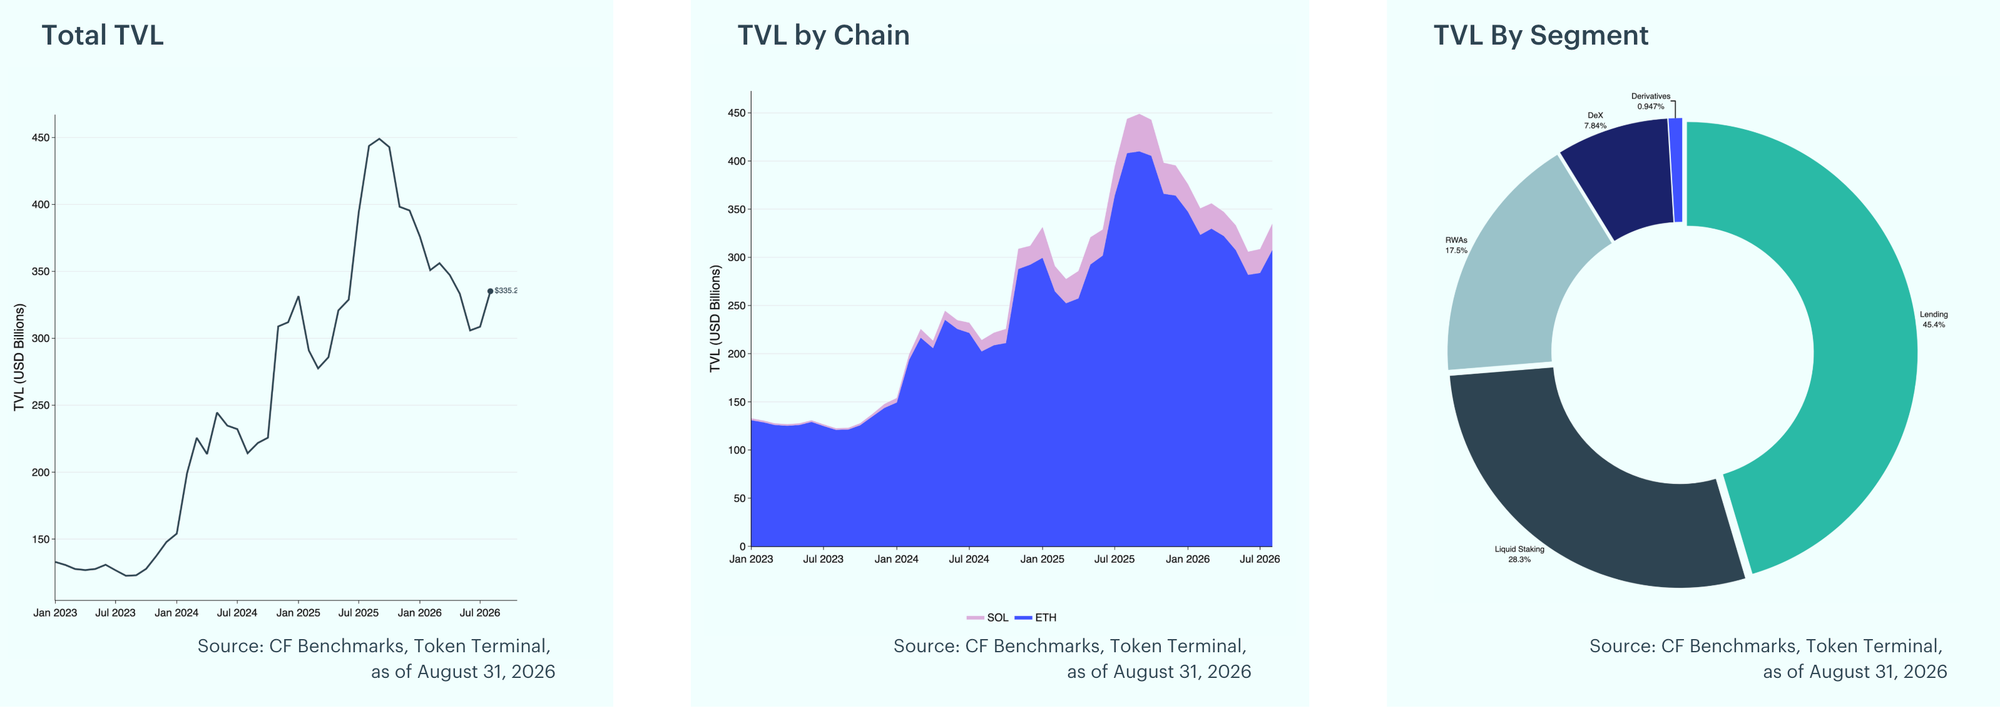
DeFi TVL Extends Its Advance: Total Value Locked (TVL) in DeFi protocols rose 8.6% in August to $335.2 billion, up from $308.6 billion in July. Ethereum TVL rose to $307.9 billion, a 8.5% gain, while Solana TVL rose to $27.3 billion, up 9.8%, leaving Ethereum at roughly 92% of the tracked total.
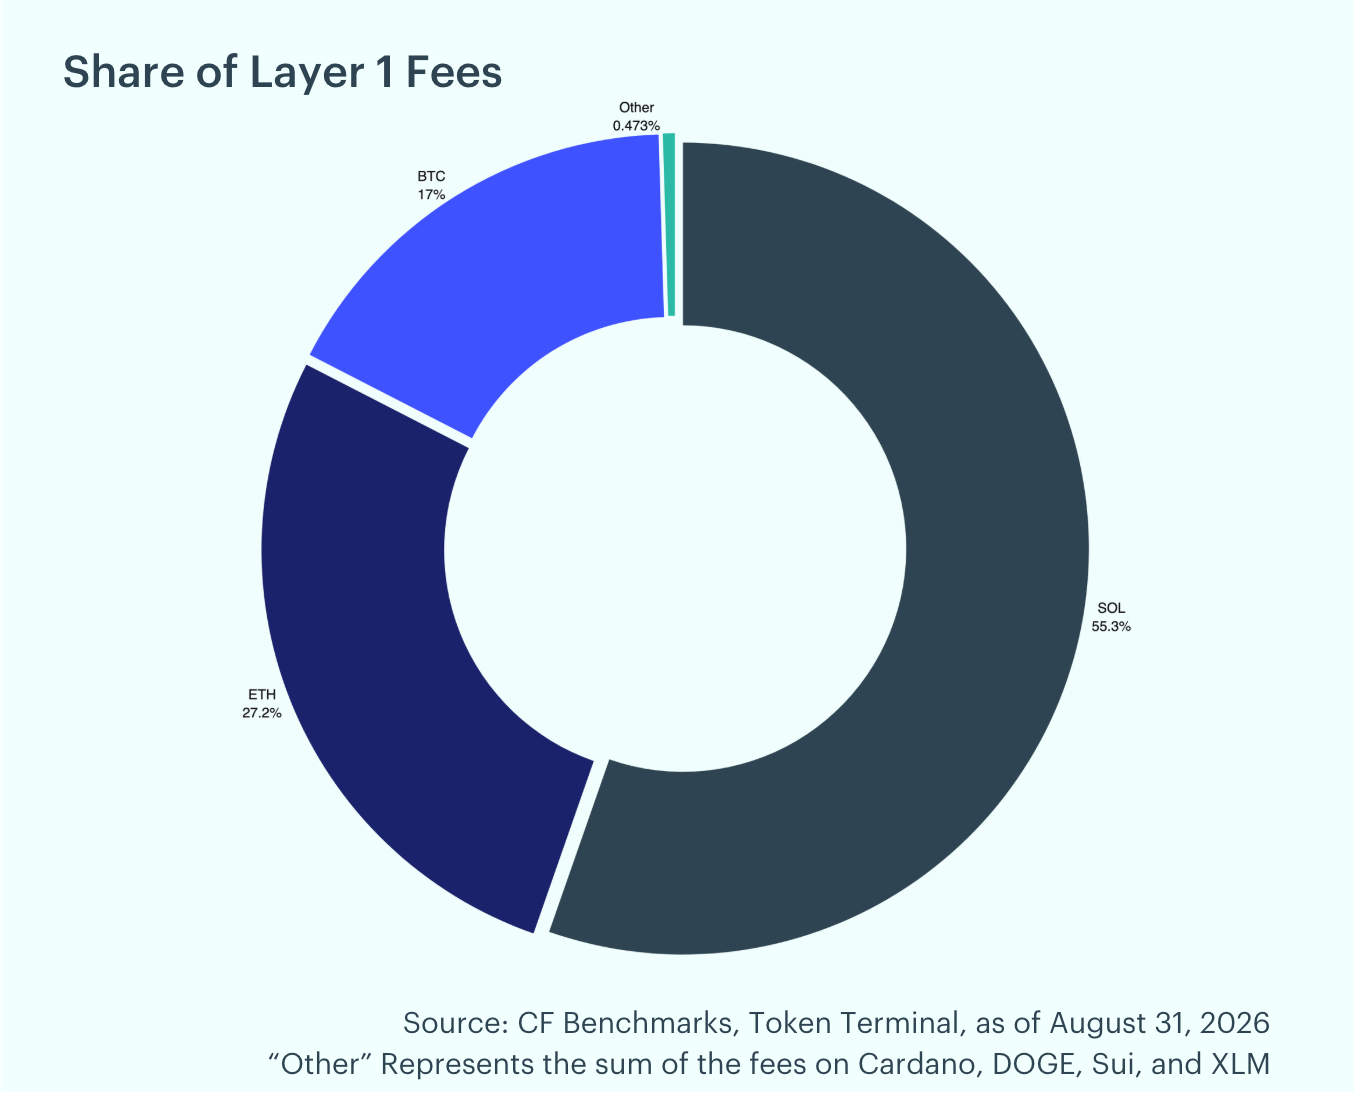
Layer 1 Fees Jump as Solana Extends Its Lead: Total Layer 1 fees rose 32.1% MoM in August to $40.1 million from $30.3 million in July. Solana led with $22.2 million, 55.4% of the total, on a 40.9% increase, followed by Ethereum at $10.9 million, 27.2% of the total and up 29.6%, and Bitcoin at $6.8 million, 17.0% and up 13.6%.
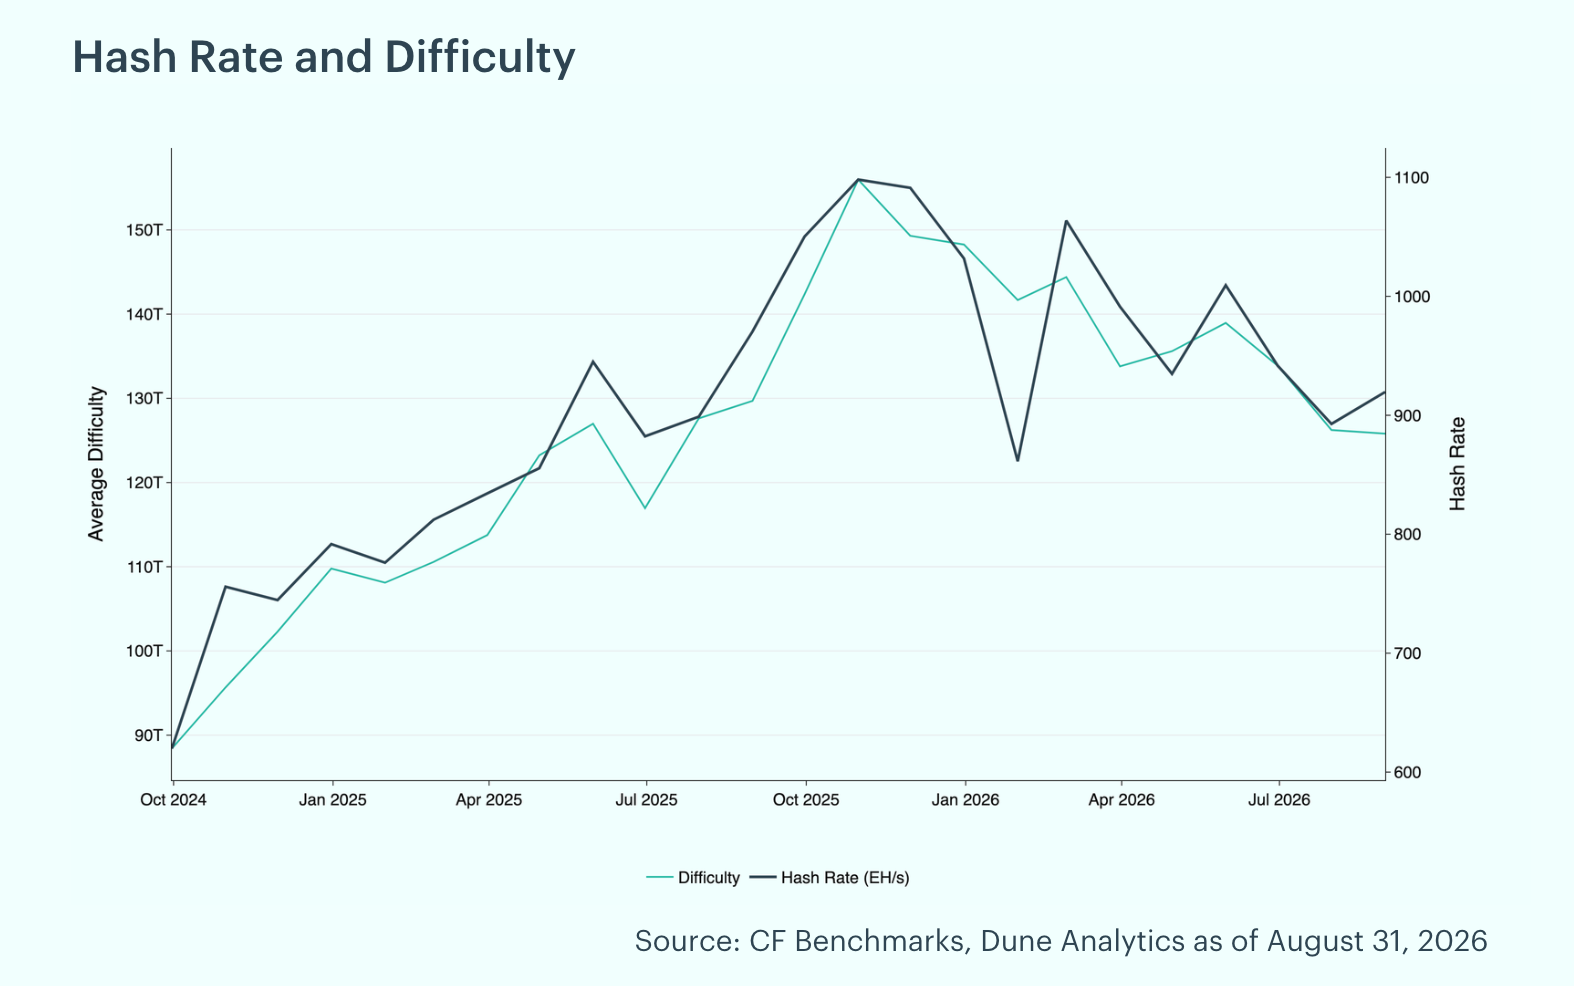
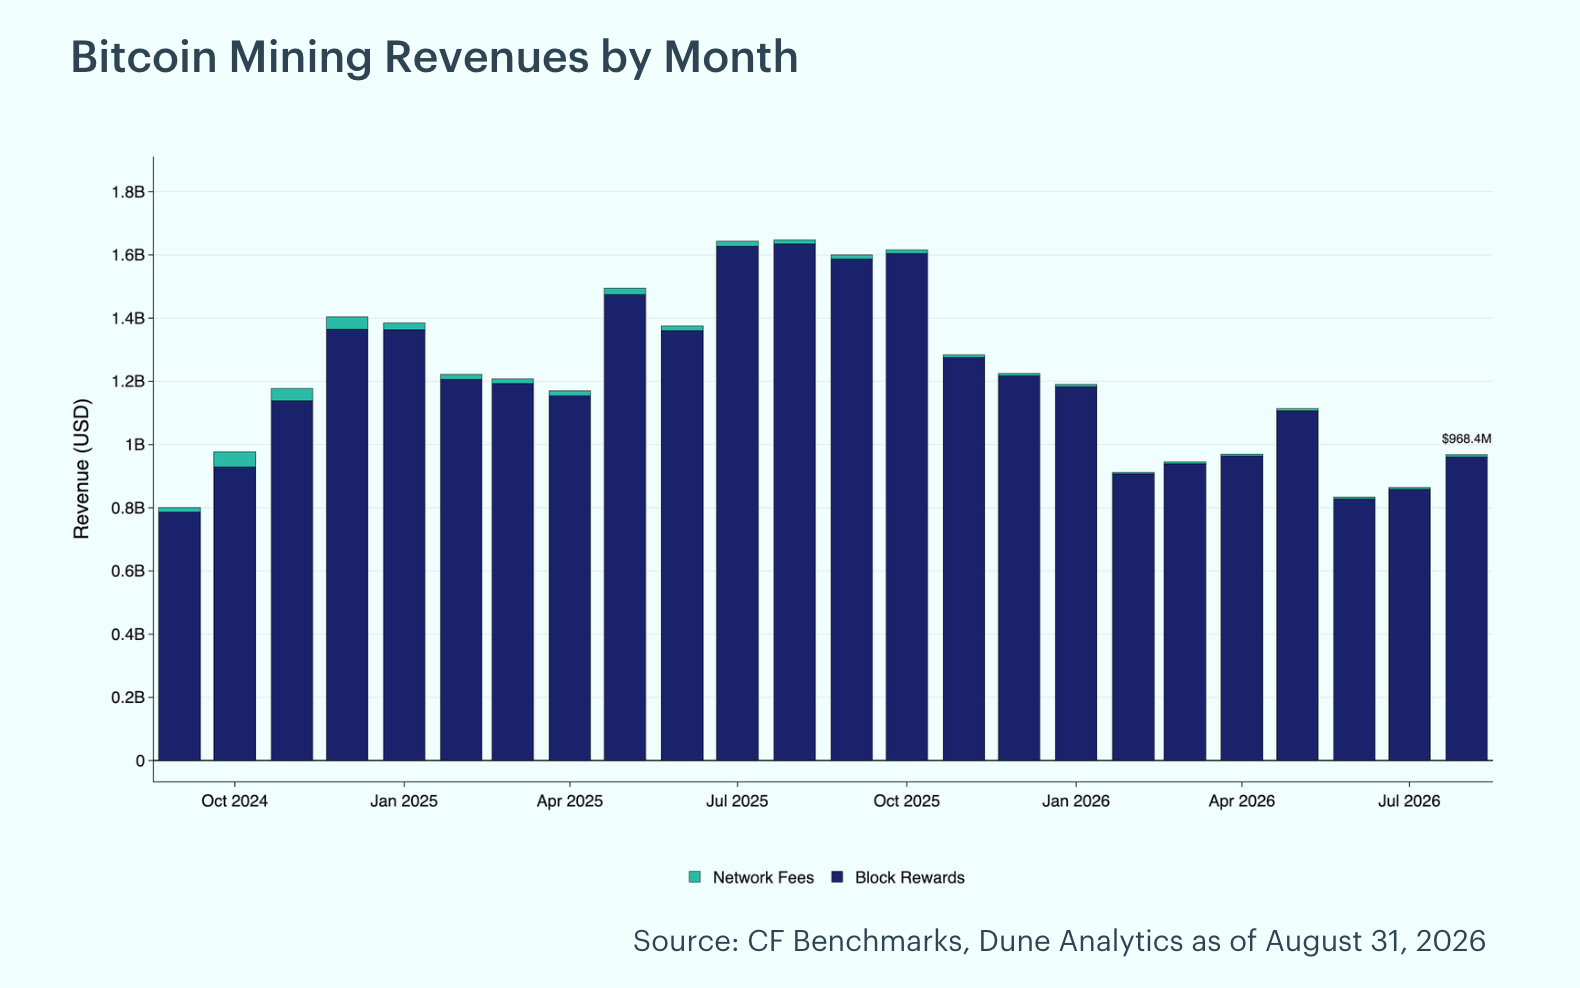
Hash Rate and Mining Revenue Both Rise: Bitcoin's hash rate rose 3.0% in August, climbing to 919.6 exahashes per second from 892.7 EH/s at July's end, and ranged between 845.7 and 938.3 EH/s during the month. Mining difficulty eased 0.3% to 125.8T, little changed after hash power recovered late in the month. Miners saw a 12.1% increase in revenue, with total mining revenue of $968.4 million. Of the total rewards earned during the month, 0.7% came from transaction fees, with block rewards totaling $961.6 million and fees contributing $6.8 million. Revenue rose alongside the gain in hash rate and a 24.7% rise in Bitcoin's price through the month.
To read the complete report, click here to view a PDF version. Additionally, please do not forget to subscribe to our latest news and research for the most relevant institutional insights on digital assets and the top digital assets by market cap.
The information contained within is for educational and informational purposes ONLY. It is not intended nor should it be considered an invitation or inducement to buy or sell any of the underlying instruments cited including but not limited to cryptoassets, financial instruments or any instruments that reference any index provided by CF Benchmarks Ltd. This communication is not intended to persuade or incite you to buy or sell security or securities noted within. Any commentary provided is the opinion of the author and should not be considered a personalised recommendation. Please contact your financial adviser or professional before making an investment decision.
Note: Some of the underlying instruments cited within this material may be restricted to certain customer categories in certain jurisdictions.
Factor Friday - September 18, 2026
Value led CF Benchmarks' factor table for a third straight week at 1.85%, even as its pace cooled. Growth flipped positive while Downside Beta turned negative for the first time in three weeks, and the Market's decline eased sharply to 0.70% from last week's near-5% drop.

Mark Pilipczuk
Changes to the Token Market Price Benchmarks Series - Market Prices – 15 September 2026
The Administrator has confirmed changes to the Token Market Price Family for the period 08 September 2026 to 15 September 2026
CF Benchmarks
Emerging Leaders, Established Activity
The CME CF Emerging Crypto Index provides rules-based exposure beyond Bitcoin and Ether, capturing networks that account for most observed protocol fees and user activity while applying the institutional standards required for a credible benchmark.
CF Benchmarks
By clicking Accept, you consent to CF Benchmarks's use of cookies.
Visit Cookie Settings to learn how CF Benchmarks uses cookies and to adjust your preferences.