
Apr 03, 2026
Conviction in the Crossfire: Geopolitical Risk, Regulatory Breakthroughs, and the Bitcoin Catch-Up Trade
Executive Summary
The Iran conflict and its cascading effects on energy markets, inflation, and Fed policy have reshaped the macro landscape since our prior edition. Growth is decelerating faster than expected as the oil shock neutralizes the fiscal impulse and consumer momentum fades, with Q1 likely the strongest quarter of the year. The Fed remains constrained by dueling mandates, with our base case narrowing to one cut in the second half while the balance sheet expands regardless of the rate path. The regulatory environment, however, has become the most constructive digital assets have experienced in the U.S.: the GENIUS Act established a federal stablecoin framework, the SEC and CFTC signed a joint jurisdictional MOU, and both Nasdaq and NYSE are building infrastructure for tokenized equity trading, with remaining hurdles likely to clear in 2H 2026. Bitcoin's catch-up trade with gold has deepened to its most attractive entry point, with the market cap ratio 47% below trend and fund flows now rotating in Bitcoin's favor. Bitcoin-backed yield products should nearly double to $15 billion as covered call funds scale alongside structurally elevated volatility. Stablecoins have decoupled from the broader market pullback, with total supply reaching $312 billion, while onchain agentic activity is accelerating across payments and execution layers, supporting increased machine-to-machine value transfer.
Market Recap: Geopolitical Escalation, Policy Paralysis, and Early Signs of Differentiation
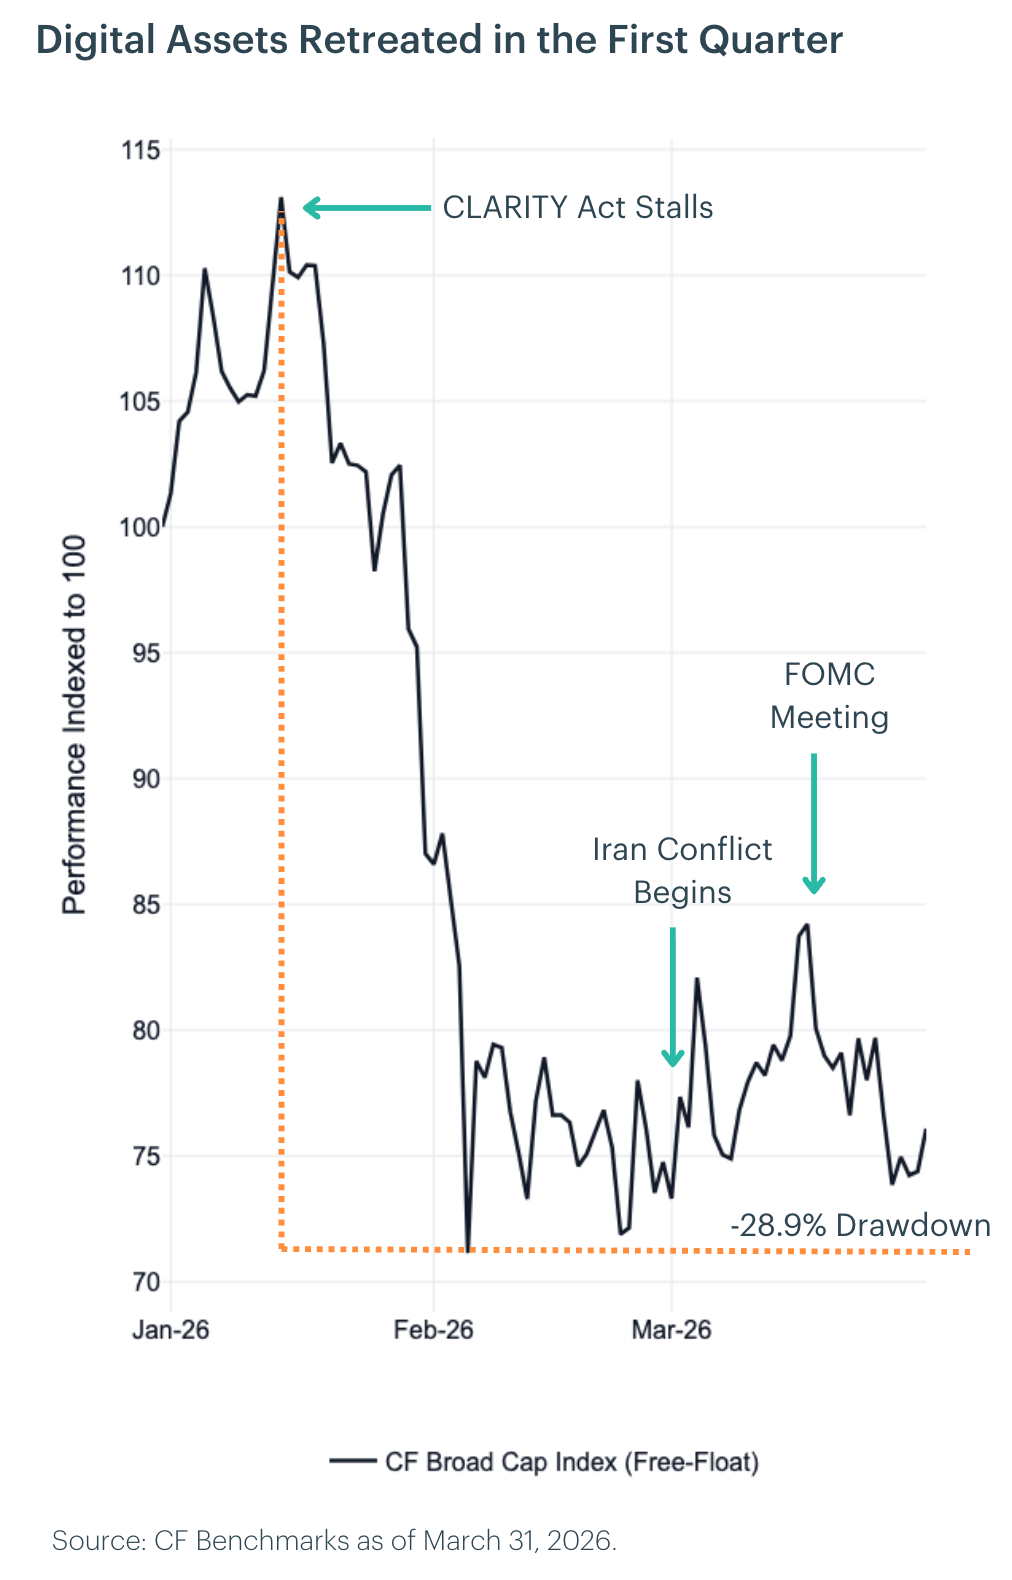
Digital assets entered 2026 under pressure, extending the late-2025 drawdown as macro, geopolitical, and policy headwinds converged. The Federal Reserve held rates steady in January, but attention quickly shifted to leadership risk after President Trump announced Kevin Warsh as the next Fed Chair, introducing uncertainty around the central bank's reaction function. Bitcoin traded defensively before selling off into month-end. Regulatory momentum slowed as crypto legislation stalled, and geopolitical tensions reinforced a risk-off posture. With policy clarity delayed and macro data distorted by seasonal and geopolitical effects, investors de-risked, liquidity thinned, and conviction remained low across higher-beta tokens.
February brought a sharp escalation across multiple fronts. The Warsh confirmation process hit early headwinds after Senator Tillis vowed to block the nomination until a DOJ investigation into the Fed was resolved. The CLARITY Act languished in the Senate after the Banking Committee postponed its markup amid industry pushback over a stablecoin interest payment amendment, and two White House-brokered sessions failed to bridge the divide. Bitcoin sold off sharply, temporarily breaching $60,000 before stabilizing in the mid-$60,000 range, with the move underscored by a four-standard-deviation spike in the CME CF Bitcoin Volatility Index (BVX) amid a broad liquidation cascade. Geopolitical risk escalated further as coordinated U.S.-Israeli strikes on Iran on February 28 spiked uncertainty across energy markets. With legislative progress frozen and geopolitical tensions compounding the macro backdrop, higher-beta tokens bore the brunt of the sell-off.
March was dominated by the intensification of the Iran conflict, which became the primary market driver as a sustained surge in oil prices and cross-asset volatility tightened financial conditions. The Fed held rates steady but delivered a hawkish message, with Chair Powell noting that a rate hike had been discussed and emphasizing that cuts remain contingent on further inflation progress, prompting sharp repricing in rate expectations. Bitcoin declined alongside equities before stabilizing into month-end as signs of capitulation emerged. Broader digital asset markets continued to face selling pressure, though the quarter closed with early signs of differentiation as large-cap names posted modest gains even while speculative segments continued to slide.
Measuring Growth: An Energy Shock Meets an Already-Cooling Economy
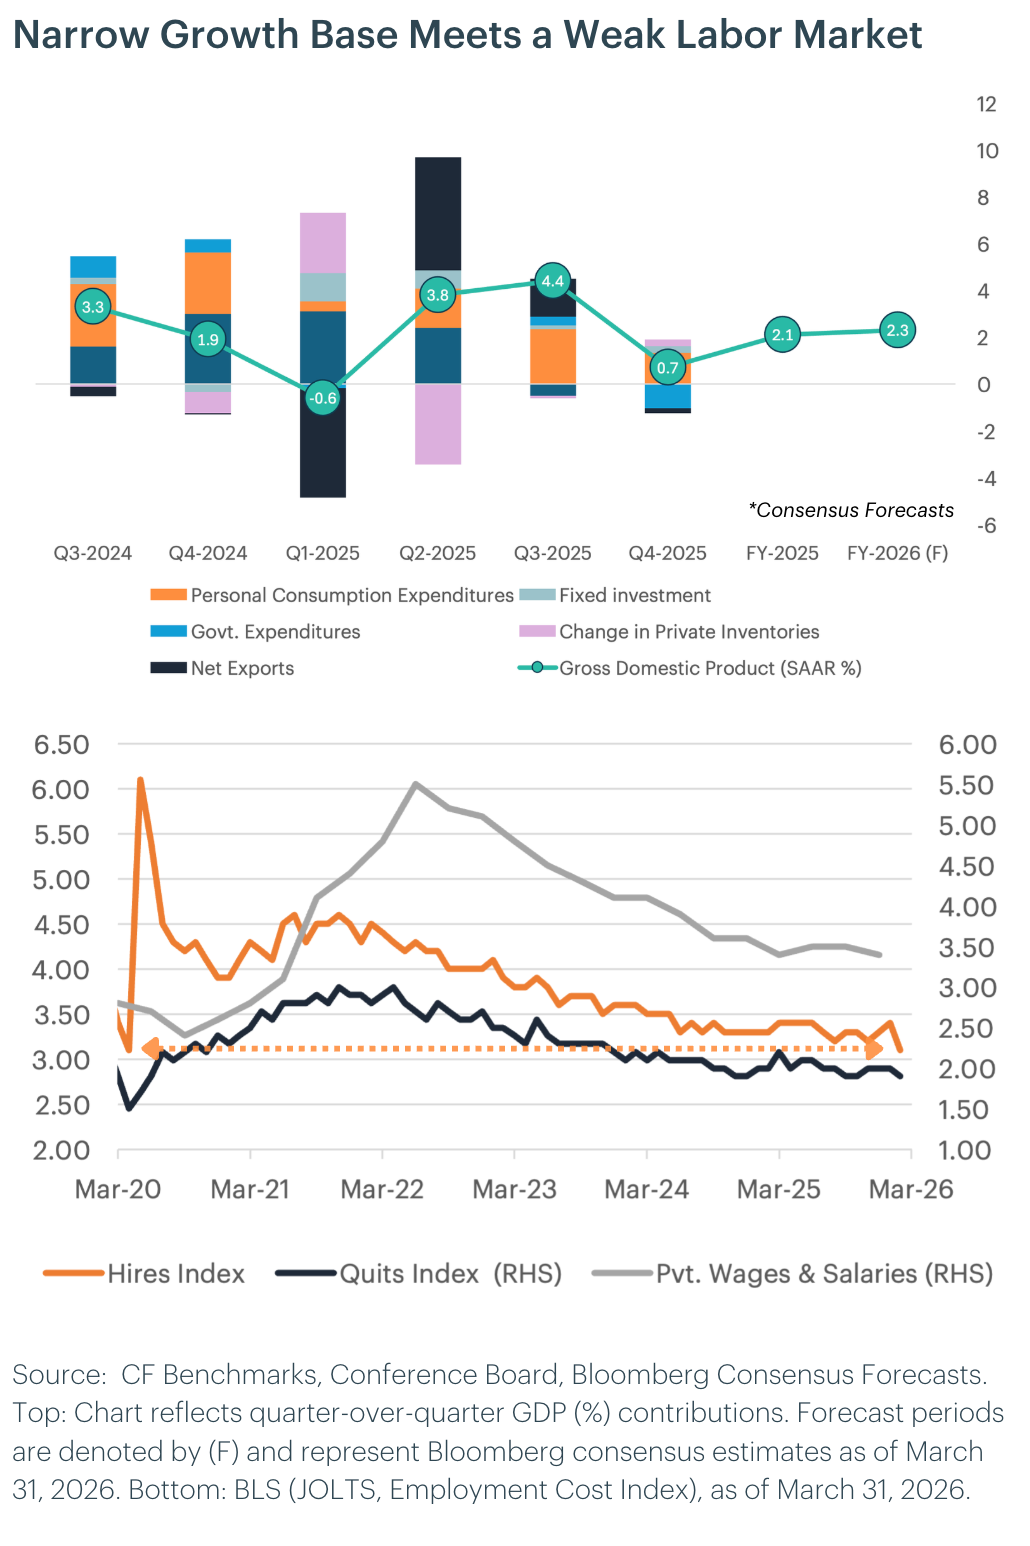
We entered 2026 expecting the One Big Beautiful Bill Act's fiscal impulse to help bolster growth through midyear. That thesis is now under severe strain. Consumer momentum was flagging before the Iran conflict began: real consumption growth had decelerated to a pedestrian annualized pace by early Q1 as depleted savings buffers and sticky inflation compressed purchasing power. The energy shock has made the math worse. Oil prices now exceed the breakeven at which higher fuel costs overwhelm the OBBB Act's tax refund boost, effectively neutralizing the fiscal impulse for most households. Consumer confidence has deteriorated to levels consistent with spending growth near just 1% year-over-year. Q1 GDP will likely print as the strongest quarter of 2026, buoyed by a government spending rebound after the late-2025 shutdown, but the underlying composition is deteriorating; growth is narrowing to AI-driven capital expenditure while broad consumer and business demand softens.
The labor market, which had been cooling gradually, is now showing signs of more acute stress. The private-sector hiring rate has fallen to its lowest level since early 2020, and net job creation turned negative in February for the first time since the pandemic lockdowns. Job openings have resumed their decline, with more timely measures of labor demand turning lower as uncertainty spikes. The quits rate continues to fall, signaling fewer outside options for workers, a dynamic that restrains wage growth but also constrains the consumer spending engine. Critically, the labor market appears too weak to absorb the Iran war inflation shock through a supply-price spiral, which is why we expect the energy-driven inflation impulse to be transitory even as it inflicts real damage on demand. The transmission risk runs through private credit and small business employment, the same channel identified later in our monetary outlook as a possibly underpriced tail risk.
Portfolio Perspective: We expected below-trend GDP growth entering 2026, but the energy shock has widened the downside skew materially, with Q1 likely the high-water mark. If the shock persists and private credit tightens further, labor market deterioration could accelerate into outright employment contraction, triggering the emergency policy response discussed in our monetary outlook. In a below-trend growth environment, assets with structural demand drivers independent of the business cycle, such as AI infrastructure buildout, tokenization adoption, and institutional digital asset allocation, are positioned to outperform broad cyclical exposure.
Measuring Inflation: Two Inflation Regimes Collide
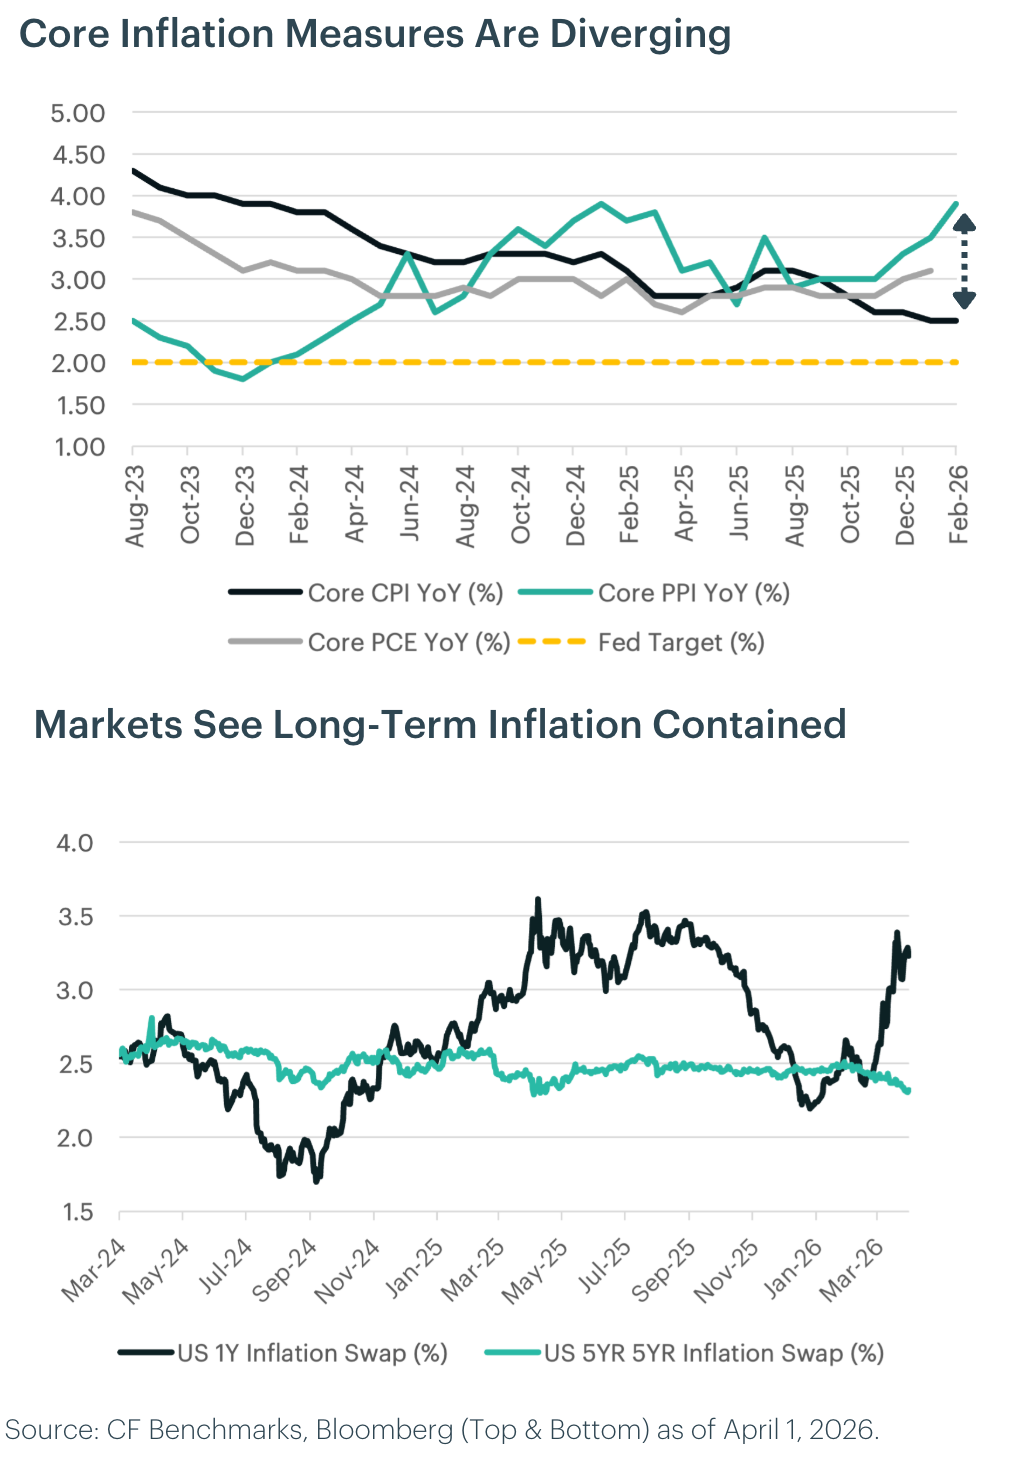
The disinflation thesis we outlined in our prior edition has not been invalidated, but it has been complicated by a supply shock running in the opposite direction. Core PCE inflation was already firming before the Iran conflict, with services prices sustaining upward pressure even as shelter costs began to decelerate. The energy shock has layered a new goods-inflation impulse on top of this stickiness. A global memory chip shortage driven by excess AI hardware demand has simultaneously pushed non-petroleum import prices to their fastest pace since mid-2022, reinforcing core goods pressure just as tariff-related pass-through had nearly run its course. The result is an inflation profile that looks worse near term than the underlying dynamics warrant: shelter is rolling over, unit labor costs are sub-2%, and the quits rate signals further wage deceleration.
Whether the energy shock derails the medium-term disinflation path depends on duration and transmission. Historical Fed rules of thumb suggest that a sustained oil price increase lifts core CPI by only a fraction of the headline impact, and pass-through is negligible if most of the increase reverses within a year. The labor market appears too weak to support a wage-price spiral that would embed the shock. The more dangerous channel is margins: firms facing compressed demand may hold prices firm even as input costs stabilize, delaying disinflation. The FOMC's decision to revise up its PCE forecast while raising its neutral rate estimate reflects this tension, and it is the primary reason the committee remains on hold despite deteriorating growth.
Portfolio Perspective: Our prior call that near-term inflation volatility is transitory rather than indicative of a regime shift stands, but with lower confidence. The base case remains that core inflation decelerates in the second half as demand weakens and shelter disinflation feeds through, but the tail risk of an embedded supply shock has grown. A persistent inflation regime strengthens the case for Bitcoin's fixed-supply store-of-value narrative within the CF Ultra Cap 5 Index, while simultaneously accelerating institutional interest in tokenized real-world assets as onchain proxies for inflation-hedging allocations that traditional portfolios struggle to access efficiently.
Measuring the Fed: A Supply Shock Stalls the Easing Cycle
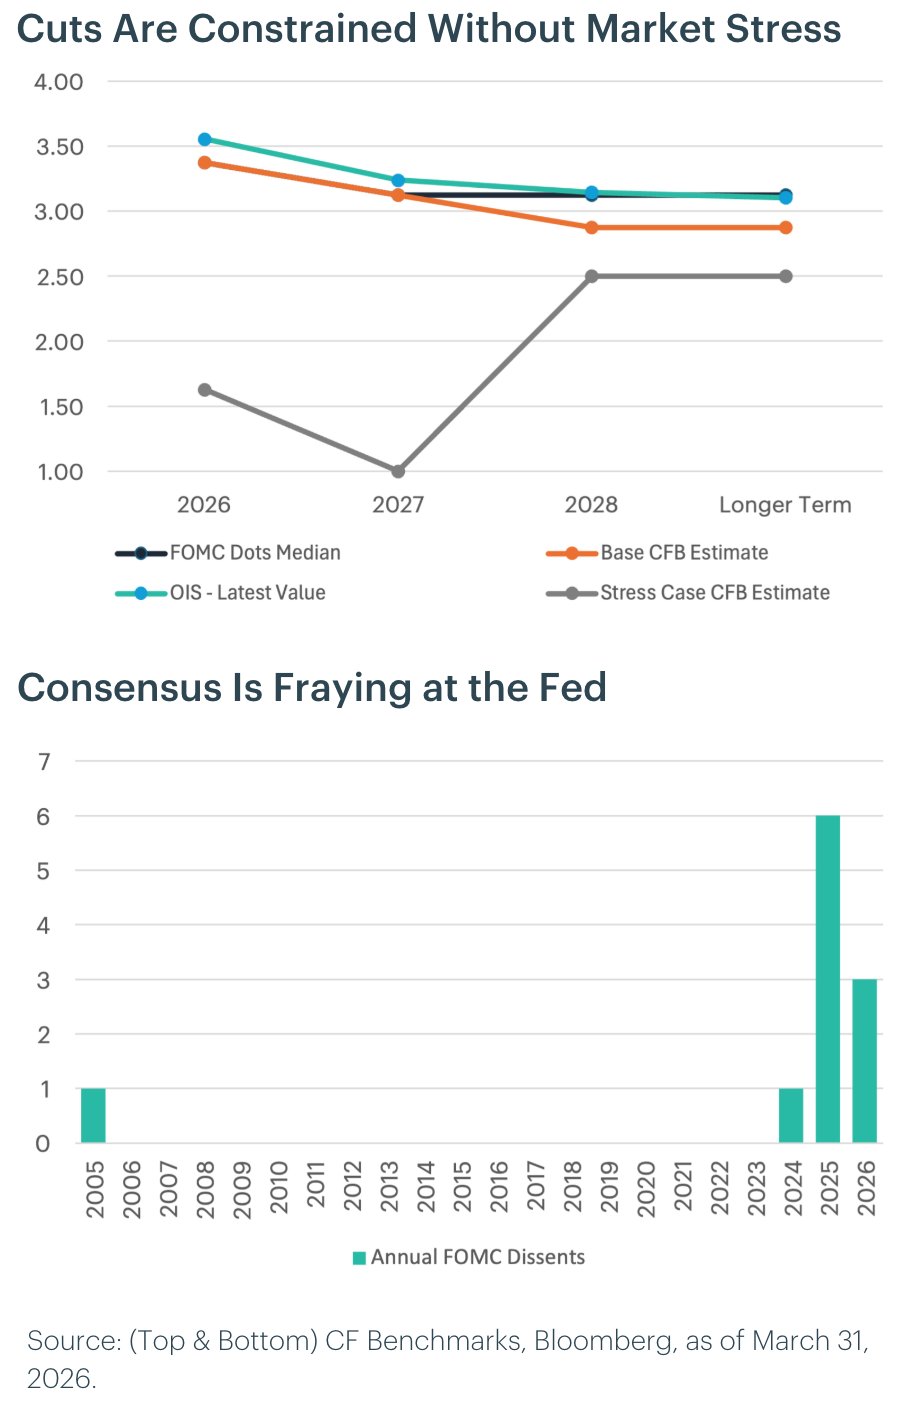
We anticipated five to six rate cuts totaling 125-150bps in 2026, beginning in March. Instead, the committee held at 3.50-3.75% through January and March, with Governor Miran casting the lone dissent in favor of a cut. Two structural shifts explain the gap. The Middle East conflict introduced a supply-driven inflation shock that pushed the dual mandate into direct tension; energy prices pressuring inflation higher while weighing on demand and growth. At the same time, the committee's conviction that AI-driven productivity gains are raising potential growth led it to revise up its neutral rate estimate, even as inflation forecasts moved higher. These forces have tilted risks toward a prolonged hold, with Powell leaving the door open to hikes if the supply shock persists and markets assigning meaningful probability to no cuts at all this year.
President Trump submitted Kevin Warsh's nomination in early March, with confirmation expected before Powell's May 15 term expiry, though the timeline faces friction from Senator Tillis and Democratic opposition on Fed independence grounds. Warsh's hawkish track record ostensibly conflicts with Trump's desire for lower rates, though his stance has shifted; he currently favors easing, driven by confidence that productivity gains allow rates to fall without stoking inflation. Regardless of the rate path, we expect the balance sheet to expand. Holdings stand near $6.6 trillion, down from the $8.5 trillion peak, after T-bill purchases resumed in late 2025. Under stable growth the Fed continues rebuilding reserve buffers; under stress, balance sheet deployment accelerates as the primary policy lever. Private credit is the transmission channel to watch: small businesses hold a disproportionate employment share and face the tightest credit access, and deterioration there could accelerate both rate and balance sheet action.
Portfolio Perspective: Our prior dovish call on rates was premature, but our conviction around balance sheet expansion is tracking. The base case narrows to one 25bps cut in the second half, with the balance sheet expanding regardless of the rate path. The tail risk markets are underpricing: if private credit deterioration forces small business layoffs while the oil shock amplifies demand destruction, the Fed's playbook shifts to intermeeting emergency cuts, historically 50-75bps per action, with cumulative easing of 150-300bps when stress is acute. This asymmetry, a grinding base case against a convex stress scenario, favors exposure to CF Bitcoin Volatility Indices while the basis trading ecosystem benefits from persistent contango as balance sheet expansion improves structural liquidity regardless of which path materializes.
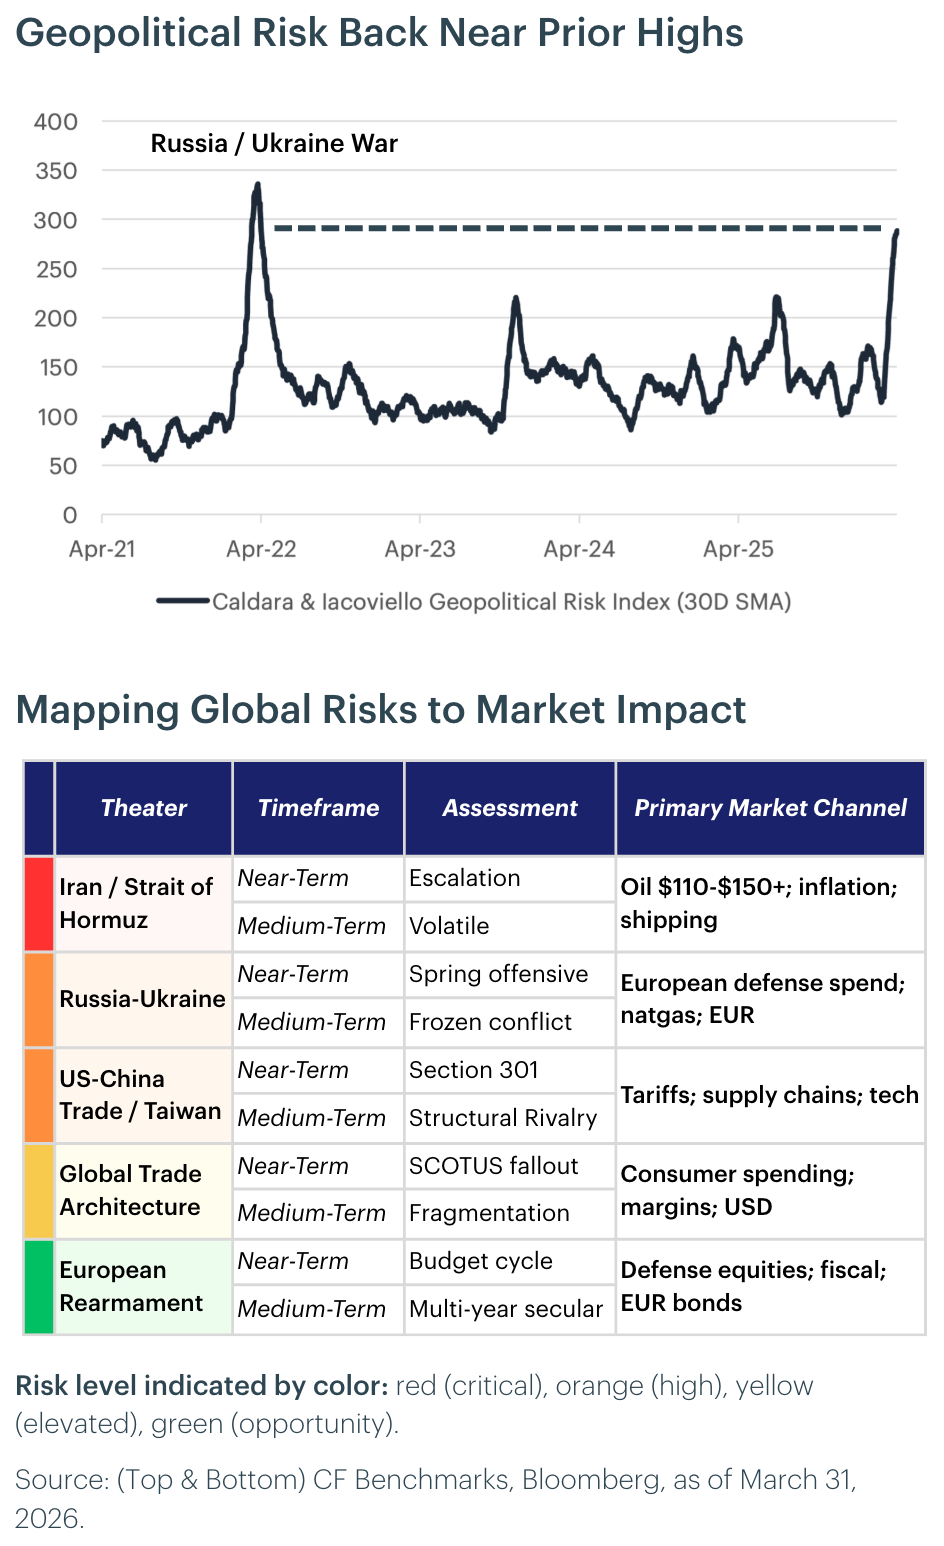
Measuring the Geopolitical Landscape: The Iran Conflict Rewrites the Risk Map
The U.S.-Israel airstrikes on Iran beginning February 28 have produced the largest global oil supply disruption since the 1970s energy crisis. Iran's closure of the Strait of Hormuz, through which roughly one-fifth of global petroleum flows, sent Brent crude above $115 and WTI past $100 within weeks. For markets, the war functions as a simultaneous supply shock and uncertainty shock: the supply disruption drives the inflation dynamics discussed in our inflation outlook, while the uncertainty weighs on investment and hiring detailed in our growth outlook. Conflict duration is now the single most important variable in our macro framework. A swift resolution reopens the Strait, normalizes energy prices, and gives the Fed room to cut. A protracted conflict transforms the stagflationary risk from a tail scenario into the base case, compressing the Fed's optionality and accelerating the private credit stress channel flagged across our macro sections.
The Supreme Court's February 20 ruling striking down IEEPA tariffs (6-3) forced a rapid restructuring of U.S. trade architecture. The administration replaced them with a flat 10% surcharge under Section 122 (capped at 150 days) while USTR launched Section 301 investigations into 16 trading partners to build a permanent framework. Trade friction will persist in a new legal form even as specific rates evolve. For digital assets, the regulatory trajectory is moving in the opposite direction. The GENIUS Act established the first federal framework for payment stablecoins, with implementing regulations due by July 2026, and the SEC-CFTC memorandum of understanding signed March 11 produced joint guidance clarifying how securities laws apply to crypto assets. This is the most constructive regulatory environment digital assets have experienced in the U.S., accelerating institutional adoption at a moment when macro uncertainty would otherwise be a headwind.
Portfolio Perspective: This is the first edition to include a dedicated geopolitical section, reflecting our view that the Iran conflict and the regulatory buildout are primary drivers of risk and opportunity, not background noise. The war's duration determines whether the macro outlook resolves toward the dovish or stagflationary scenario; the regulatory buildout determines the pace of institutional onboarding. Digital assets' 24/7 market access has already served as a clear catalyst for defensive positioning during weekend geopolitical escalations, reinforcing the asset class's role in real-time risk management. The convergence of stablecoin regulation under the GENIUS Act and SEC-CFTC jurisdictional clarity creates a structural tailwind for the CF DeFi Composite Index, as compliant onchain infrastructure becomes investable at institutional scale for the first time, while prediction market protocols positioned to price geopolitical event risk in continuous session represent an emerging category we expect to track in future editions.
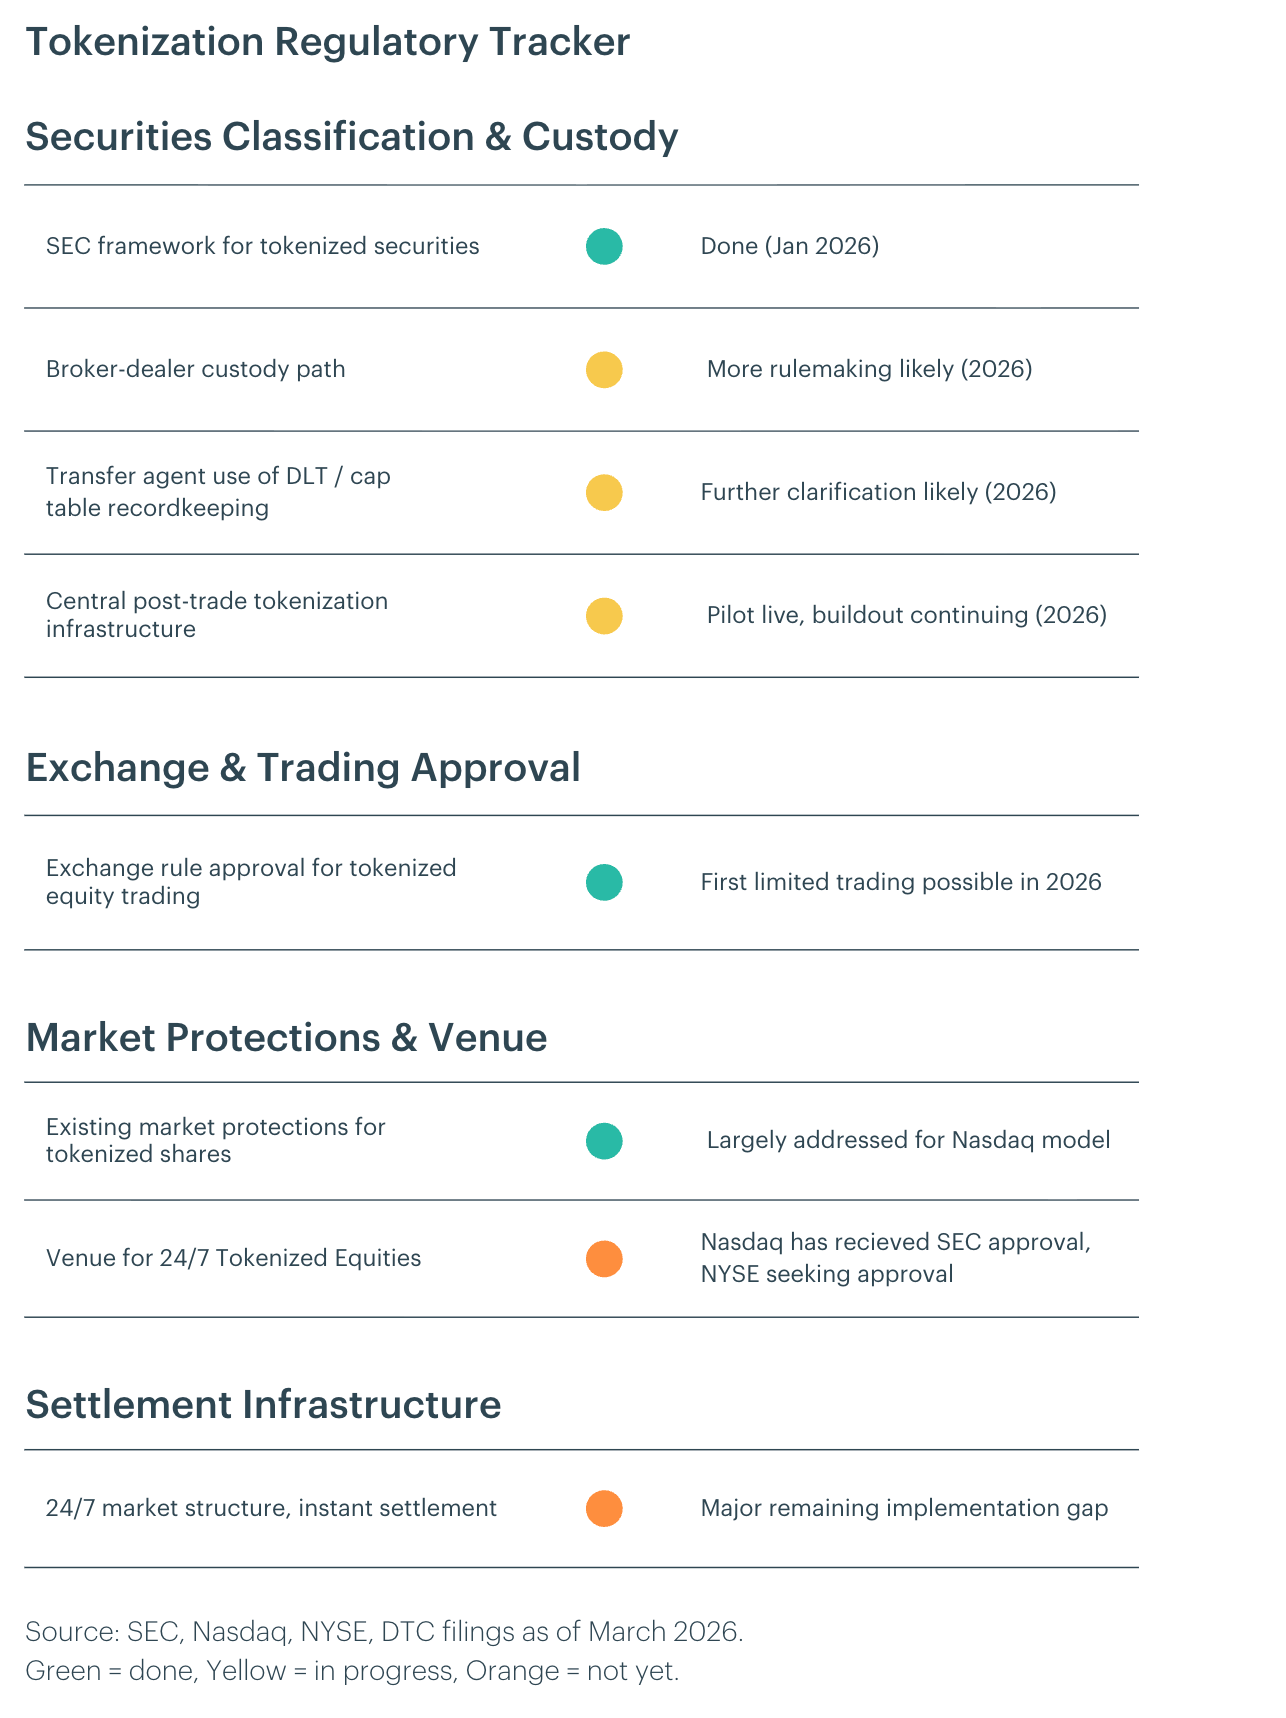
Measuring the Regulatory Environment: Tokenized Equities Move Toward Production
The regulatory path for tokenized equities is materially clearer than it was a year ago, with regulators explicitly treating tokenized equities as existing securities represented on new infrastructure rather than a new asset class. Nasdaq has already received SEC approval to trade certain securities in tokenized form once DTC infrastructure is live. In parallel, NYSE is actively building a separate 24/7 tokenized venue with stablecoin-based funding and instant settlement, and says it will seek the necessary regulatory approvals. On the post-trade side, DTC has received no-action relief for a preliminary tokenization program on supported blockchains, serving as a gating dependency for production-scale clearing and settlement of tokenized shares.
The SEC staff has outlined a framework for tokenized securities, broker-dealer custody under Rule 15c3-3(b)(1), and DLT-enabled transfer agent recordkeeping. While these interim measures leave meaningful gaps, including the treatment of stablecoins within securities market infrastructure, secondary market liquidity fragmentation, and the full scope of broker-dealer obligations, the remaining work now looks increasingly operational and venue-specific rather than purely definitional. Our base case is that limited, venue-specific U.S. tokenized equity trading before the end of 2026 is a credible scenario, particularly as offshore jurisdictions continue to advance tokenized equity frameworks more quickly, with the remaining hurdles most likely to be addressed in 2H 2026 as venue infrastructure matures and the SEC completes additional rulemaking.
Portfolio Perspective: Regulatory clarity around tokenized equities is likely to drive initial onchain issuance and settlement over the next 12 to 18 months. We expect established layer-1s such as Ethereum and Solana to benefit most, given their institutional adoption, liquidity, and infrastructure maturity, positioning them to capture increased activity across settlement and collateralization.
Measuring Bitcoin's Relative Value: The Catch-Up Trade Deepens
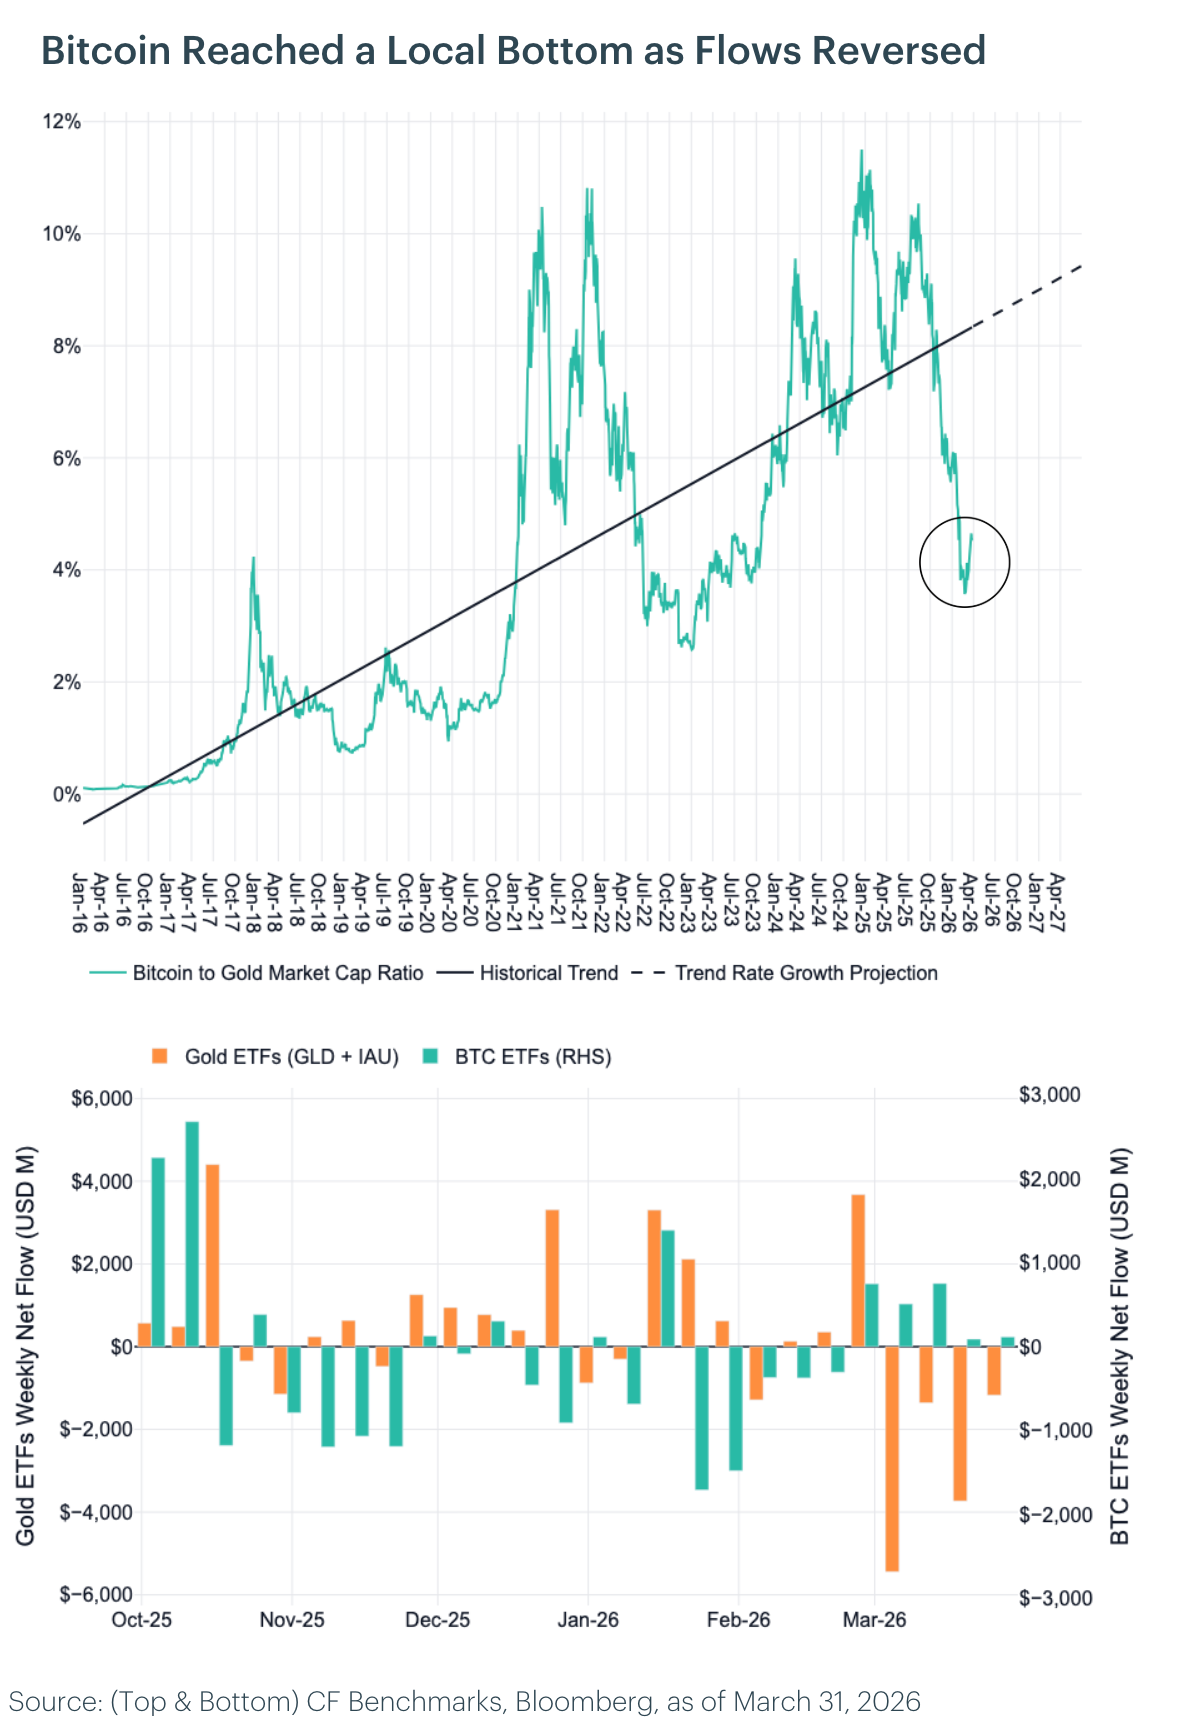
In our Q4 2025 outlook, we identified the Bitcoin-to-gold market cap ratio as a key relative valuation framework and flagged the ratio's decline below its long-term trend as a tactical opportunity. Since that publication, the dislocation has deepened considerably. Gold has continued its historic rally, rising above $4,900 per ounce in March 2026, while Bitcoin has retraced from its late-2025 highs to trade near $70,000. The result is a sharp widening of the gap between Bitcoin's realized market cap share and its trend-implied share of gold's total value.
As of mid-March 2026, the Bitcoin-to-gold market cap ratio has fallen to approximately 4.1%, well below the long-term trend of roughly 7.8%. That places Bitcoin nearly 47% below its trend-implied valuation on this metric, a significant deterioration from the 24% gap observed at the end of November 2025. Importantly, recent fund flow data suggests the inflection may already be underway. Since the beginning of March, gold-focused products have seen persistent outflows while Bitcoin funds have attracted steady inflows. This rotation is likely driven by retail investors selling gold as price momentum has exhausted following the rally above $4,900. The Bitcoin-to-gold market cap ratio appears to have bottomed at the end of February 2026 and has since been trending higher in favor of Bitcoin, consistent with early-stage mean reversion.
Applying the same mean-reversion framework from the prior outlook, the trend-rate projection implies the ratio could reach approximately 9.1% by year-end 2026. Using gold's current market capitalization of roughly $34 trillion, convergence back to trend would be consistent with a Bitcoin market cap of around $3.1 trillion, or a price of approximately $156,000 per coin. From current levels near $70,000, that represents potential upside in excess of 120%, making this the most attractive entry point for the catch-up trade since we began tracking this framework.
Portfolio Perspective: The catch-up trade has become meaningfully more compelling since our initial Q4 2025 publication. With the ratio nearly 47% below trend and fund flows now shifting in favor of Bitcoin, the risk-reward profile for Bitcoin relative to gold is at its most favorable level in over two years. We continue to view mean reversion in this ratio as a central theme for 2026 and consider the current dislocation a high-conviction tactical opportunity for allocators with appropriate risk tolerance.
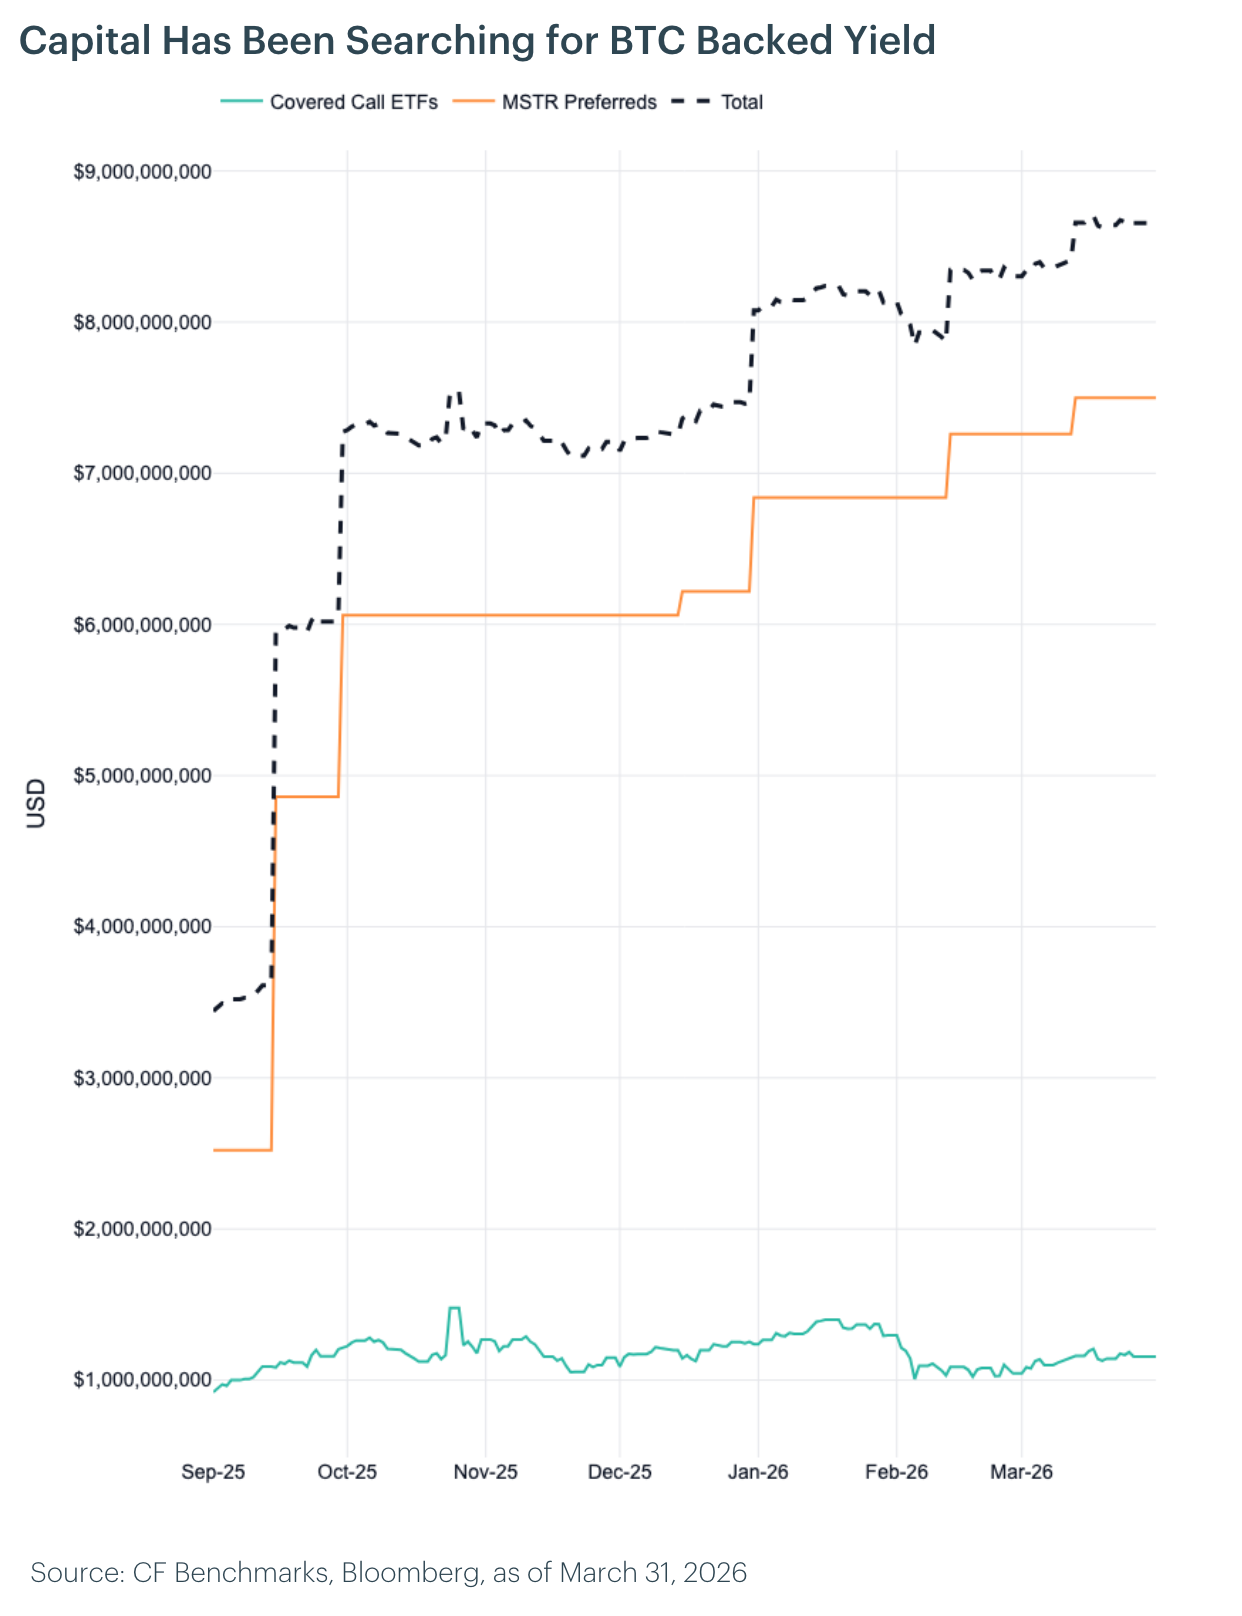
Measuring Structured Products: BTC Yield Products to Nearly Double
The market for Bitcoin-backed yield products has grown rapidly, with total capital across covered call ETFs and perpetual preferred instruments now exceeding $8 billion. The majority sits in Strategy Inc.'s preferred equity stack, which has raised over $7.5 billion across five series through IPO offerings and ATM programs. Covered call ETFs such as BTCI have demonstrated strong asset gathering, growing from under $50 million to nearly $1 billion in 2025 alone.
We expect total capital in these products to nearly double over the next 12 months, exceeding $15 billion by early 2027. The primary driver will be covered call funds, scaling to $5 billion in AUM. Bitcoin volatility has remained structurally elevated, increasing option premium income and making these strategies more attractive to yield-seeking allocators. The CME CF BVX Index has traded in a range of roughly 35 to 65 over the past 15 months, with the current reading near 53, well above the lows near 35 reached in the summer of 2025. BlackRock has signaled its intention to launch a Bitcoin covered call ETF, bringing significant distribution power and likely accelerating inflows from advisory channels. The remaining growth should come from preferred instruments at a more moderate pace, reaching $10 billion total, or roughly $2.5 billion in additional issuance.
Portfolio Perspective: The growth of Bitcoin-backed yield products introduces a structural source of implied volatility supply, as covered call funds systematically sell upside convexity. As AUM in these strategies scales, the increasing notional of options overwriting should place persistent downward pressure on implied volatility, particularly in the front end. A more stable volatility regime should improve Bitcoin's risk-adjusted return profile by compressing drawdowns and reducing the volatility risk premium, strengthening its case as an allocation within diversified portfolios.
Measuring Stablecoin Growth: Stablecoins to Reach $350 Billion
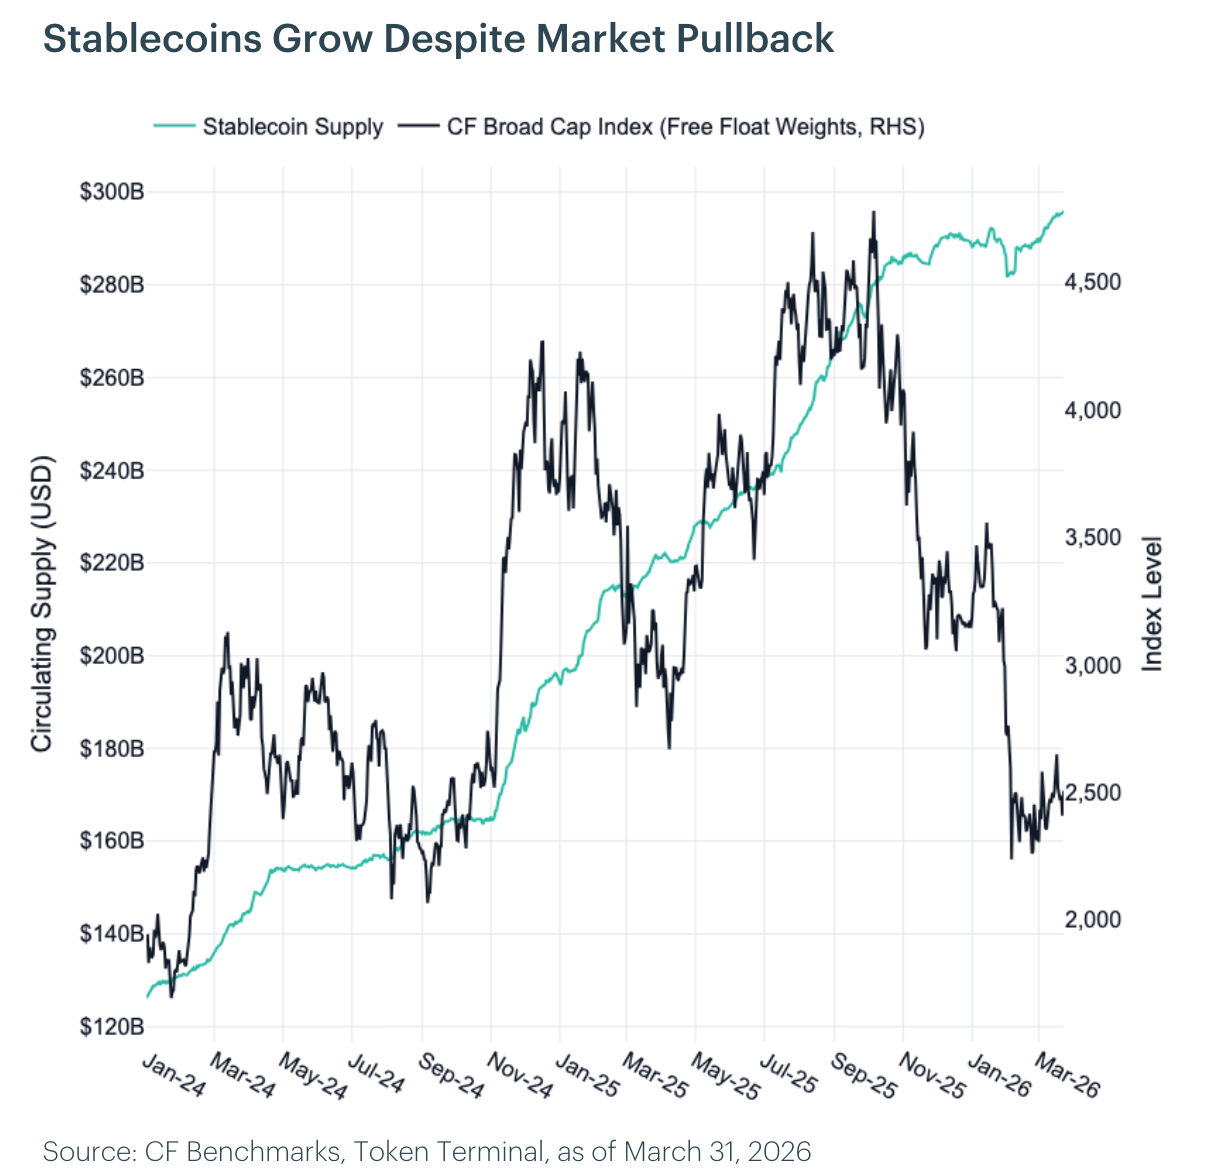
The total stablecoin market capitalization reached approximately $312 billion in March 2026, having grown over 50% year-over-year from roughly $220 billion in March of 2025. Notably, stablecoin supply continued to expand even as the broader crypto market pulled back in Q1 2026, suggesting a structural decoupling from speculative risk appetite. USDT remains the dominant issuer at $187 billion (roughly 60% market share), while Circle's USDC has grown to $75.7 billion and captured a growing share of stablecoin transaction volume in early 2026.
We expect total stablecoin supply to exceed $350 billion over the next 12 months, implying continued growth broadly in line with the expansion observed over the past year. Two primary demand drivers support this trajectory. First, payments adoption is accelerating meaningfully: Visa's stablecoin-linked card spend reached a $3.5 billion annualized run rate in late 2025, growing 460% year-over-year, while stablecoin-based B2B payments surged from under $100 million monthly in early 2023 to over $6 billion by mid-2025. Cross-border remittances settled in stablecoins reached a $19 billion annualized rate. Second, onchain trading activity continues to absorb stablecoin supply as decentralized exchanges and perpetual futures platforms use USDC and USDT as primary settlement and margin assets. Adjusted stablecoin transfer volume reached $33 trillion in 2025, up 72% year-over-year, and is expected to exceed $1 trillion monthly by end of 2026.
Ethereum currently hosts approximately 65% of total stablecoin supply at roughly $166 billion, supported by deep DeFi liquidity and institutional-grade infrastructure for settlement and issuance. Solana, while holding a smaller share of total supply at roughly $14 billion, has emerged as a leading chain by stablecoin transaction volume, with USDC transfers on Solana surpassing Ethereum in late 2025 due to its high throughput and low transaction costs.
Portfolio Perspective: Layer-1 blockchains are the primary beneficiaries of stablecoin growth, serving as the core settlement layers for payments and onchain trading activity. As supply expands, networks within the CF Web 3.0 Smart Contract Platform Index should see increased transaction demand, driving sustained demand for blockspace. This dynamic reinforces their role as core portfolio exposures to the growth of the onchain dollar economy.
Measuring Agentic Activity: Agents Onchain to Grow
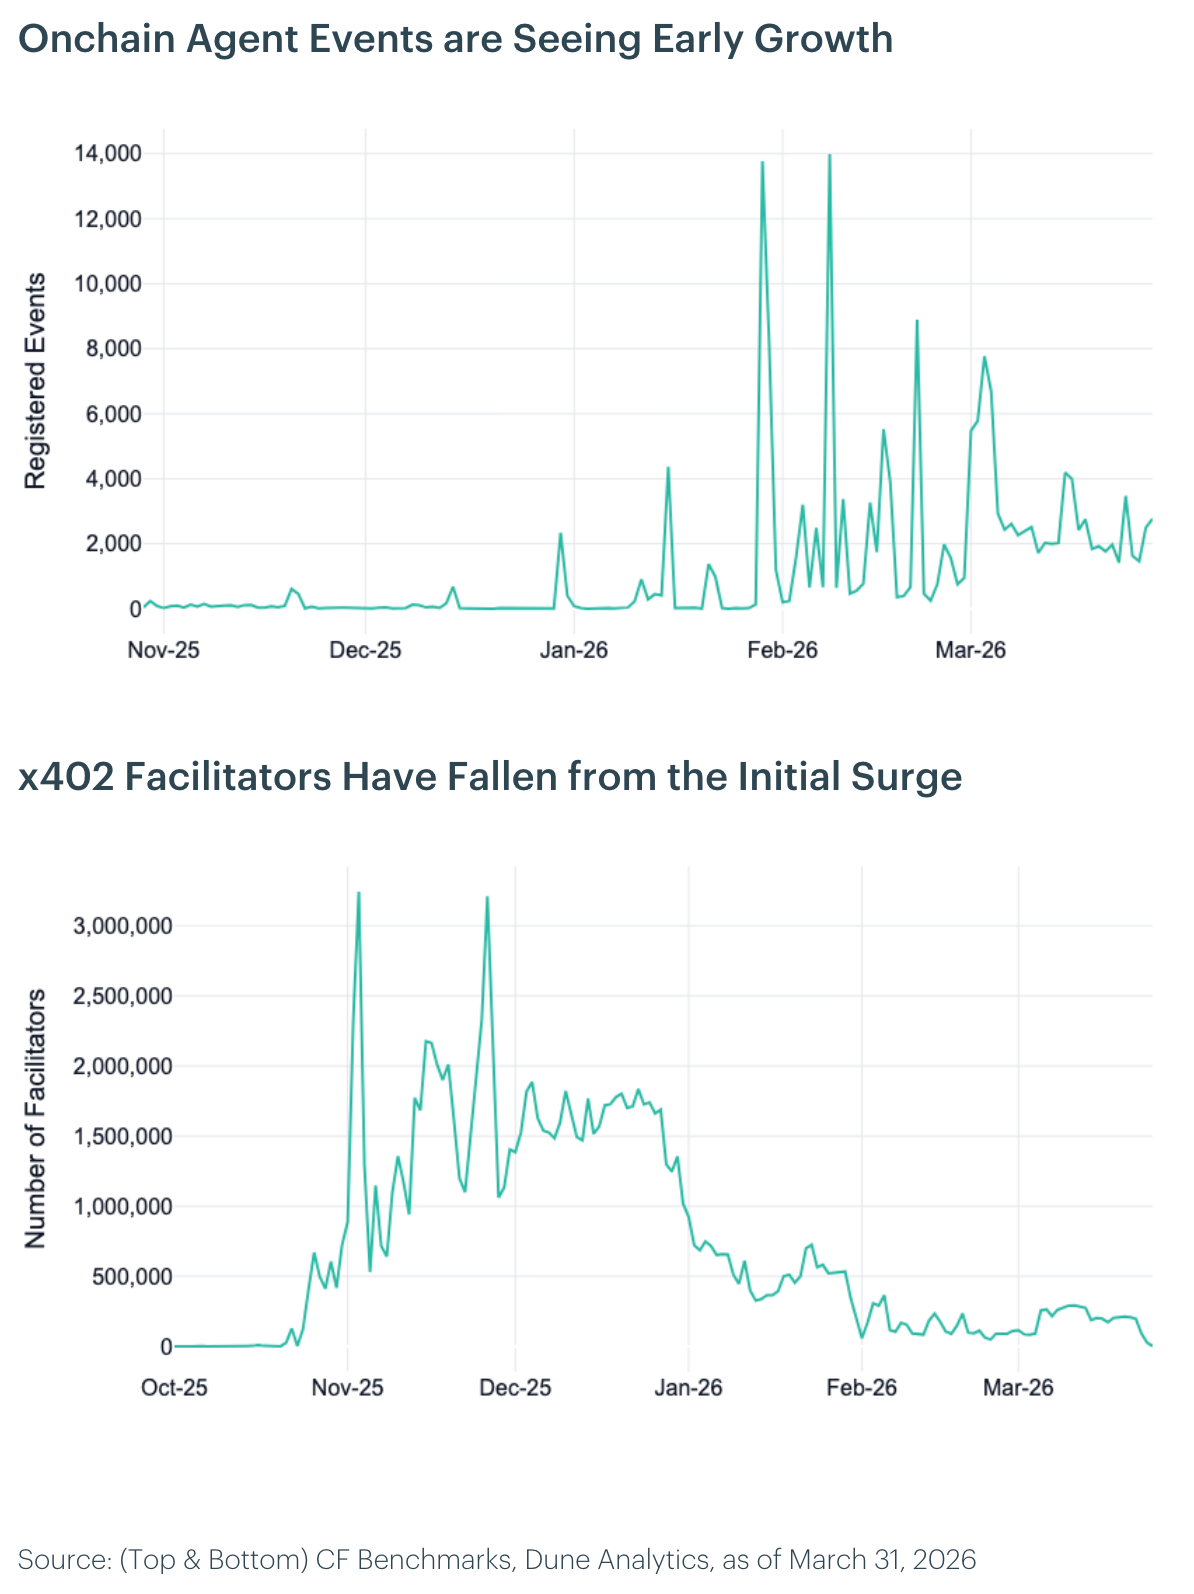
The x402 protocol, an open payment standard that embeds stablecoin micropayments directly into HTTP requests, is emerging as foundational infrastructure for autonomous agent commerce. By enabling AI agents and software services to transact programmatically, x402 establishes a native payments layer for the machine economy and introduces a structurally new source of stablecoin demand. Facilitators, which verify and settle x402 payments, have grown to approximately 3 million since launch, with adoption accelerating following Stripe's integration for USDC payments on Base in February 2026. As agent-driven use cases scale, we expect not only continued growth in facilitator counts but also a meaningful increase in payment frequency and stablecoin velocity, reinforcing a positive feedback loop between agent activity and onchain settlement demand.
ERC-8004, the Ethereum standard for trustless agents launched in January 2026, provides the identity, discovery, and reputation infrastructure required for autonomous onchain coordination. It enables agents to register onchain, advertise capabilities, discover counterparties, and build verifiable reputations based on prior interactions. Within DeFi, this allows agents to programmatically source liquidity, route trades across venues, manage collateral, or rebalance positions by interacting directly with protocols or other agents in real time. We expect event volumes to remain elevated through 2026 as developer adoption expands and agent capabilities mature.
Portfolio Perspective: The growth of agentic payments is likely to disproportionately benefit DeFi infrastructure tokens, particularly those within the CF DeFi Composite Index. As autonomous agents transact onchain, demand for permissionless exchanges, lending markets, and middleware should increase, positioning DeFi as the natural choice for machine-to-machine commerce. DeFi tokens offer direct and indirect exposure to rising transaction volumes, fee generation, and liquidity utilization.
Measuring the Crowd: Consensus Forecasts
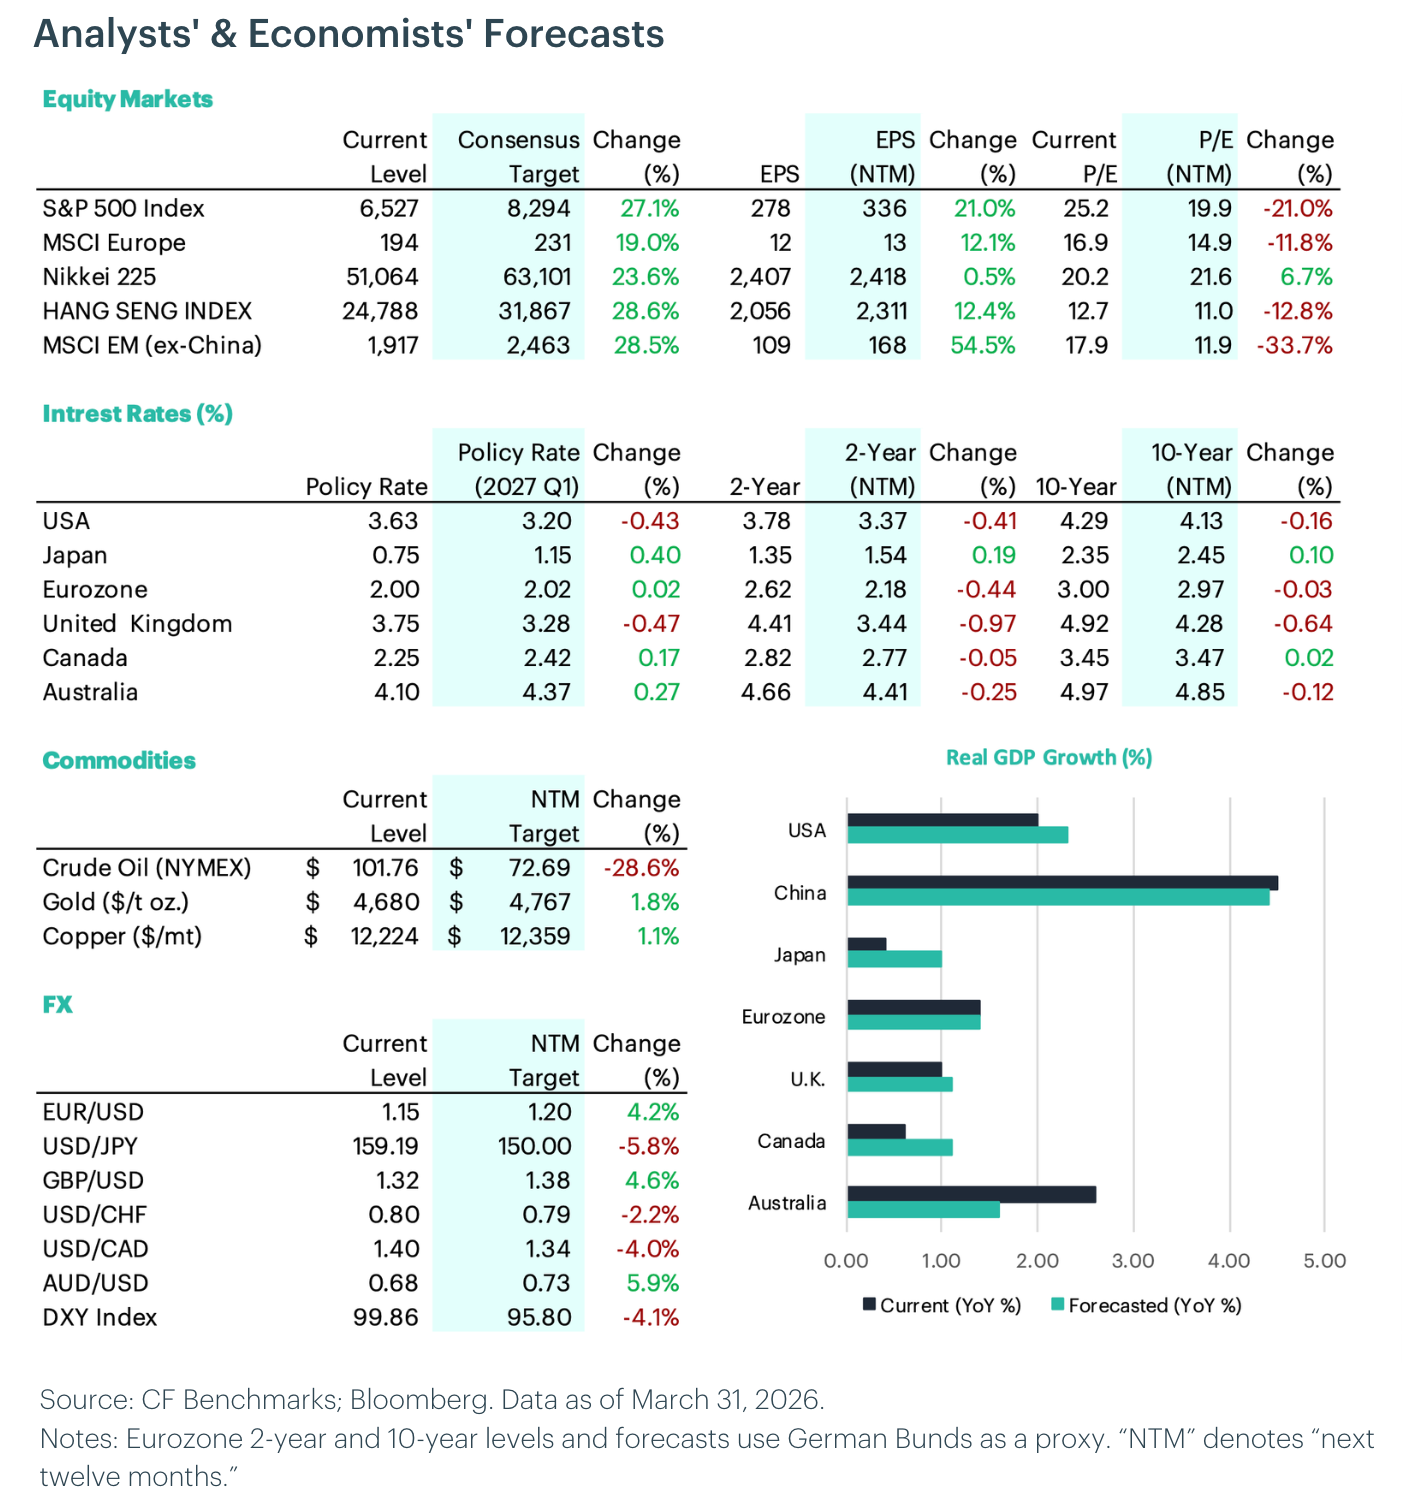
Equities: Analysts maintain a broadly positive outlook for equities, with the Hang Seng Index (+28.6%) and emerging markets ex-China (+28.5%) leading major forecasts. European markets (+19.0%) and Japan (+23.6%) are also expected to perform well. U.S. equities are forecast to rise 27.1%, with S&P 500 earnings per share projected to grow by 21.0%. Valuation multiples are expected to contract across major markets, with the S&P 500's P/E falling 21.0%, suggesting price gains are driven entirely by earnings growth rather than multiple expansion.
Interest Rates: Policy rate forecasts show divergent shifts across developed markets, with the U.S. expected at 3.20% by year-end (currently 3.63%), the U.K. at 3.28% (from 3.75%), and Australia at 4.37% (from 4.10%). Canada is projected at 2.42% (from 2.25%), while Japan is forecast at 1.15% (from 0.75%). The Eurozone is expected to hold near current levels at 2.02%.
Commodities: Gold is forecast to rise 1.8%, reflecting steady investor demand for real assets amid macro uncertainty. Crude oil is expected to decline sharply (-28.6%), pointing to significantly softer demand expectations. Copper is projected to rise 1.1%, suggesting a modest uptick in industrial activity expectations.
FX: The U.S. dollar is expected to weaken, with the DXY Index down 4.1%. The yen is projected to appreciate sharply (+5.8%) on policy divergence, while gains are also expected in the euro (+4.2%), pound (+4.6%), and Australian dollar (+5.9%).
GDP Growth: Growth forecasts show continued regional divergence. China is expected to lead with growth of 4.4%, while the U.S. is projected at 2.3%. Canada (1.1%) and the Eurozone (1.4%) are forecast to improve modestly, while Australia is expected to moderate to 1.6%. Japan (1.0%) and the U.K. (1.1%) are likely to see slower growth.
Measuring Return Assumptions: 2026 Bitcoin Capital Market Assumptions
Capital market assumptions provide institutional investors with forward-looking projections of expected returns, volatility, and correlations that guide strategic asset allocation decisions. As Bitcoin matures into an institutional asset class, developing rigorous capital market assumptions becomes essential for allocators evaluating its role within diversified portfolios.
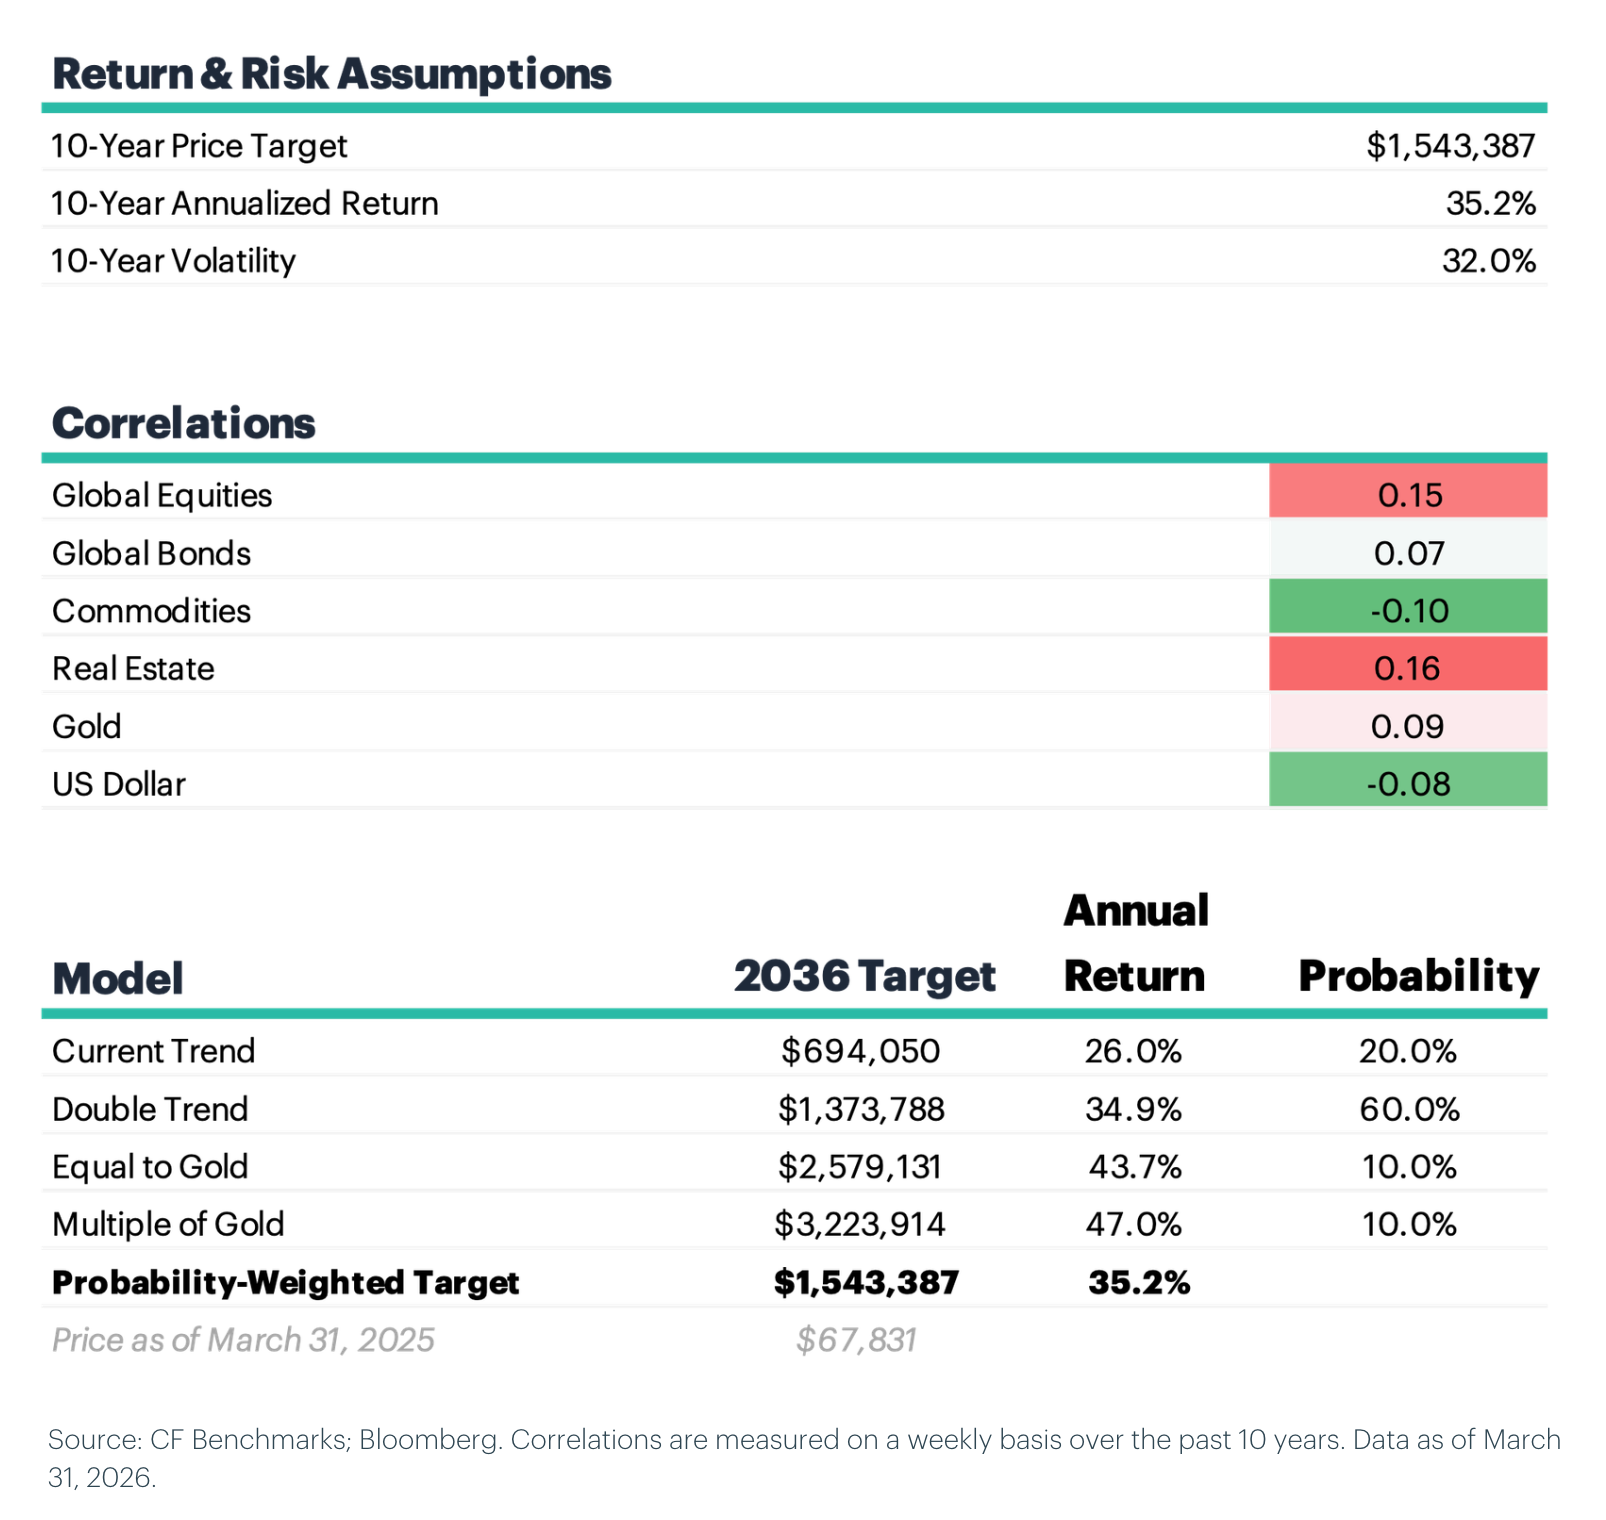
Returns: Our 2026 capital market assumptions project a 10-year annualized return of 35.2% with a probability-weighted 2036 price target of $1,543,387. The price target incorporates probability-weighted scenarios in the store-of-value market, assigning 60% weight to double-trend growth, 20% to current trend continuation, and 10% each to gold parity and gold outperformance.
Volatility: We project long-run volatility using a two-stage decay model that extends the historical compression trend while assuming diminishing marginal declines. The model applies half the historical pace over the next five years (approximately -3.5% annually) reaching 37.0% by 2031, then halves the decay rate (approximately -1.75% annually) to roughly 32.0% by 2036.
Correlations: Our capital market assumptions project Bitcoin's correlations remaining low across asset classes: 0.15 to global equities, 0.07 to global bonds, -0.10 to commodities, 0.16 to real estate, 0.09 to gold, and -0.08 to the US dollar.
To read the our full market outlook report, please click here.
The information contained within is for educational and informational purposes ONLY. It is not intended nor should it be considered an invitation or inducement to buy or sell any of the underlying instruments cited including but not limited to cryptoassets, financial instruments or any instruments that reference any index provided by CF Benchmarks Ltd. This communication is not intended to persuade or incite you to buy or sell security or securities noted within. Any commentary provided is the opinion of the author and should not be considered a personalised recommendation. Please contact your financial adviser or professional before making an investment decision.
Note: Some of the underlying instruments cited within this material may be restricted to certain customer categories in certain jurisdictions.
Changes to the Token Market Price Benchmarks Series - Market Prices – 14 July 2026
Changes to the Token Market Price Benchmarks Series - Market Prices – 14 July 2026

CF Benchmarks
Bitcoin ETF Outflow Streak Ends as BVX Falls to a 12-Month Low
Digital assets traded mixed over the week: ETF inflows returned and the mega caps carried our headline indices, while high-beta names and diversified breadth lagged. DeFi led the themes, meme coins absorbed a governance attack, implied volatility kept compressing.
Gabriel Selby
Factor Friday - July 10, 2026
The relief rally extended for a second week with Market +2.27%, but the real story is risk appetite: Liquidity led styles at +1.51% as thinner, less liquid names caught a bid. Value paused at -0.79% yet still leads over four weeks. Defensive tilts kept unwinding into the bounce.
Mark Pilipczuk
By clicking Accept, you consent to CF Benchmarks's use of cookies.
Visit Cookie Settings to learn how CF Benchmarks uses cookies and to adjust your preferences.