
Aug 31, 2026
CME CF Crypto Market Index: Constructing the Institutional Measure of the Digital Asset Market
A benchmark for digital assets has to hold three things together. It has to be replicable, which means every constituent must be tradeable, custodiable and sized on free float that a licensee can actually buy. It has to be representative of the asset class, whose leadership, economic roles and codebases turn over faster than any equity market. And it has to be resistant to manipulation, because a measure that a thinly traded constituent can move is not a benchmark. Holding every large digital asset in proportion to its free-float satisfies none of the three. It takes no view on whether an asset can be held, no view on whether its role in the market is real, and no view on whether its price can be pushed.
The CME CF Crypto Market Index (CMI) is built to answer all three. Its methodology sets requirements for market access, custody, liquidity, codebase distinctiveness and durable economic role, applies free float and regulatory controls, and holds the twelve highest ranked assets that qualify. Liquidity requirements and free float weighting are what stop a thinly traded asset from acquiring a weight it cannot support. That is a substantial amount of construction work relative to a market capitalization cut, and the question this piece answers is what the work was worth.

Over the three years ending July 15, 2026, it was worth 12.2 percentage points and all of the alpha. A broader fifty asset free float measure, the same universe held without eligibility requirements, returned 65.4% and generated no alpha against the Broad Cap proxy. CMI returned 77.6% and generated 11.5% of Jensen alpha.
CMI is not built to outperform Bitcoin, and over this window it did not meaningfully outperform a two asset Bitcoin and Ether core. That comparison is taken up below. All results here are backtested and are not predictive of future performance.
The Comparison That Matters
The test for a rules-based benchmark is whether the methodology did any work relative to holding the eligible universe mechanically. Whether it beat the largest single asset is a different question, and not one a benchmark is built to answer.
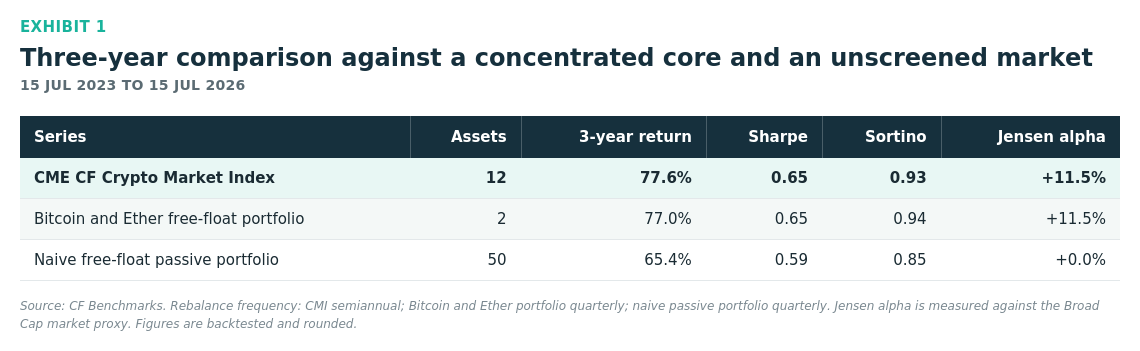
Against the broader measure the gap is wide. CMI returned 12.2 pp more over the window, with a higher Sharpe ratio, a higher Sortino ratio, and 11.5% of Jensen alpha against none. That broader measure is what "broad crypto market exposure" usually means in practice. Hold the eligible universe, weight it by free float, rebalance on a calendar. It earned nothing above the proxy.
Three requirements did that work. Product market fit pathways ask whether an economic role has persisted. Distinctiveness rules stop copied code from inheriting an established role. Infrastructure tests require that an exposure be tradeable and custodial before the index holds it.
All three work through concentration. Each requirement removes assets from the eligible set, and in a free float market the assets removed are overwhelmingly small. The surviving portfolio is therefore more concentrated in the largest networks than the universe it was drawn from. That is why CMI's return profile sits close to a Bitcoin and Ether core and well above the broader fifty. The methodology produced the concentration, and the concentration produced the return. The 11.5% is not evidence that eligibility rules add value independently of what they do to weights.
This is a directional construction test on one three year window, not a tracking error study. It shows that the methodology changed the portfolio and that over this period the change mattered. It does not show that a rules-based portfolio must outperform in future cycles. CMI held twelve assets at the 13 August 2026 backtest endpoint. Bitcoin was 72.6% of the portfolio. Bitcoin, Ether and BNB together were 88.9%. The effective number of constituents, one divided by the sum of squared weights, was 1.83.
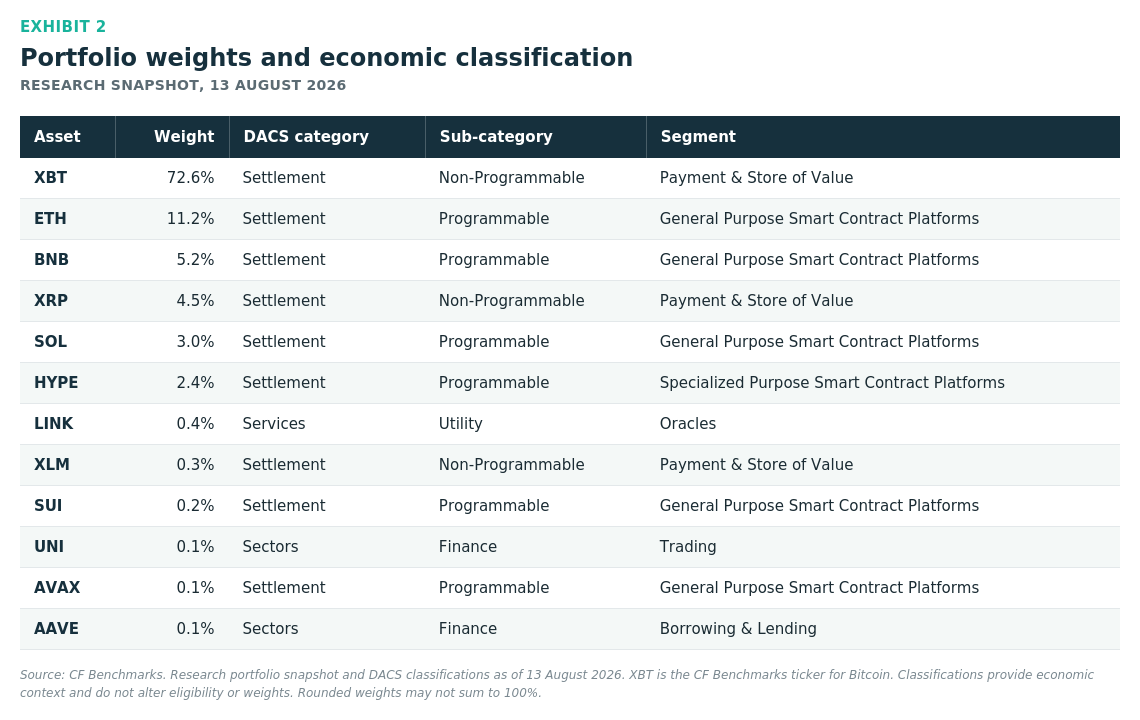
That concentration is usually read as a limitation. It is a requirement. A free float benchmark of a market dominated by Bitcoin has to be dominated by Bitcoin. Producing any other Bitcoin weight would mean imposing a cap, a tilt or an equal weight scheme, and that turns a benchmark into a strategy.
It also explains the close result against the two asset Bitcoin and Ether core. CMI returned 77.6% against 77.0%, with an identical Sharpe ratio and identical alpha. At an effective breadth of 1.83, two portfolios anchored on the same two assets have to produce similar numbers. That agreement is arithmetic, and it is the same arithmetic that made the gap against the broader fifty as wide as it was.
The Tail Is Where the Fundamentals Are
At the snapshot date, Bitcoin, Ether and BNB held 88.9% of index weight and accounted for 13.0% of July 2026 protocol fees. The other nine constituents held 11.1% of weight and accounted for 87.0%. HYPE, UNI and AAVE alone, 2.6% of the portfolio, accounted for 74.7%.
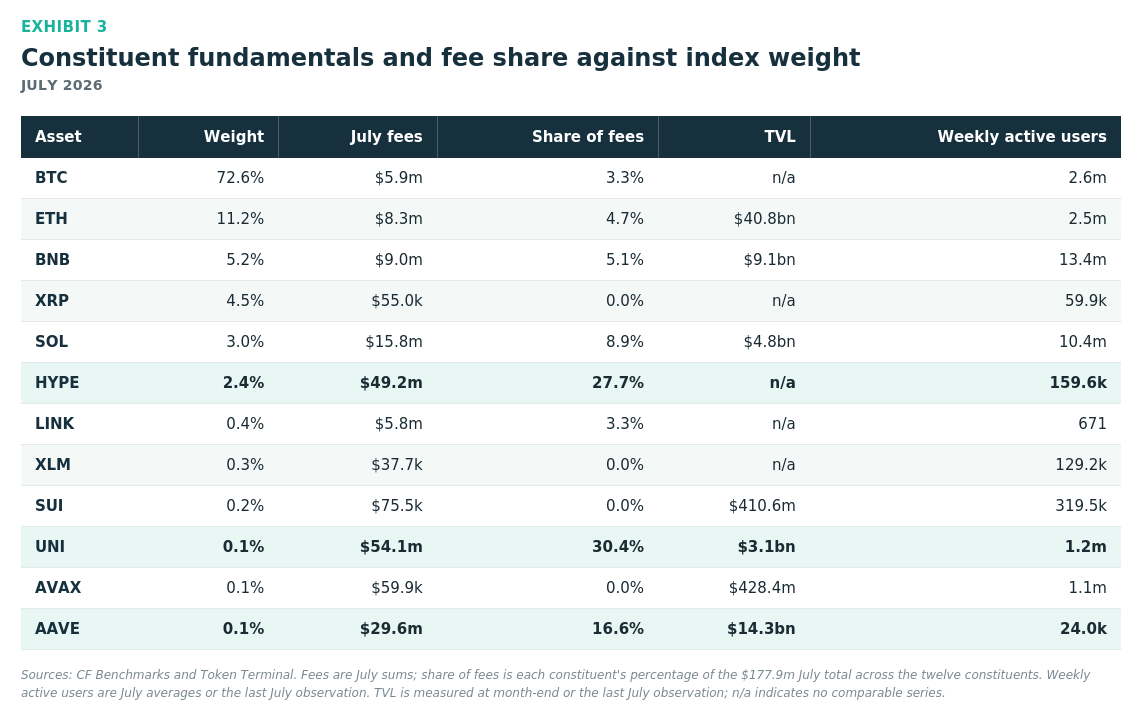
Fee definitions are not harmonized across constituent types. Bitcoin's figure is miner fee revenue, while Uniswap's and Aave's are substantially liquidity provider and supplier side revenue. None of this is automatically cash flow to tokenholders, so read it as activity intensity rather than value accrual. Read that way, the finding still changes what breadth is for. The smallest weights carry the index's trading, lending, oracle and specialized platform exposure. They are not there for completeness.
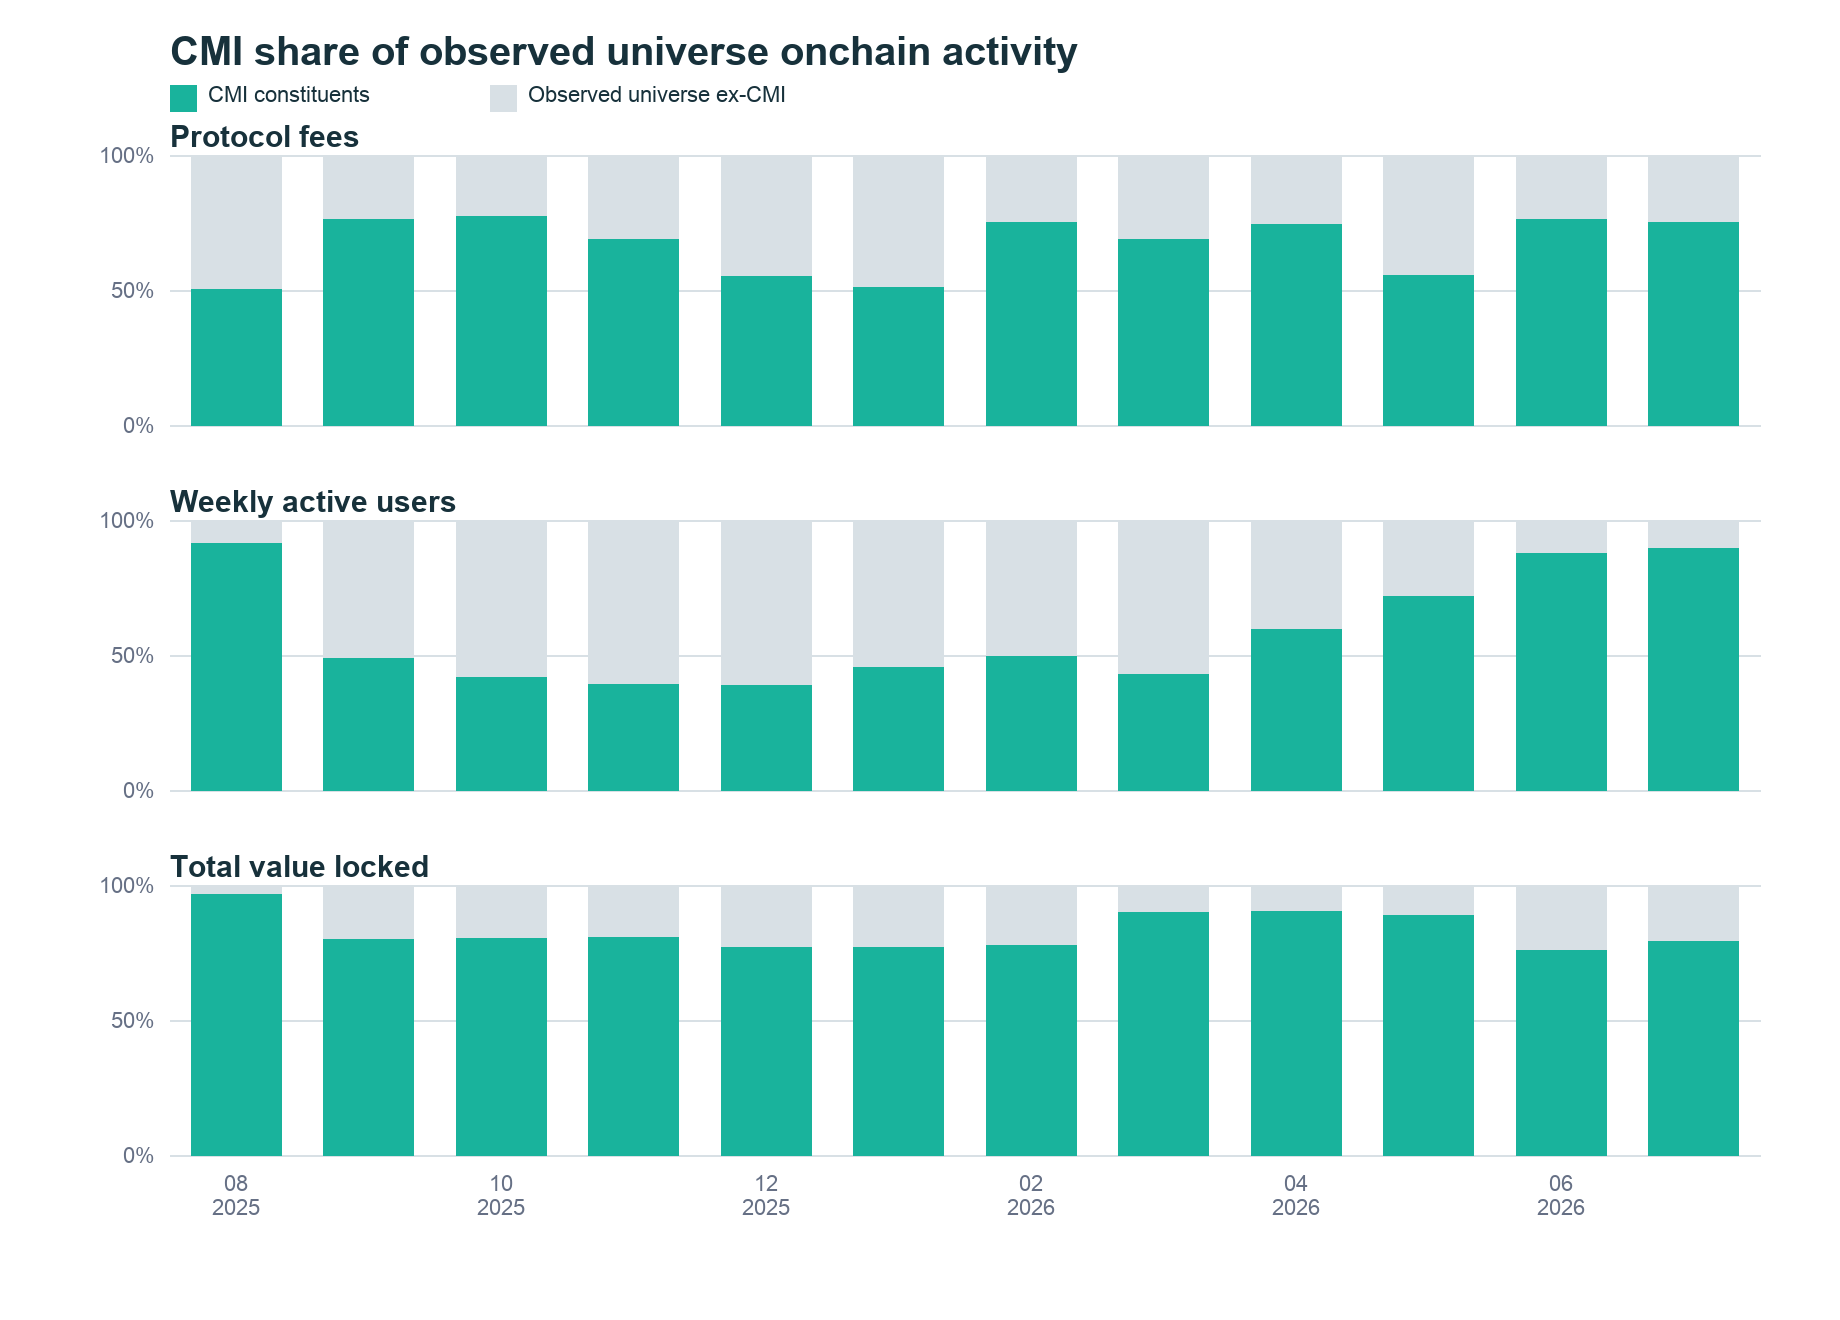
The pattern holds at the index level. In July 2026, CMI constituents represented 74.9% of observed universe protocol fees, 89.5% of weekly active users and 79.1% of total value locked.
Durability, Measured
"Durable by design" is only worth saying if it shows up as a number. For an index licensee that number is turnover, because turnover is transaction cost. CMI's rank buffers stop marginal rank reversals from becoming index events. A new entrant ranked ninth or better enters outright. An asset ranked tenth through twelfth enters only if an incumbent has fallen further down the ranks.
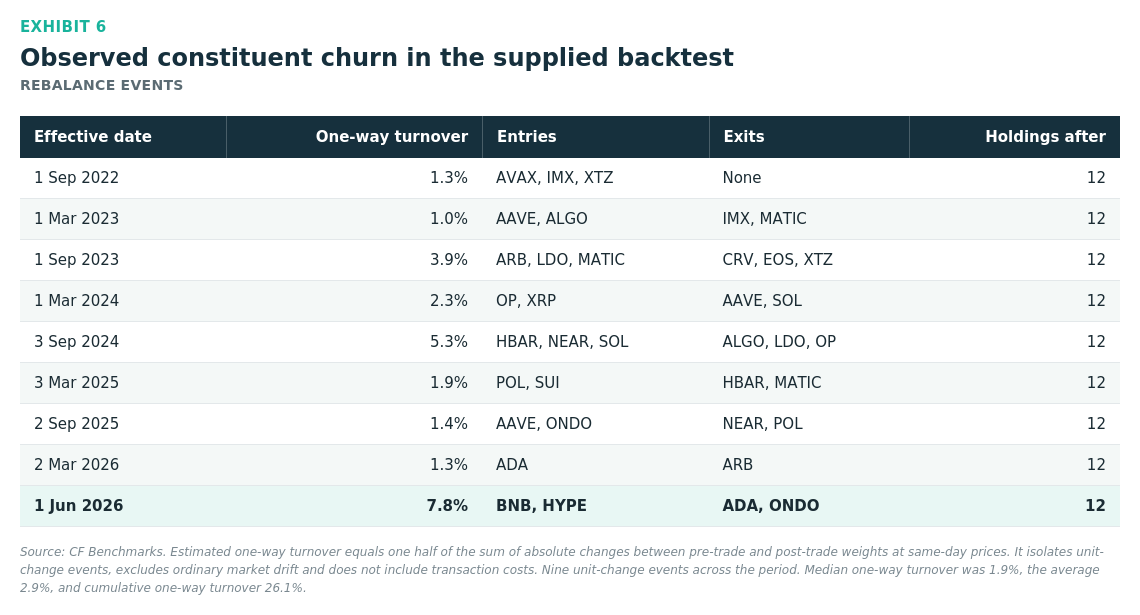
Across nine unit change events in the backtest, median one way turnover was 1.9%, the average 2.9%, and cumulative one way turnover 26.1%. The largest single event was 7.8 pp at the 1 June 2026 methodology inception, when BNB and HYPE entered and ADA and ONDO exited. The buffers concentrated change into scheduled events at a median cost of 1.9% and left a defined path for genuine leadership changes. Freezing the portfolio was never the objective.
How the Portfolio Is Built
The methodology is a funnel, and each stage has one job. Opportunity set and infrastructure requirements establish maturity. The codebase rule establishes distinctiveness. The product market fit pathway asks whether an economic role is durable. Free float and regulatory controls translate size into replicable exposure and keep a thinly traded asset from acquiring a weight it cannot support. Selection and review buffers control churn.
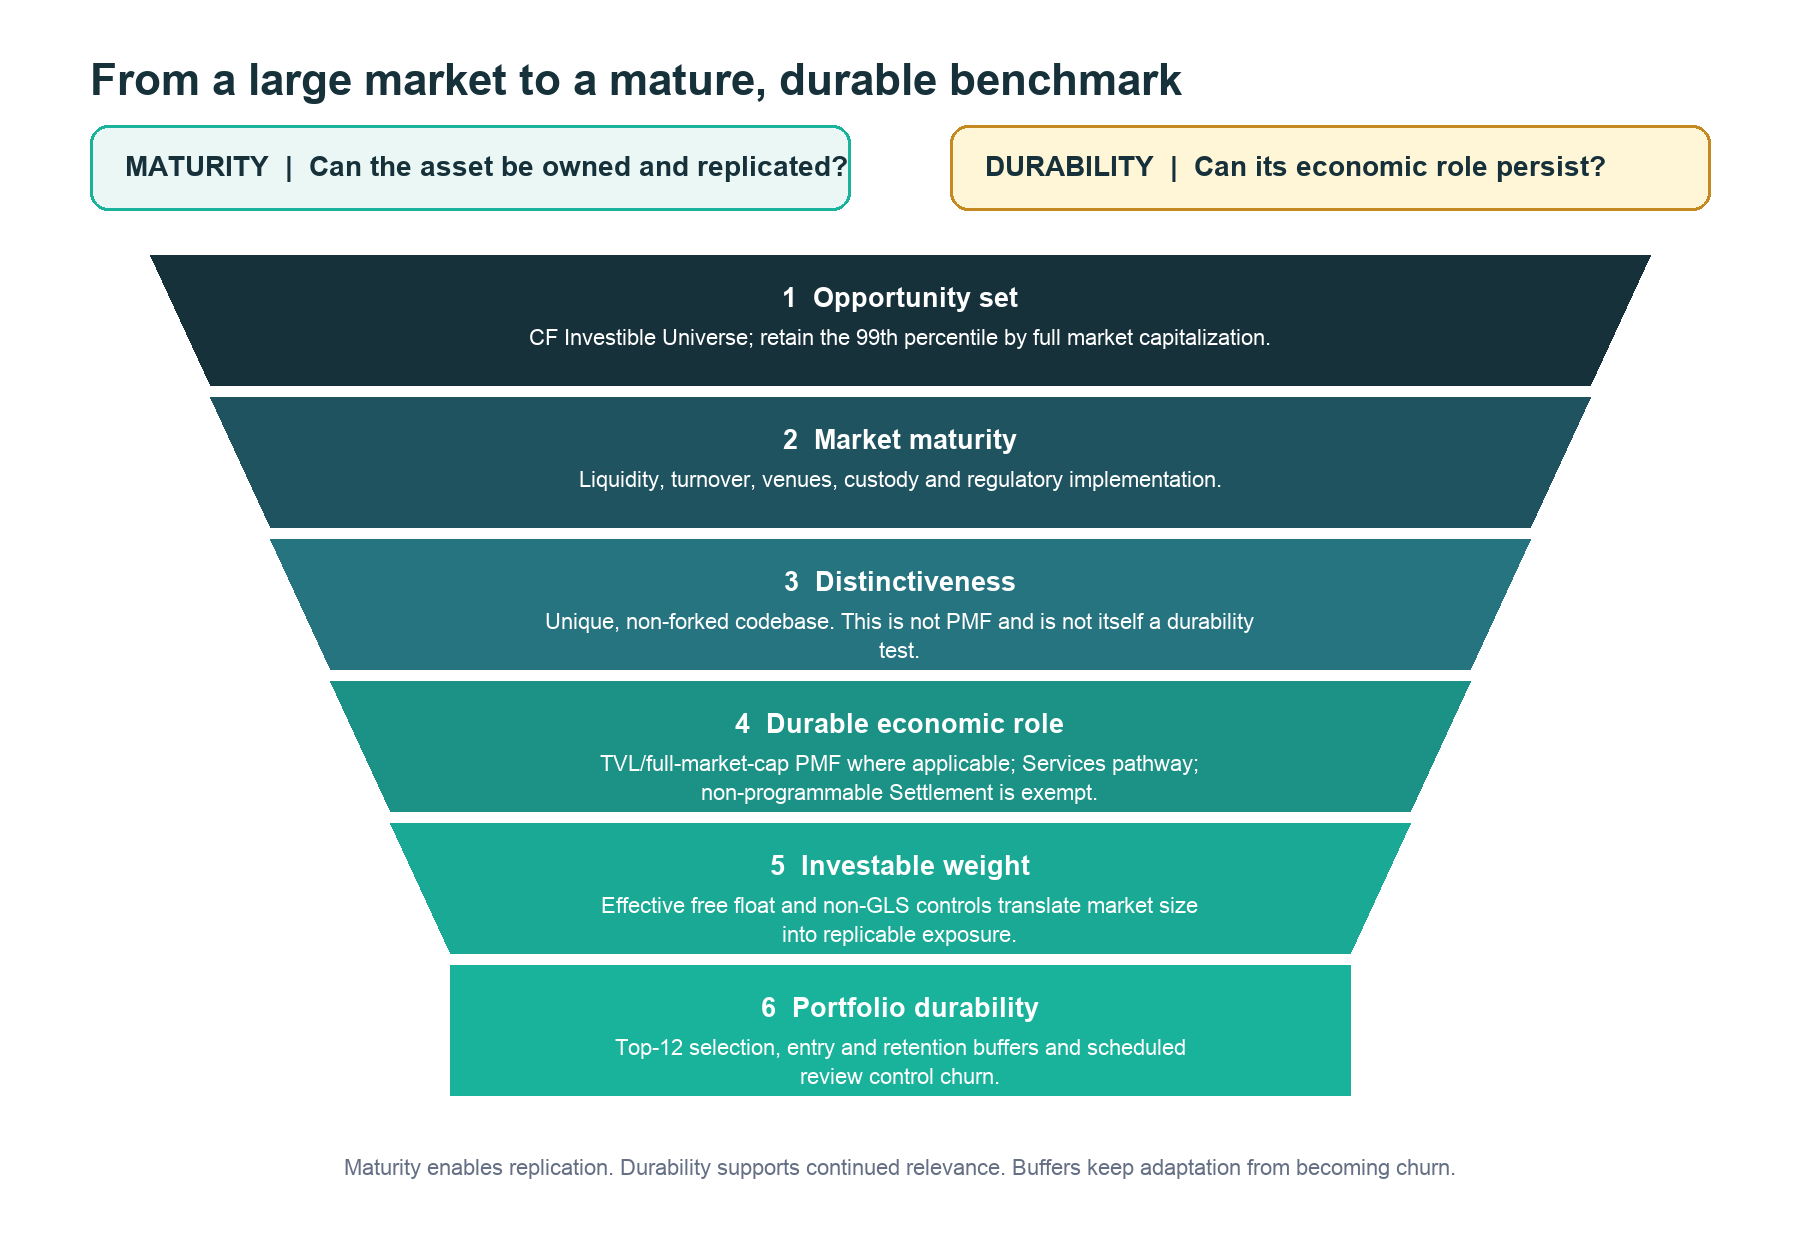
The unique codebase rule requires that an asset not result from a fork of another codebase. Its premise is that copying Bitcoin's code does not create another Bitcoin or transfer Bitcoin's monetary role to the copy. That rule sits separately from product market fit and is not, on its own, evidence of durability.
Durability is measured by economic category. Programmable assets under the quantitative pathway must maintain a twelve month median TVL to full market capitalization ratio above 3%. Services assets may qualify by providing a critical service to an existing or incoming constituent for at least one year. Non-programmable settlement assets are exempt from the test.
Conclusion
CMI's case rests on three findings from its own data.
First, the methodology does the work. Over the three years to 15 July 2026, an unscreened fifty asset free float portfolio returned 65.4% and produced no alpha. CMI returned 77.6% and produced 11.5%. Breadth held without eligibility standards earned nothing.
Second, the concentration is correct. At an effective breadth of 1.83, the index tracks a market that is itself concentrated, and its close agreement with a two asset Bitcoin and Ether core is the expected arithmetic of faithful representation, not a shortfall against it.
Third, the breadth that looks immaterial by weight is not immaterial by activity. Nine constituents holding 11.1% of the portfolio accounted for 87.0% of July protocol fees. That is what the benchmark owns beyond the largest networks.
CMI represents the digital asset market as it is, concentrated and Bitcoin led, while owning the economic roles where activity actually occurs. It does so through screens that historically accounted for the entire difference against holding the same market unscreened.
The information contained within is for educational and informational purposes ONLY. It is not intended nor should it be considered an invitation or inducement to buy or sell any of the underlying instruments cited including but not limited to cryptoassets, financial instruments or any instruments that reference any index provided by CF Benchmarks Ltd. This communication is not intended to persuade or incite you to buy or sell security or securities noted within. Any commentary provided is the opinion of the author and should not be considered a personalised recommendation. Please contact your financial adviser or professional before making an investment decision.
Note: Some of the underlying instruments cited within this material may be restricted to certain customer categories in certain jurisdictions.
Factor Friday - October 9, 2026
Size led CF Benchmarks' factor table for a second week at 2.58% as the Market fell 4.98%. Size held after QNT's reversal, though its cohort spread narrows sharply without three outlier tokens, and Downside Beta and Liquidity gave back part of last week's gains.

Mark Pilipczuk
Small Cap Tokens Outperform in September
The CF Free-Float Broad Cap Index rose 10.28% in September as Bitcoin supplied 59% of the gain while trailing the index. Returns across the Capitalization Series ran from +7.74% for Ultra Cap 5 to +14.01% for Emerging Crypto, which holds no Bitcoin, as altcoins outpaced Bitcoin.
Mark Pilipczuk
CF Digital Asset Index Family Multi Asset Series – Extraordinary Rebalance Announcement
CF Digital Asset Index Family Multi Asset Series - Extraordinary Rebalance Announcement
CF Benchmarks
By clicking Accept, you consent to CF Benchmarks's use of cookies.
Visit Cookie Settings to learn how CF Benchmarks uses cookies and to adjust your preferences.