
Dec 09, 2022
CF Benchmarks Quarterly Attribution Report
Another exogenous shock has led crypto markets lower over the last rebalancing period as one of the world’s largest exchanges surprisingly filed for bankruptcy. All of our flagship portfolio indices finished in negative territory with pricing volatility surging in the month of November. The bear market that began earlier this year has only intensified after each over-levered institution or organization collapses. These failures have had a cascading impact on the overall asset class, with the falling prices of crypto markets sparking an industry deleveraging exercise, spreading contagion that leads to even further discounting of crypto assets.
Regarding the macro-environment, risk sentiment has begun to look toward an eventual pivot or slowdown in monetary tightening. The most recent inflationary trends indicate that headline pricing pressures may have peaked in June. This dynamic is expected to be supportive of crypto markets, which face particularly pronounced headwinds from a rising interest rate environment. However, core inflation is likely to be more difficult to tame and the overall level of inflation is likely to remain above any acceptable threshold for some time. This has left crypto market participants in limbo when trying to balance the improving data on the inflation side and spill over impacts from the latest fallout of a major market player.
The CF Diversified Large Cap Index
The CF Diversified Large Cap Index - is a liquid, investible benchmark portfolio index designed to track the performance of large-cap digital assets. The index seeks to capture 95% of the total market capitalization of the investible digital asset universe as its constituents. Index constituents are weighted using the diversified market capitalization which is determined by the free-float market capitalization adjusted by the application of the harmonic series' terms. This has the benefit of discounting the higher capitalization assets within the portfolio in accordance with the CF Multi Asset Series Ground Rules and the CF Diversified Large Cap Index Methodology. The index is calculated and published every second. The index is re-constituted on a twice yearly basis and rebalanced quarterly. The CF Diversified Large Cap Index - was incepted on December 1st 2021 with a value of 1,000. The index was launched on February 14th, all values from inception date to launch date provided are back tested.
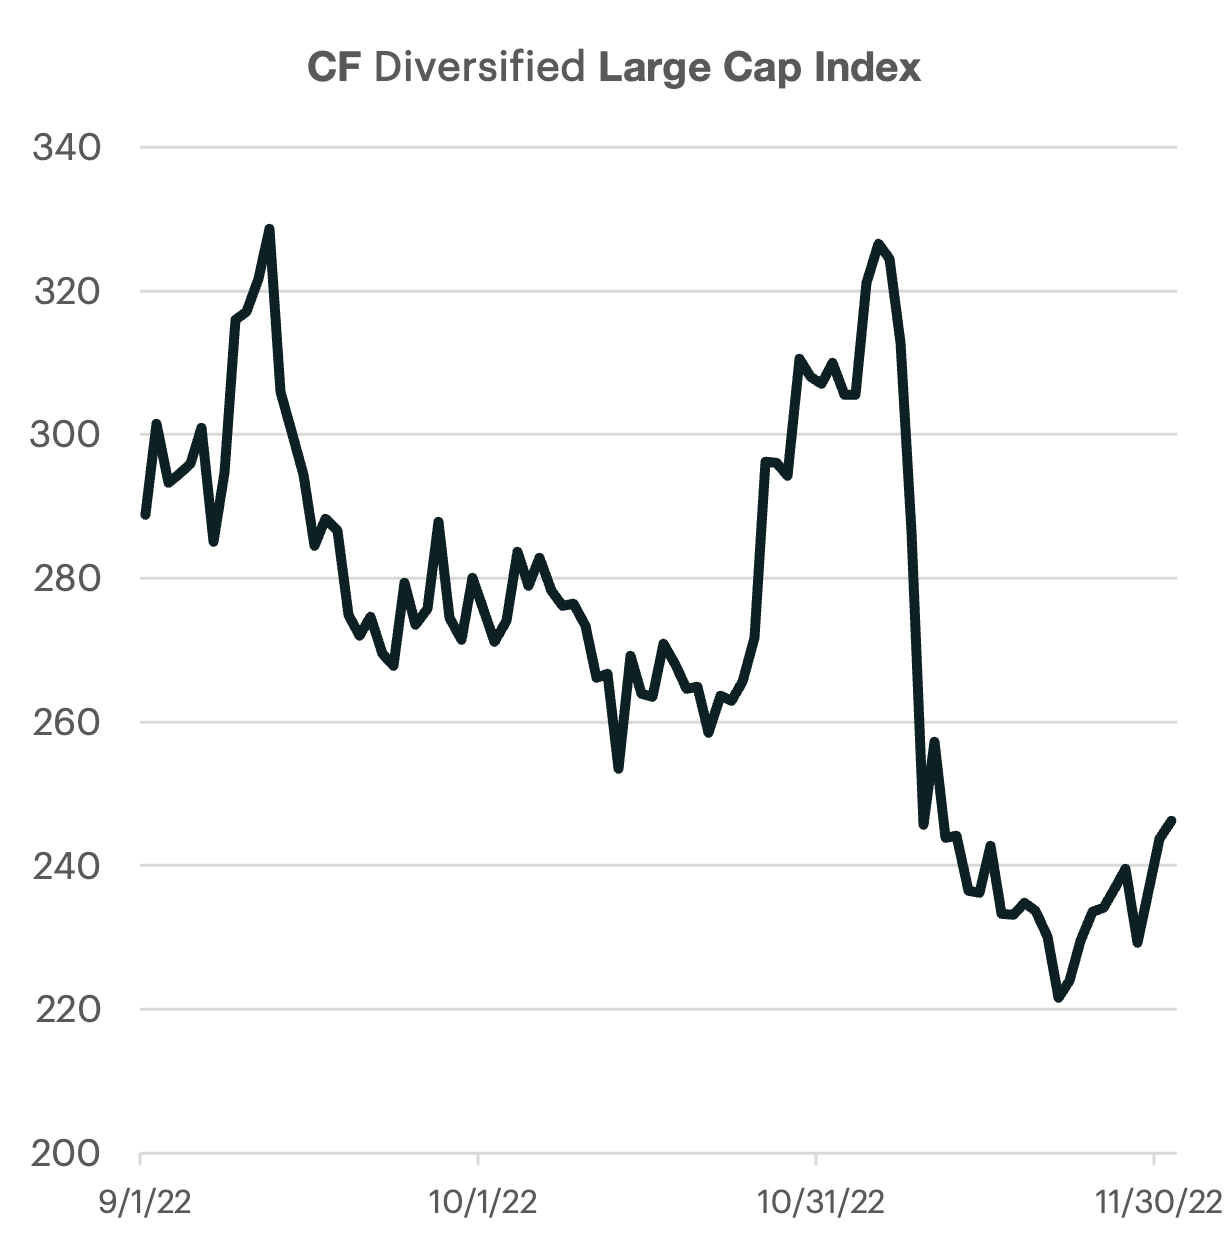
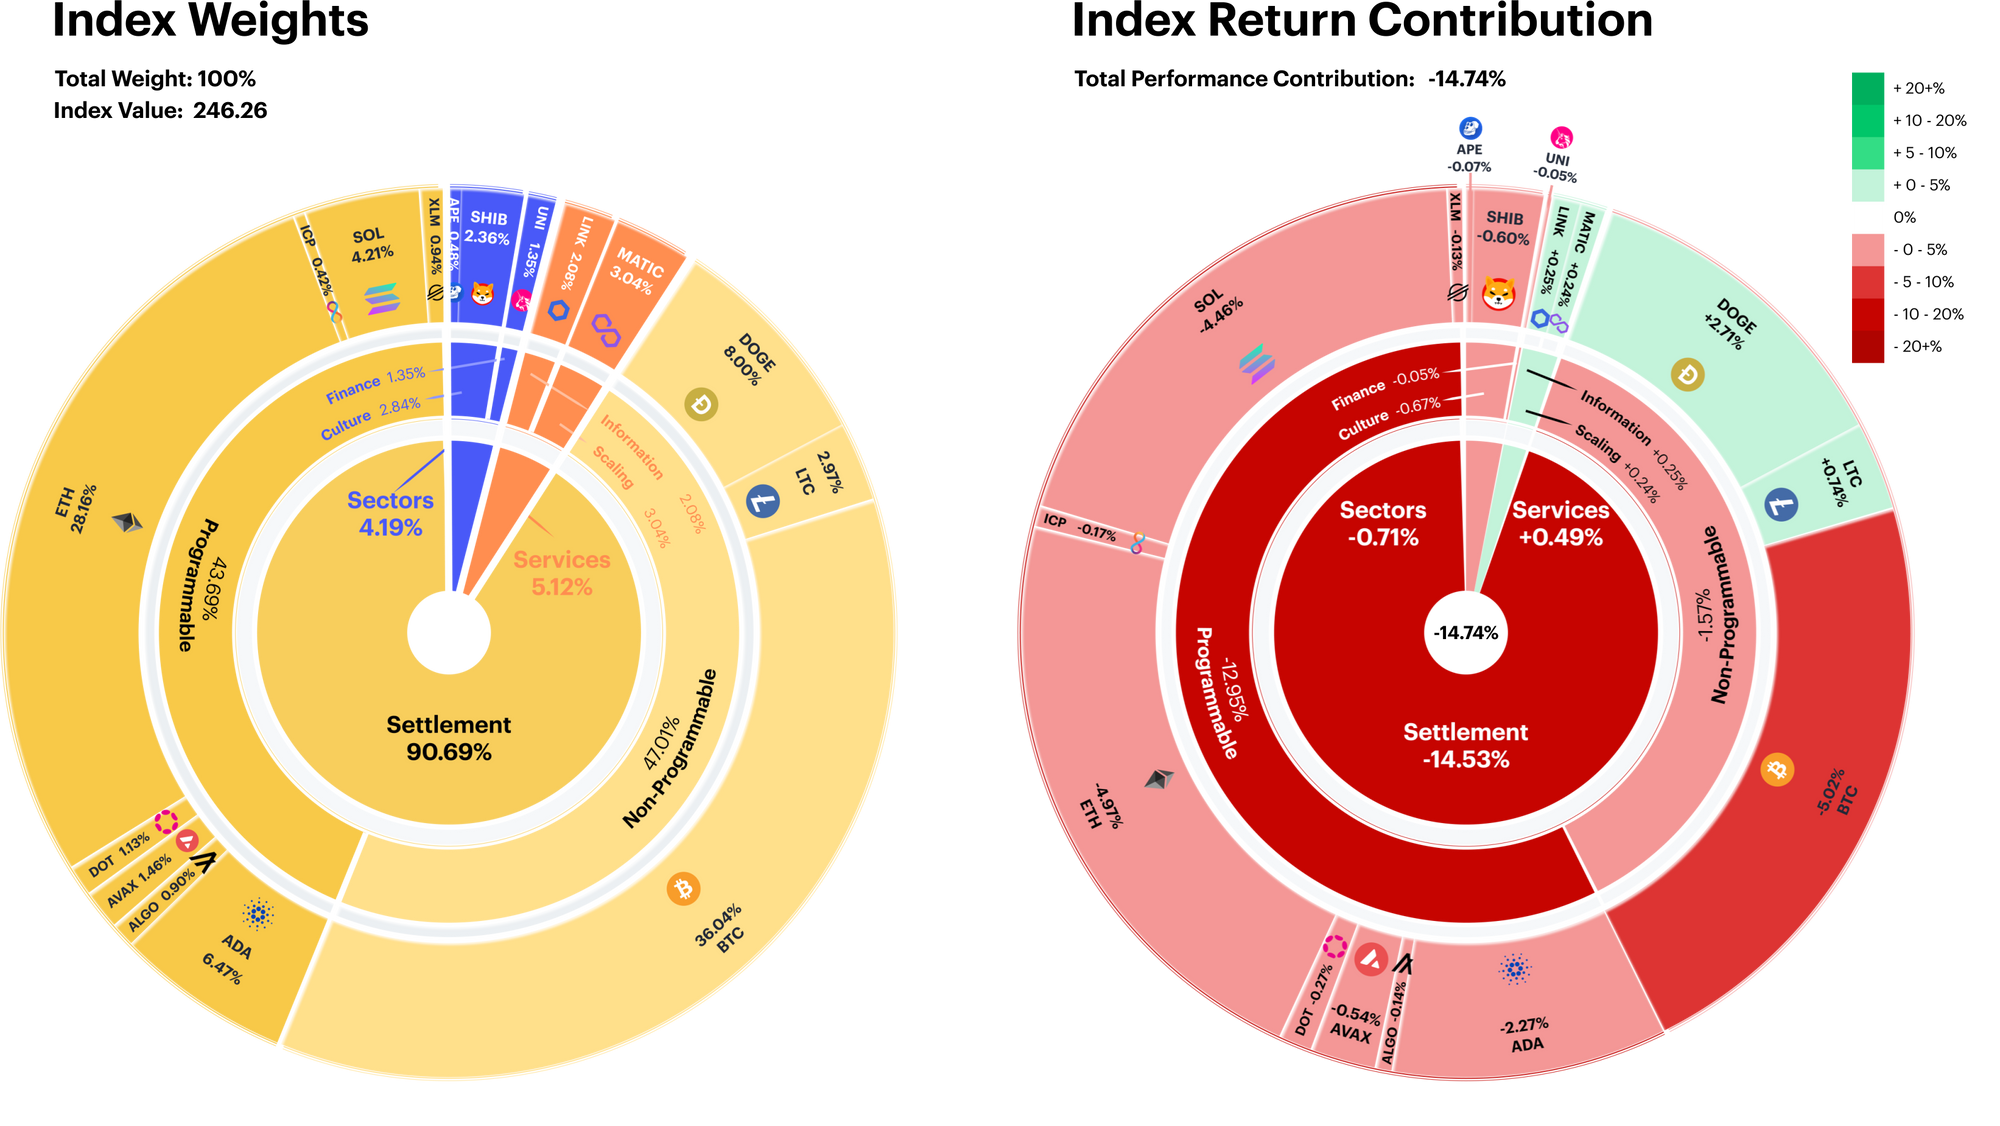
Settlement drags large-caps lower
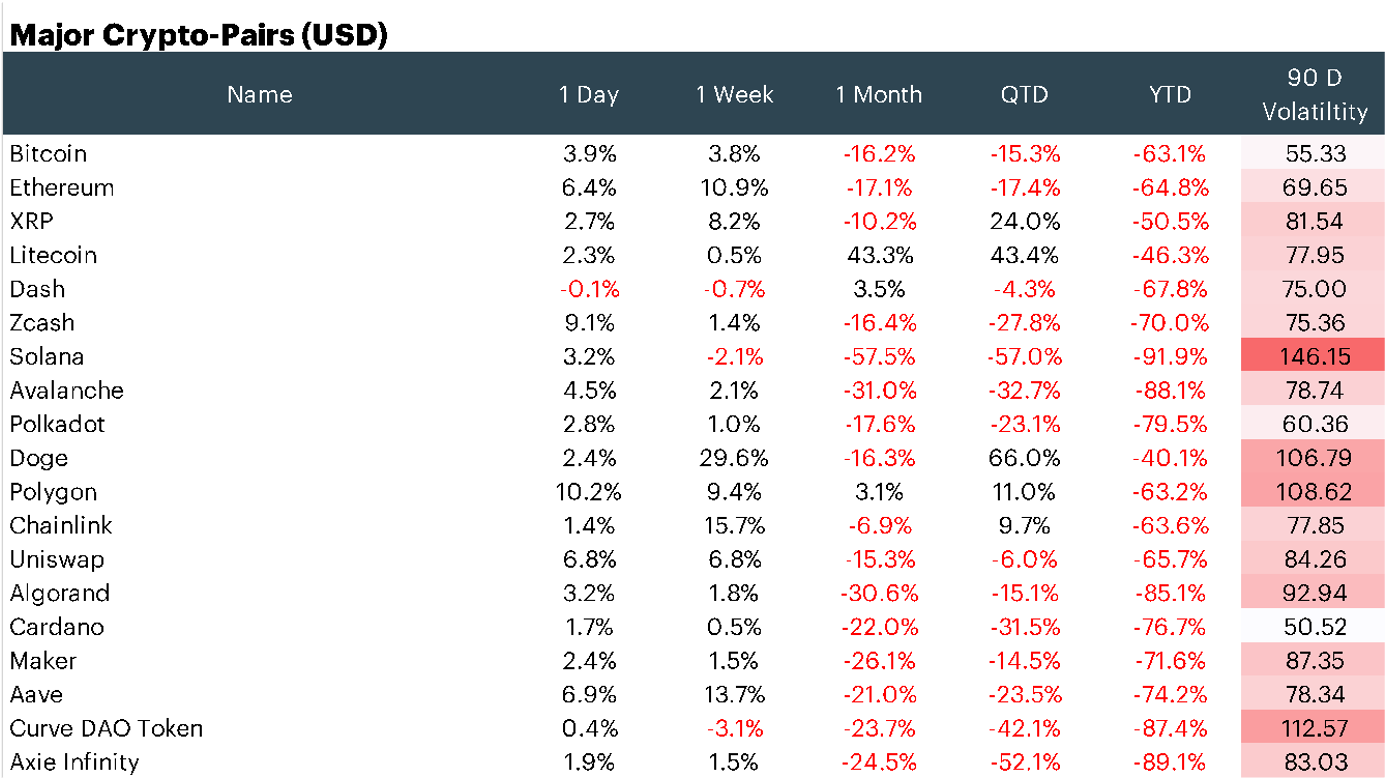
Large-cap tokens continued on their downward trajectory, falling over -14%. From a Level 1 Digital Asset Classification Structure (DACS) perspective, the heavily weighted Settlement segment contributed most to the index’s decline (-14.5%), with Solana providing a disproportionate amount of negative performance.
The Services segment saw a slightly positive performance contribution, and conversely, Sectors’ contribution was slightly negative.
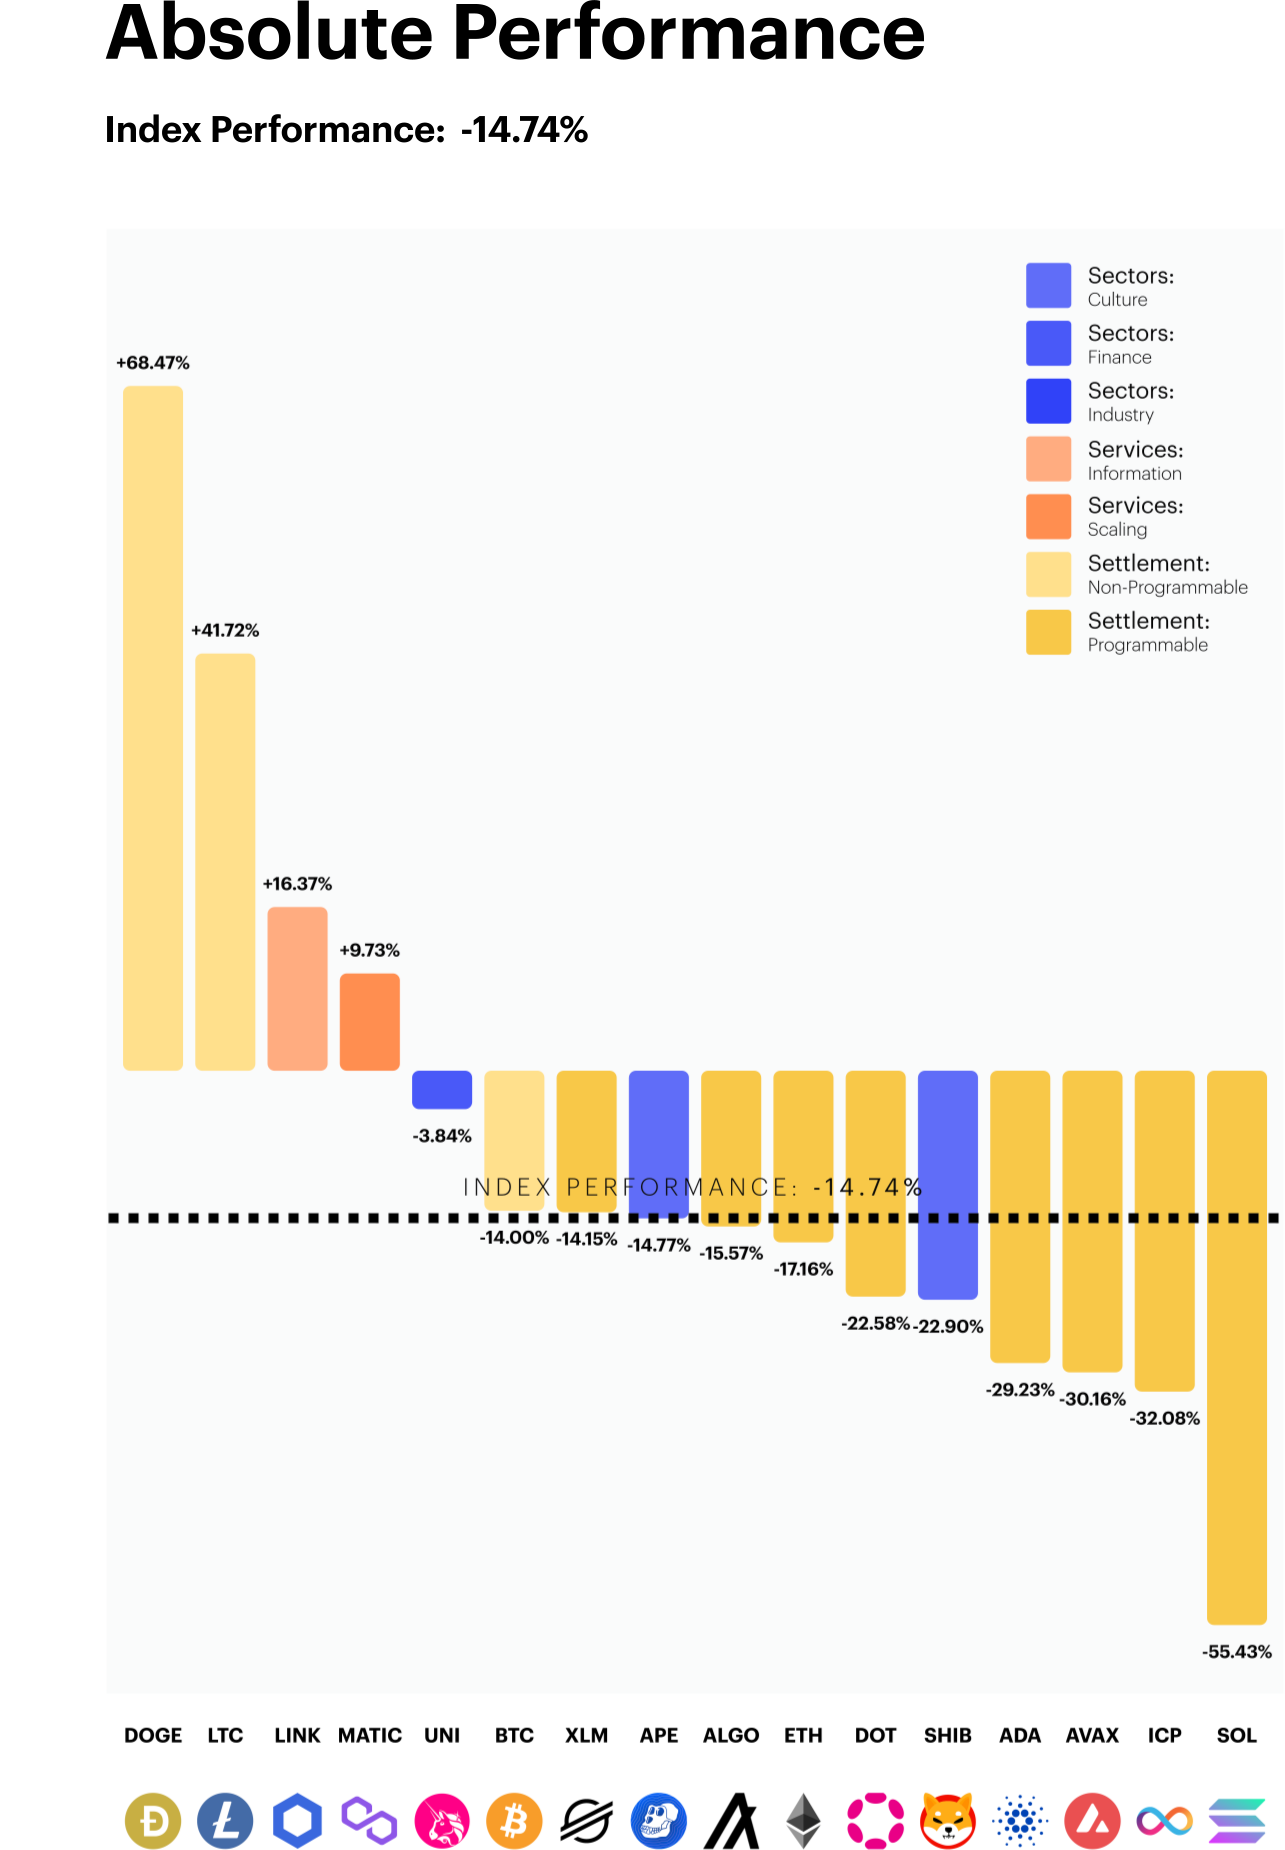
Dogecoin surges on Twitter take over
Non-programmable, Settlement altcoins led their peer group as Dogecoin finished the rebalancing period as the top performer. The popular meme coin saw a significant rally in price performance following Elon Musk’s takeover of Twitter. Mr. Musk has been a frequent advocate for Dogecoin. Therefore, the fundamental catalyst for the bullish price action is centered on speculation that Mr. Musk will utilize Doge in some capacity in the Twitter 2.0 payments arena. Litecoin, the fourth largest non-programmable token, soared after the announcement of a planned halving for mid 2023. This exercise will change the tokenomics of Litecoin by reducing the issuance supply for miners.
Solana (SOL) prices fell -55.4%, finishing the rebalance period as the worst performer. The Ethereum competitor saw steep price declines due to the fallout from FTX/Alameda where it was reported that the foundation had significant exposure to the now defunct crypto exchange. SOL now trades over 90% lower from its November peak.
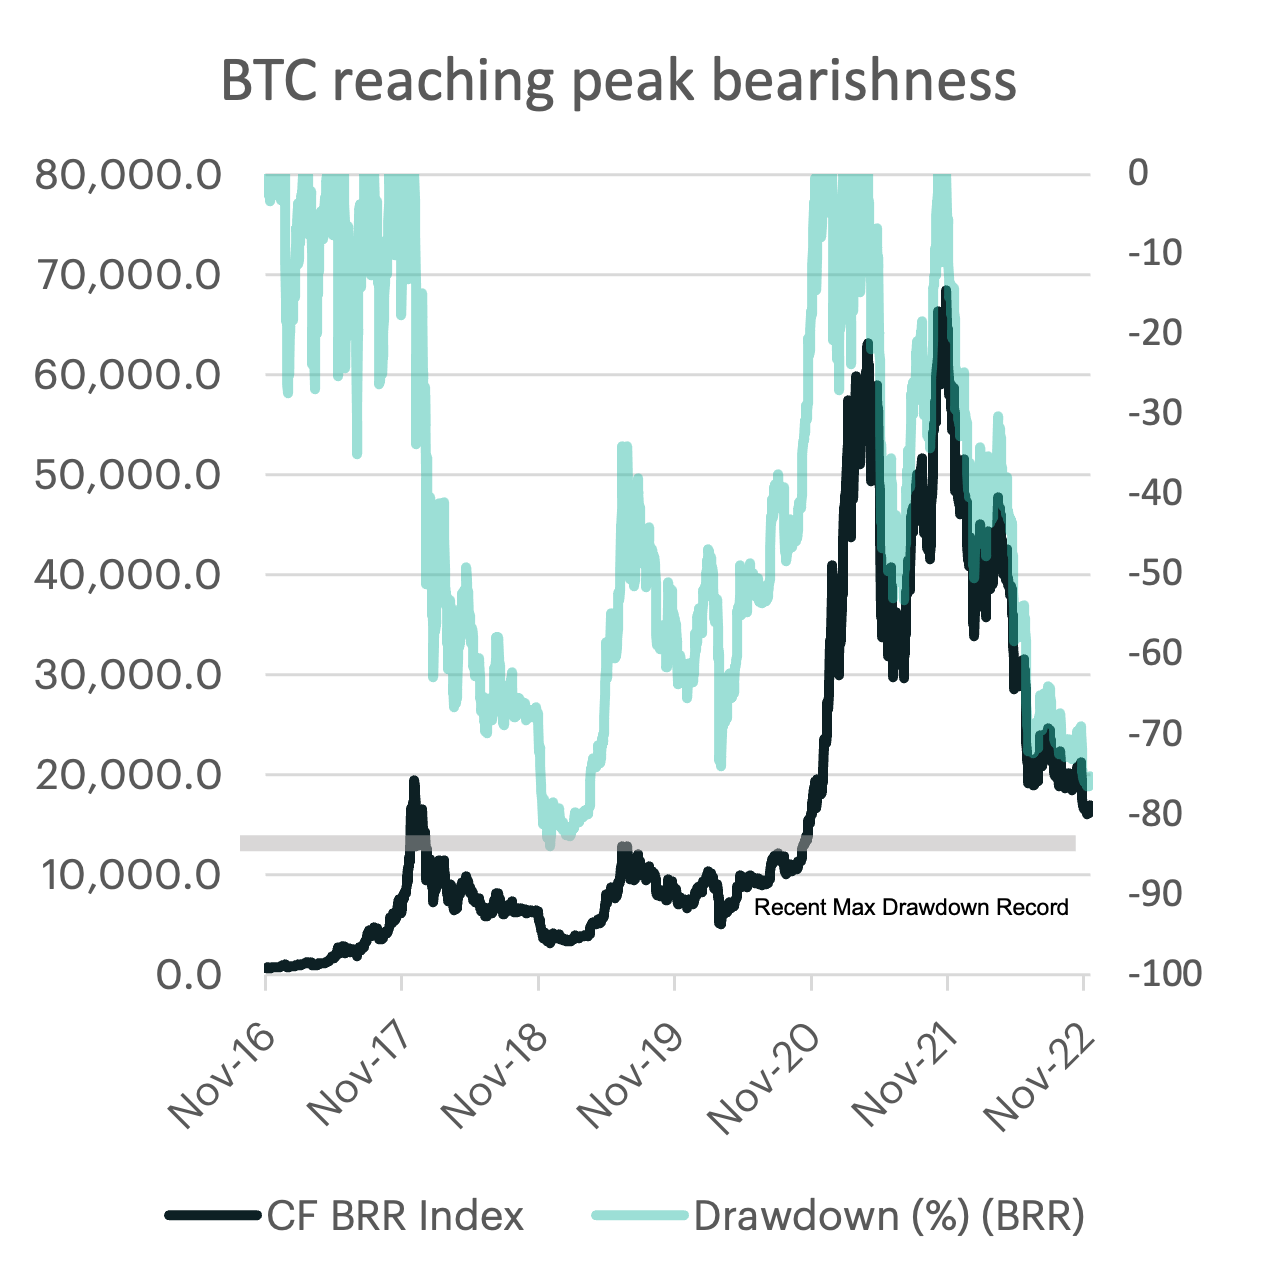
Bitcoin continues search for bottom
The latest exogenous shock in the crypto industry has pushed bitcoin prices another leg lower, bringing the maximum drawdown from the 2021 peak to just over 76%. But how does this compare to previous bear market cycles?
To answer this question, one could consider using history as a guide. Bitcoin price action has impressively displayed similar drawdown characteristics over the course its existence. Since 2011, bitcoin peak-to-trough depreciations have averaged approximately -85%, with the 2011- 2013 cycle marking a record -93%. The fallout from FTX and subsequent contagion impacts have pushed this bear market cycle’s low closer to the most recent historical threshold. Lastly, it is also worth noting that each bear-market cycle trough was slightly less deep than the prior, leaving the -83% level seen in 2018 potentially a stone’s throw away
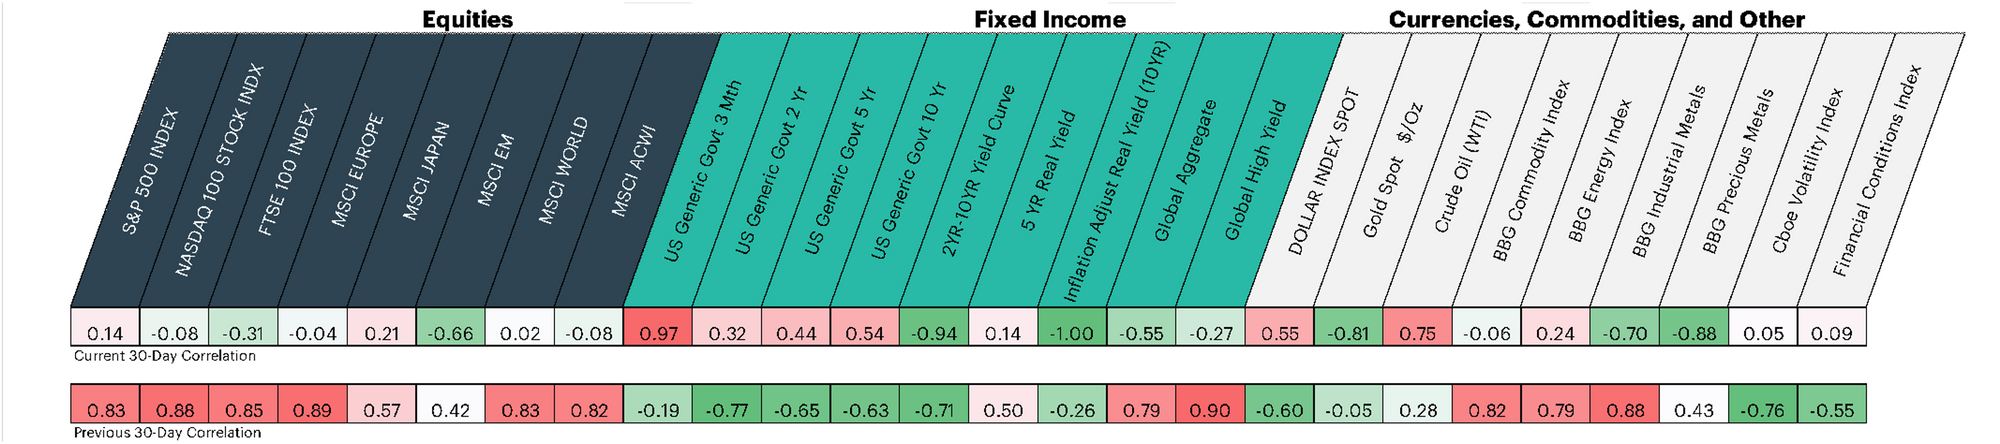
What’s Driving Crypto? Rolling 30-Day Large Cap Correlations
The CF Diversified Large Cap Index has seen a sharp drop in its rolling 30-day correlation with equity markets. This is likely due to the asset-class specific challenges, which have been certainly are more impactful to crypto markets and less so for other risky assets. Meanwhile, crypto has maintained a sensitivity to rates market. However, the relationship has shift from nominal short-dated Treasuries to longer-dated inflation linked Treasury issues. It is likely that digital asset correlations will repair their relationship among their risky-asset peer group once industry specific uncertainty eases.
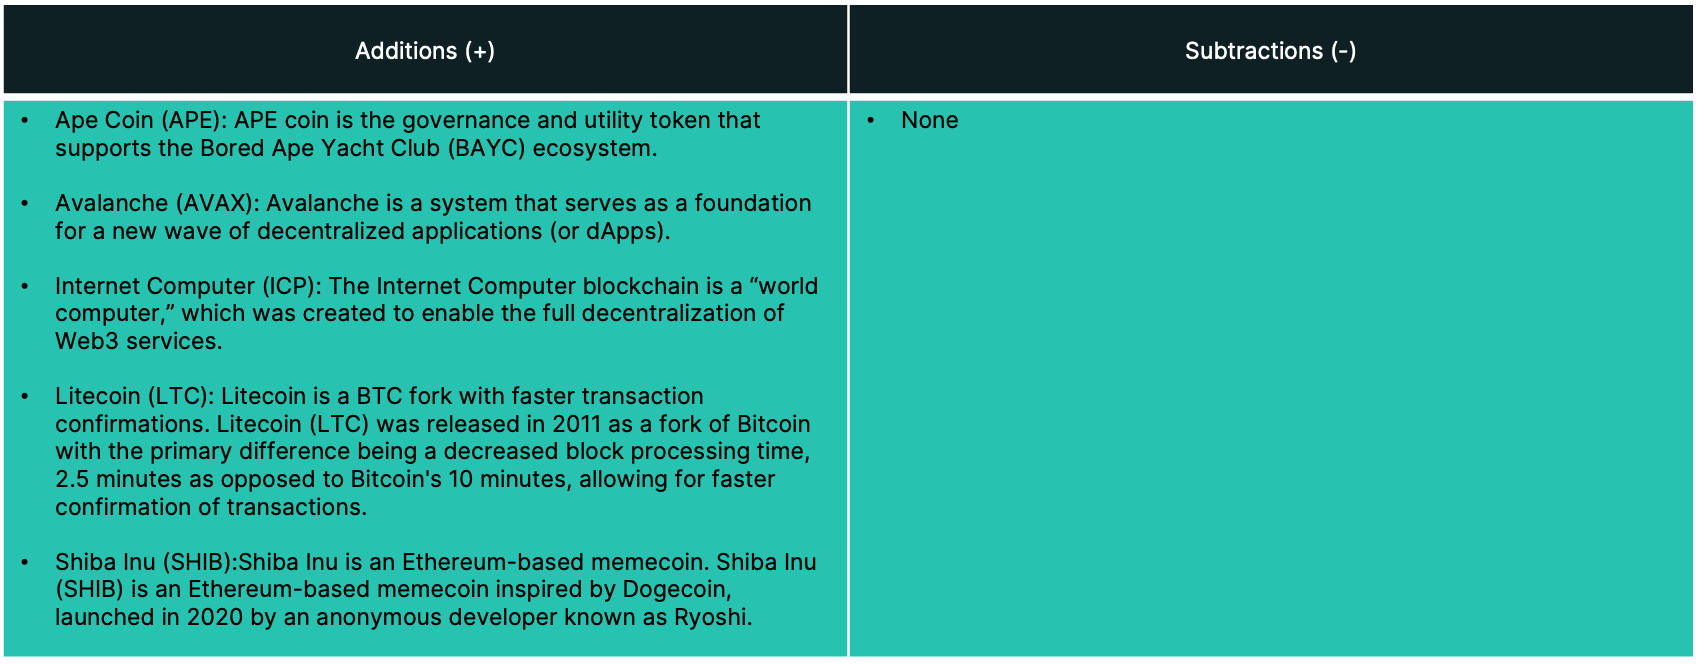
Appendix: constituent changes for current period
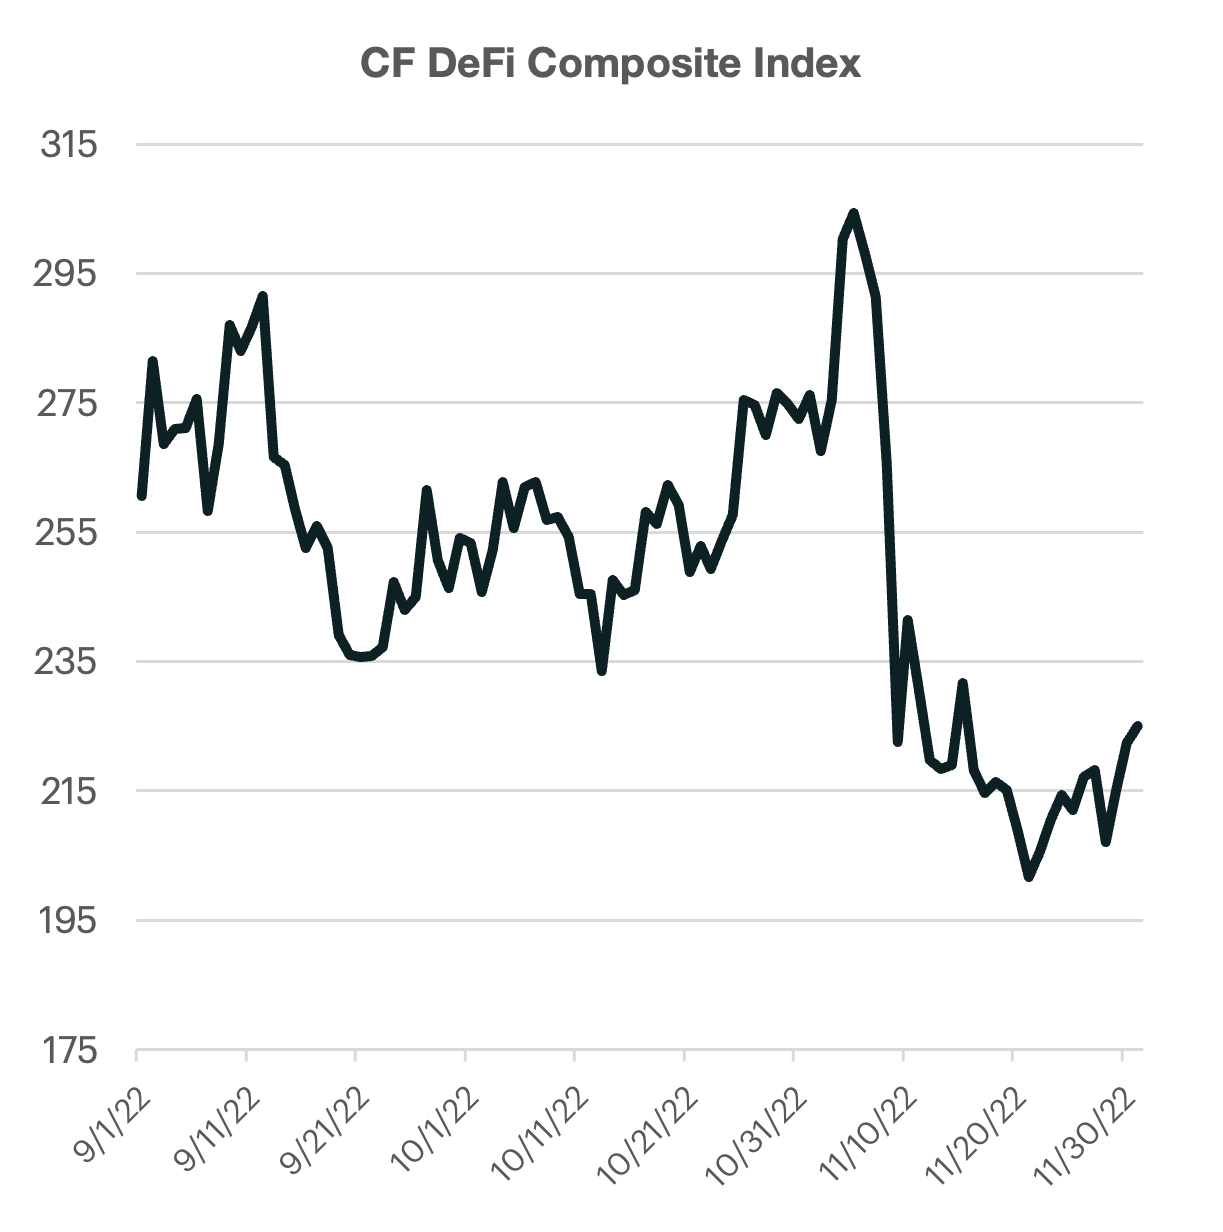
The CF DeFi Composite Index
The CF DeFi Composite Index - is a liquid, investible benchmark portfolio index that tracks the return performance of decentralised financial services, commonly referred to as "DeFi". The index is comprised of three distinct sub- portfolios of fixed weight that represent the components of blockchain architecture that are required to deliver decentralised financial services to individual and institutional end users; DeFi Applications, Services and Settlement Blockchains. Digital assets are classified in accordance with the CF Digital Asset Classification Structure (DACS) for sub-portfolio eligibility.
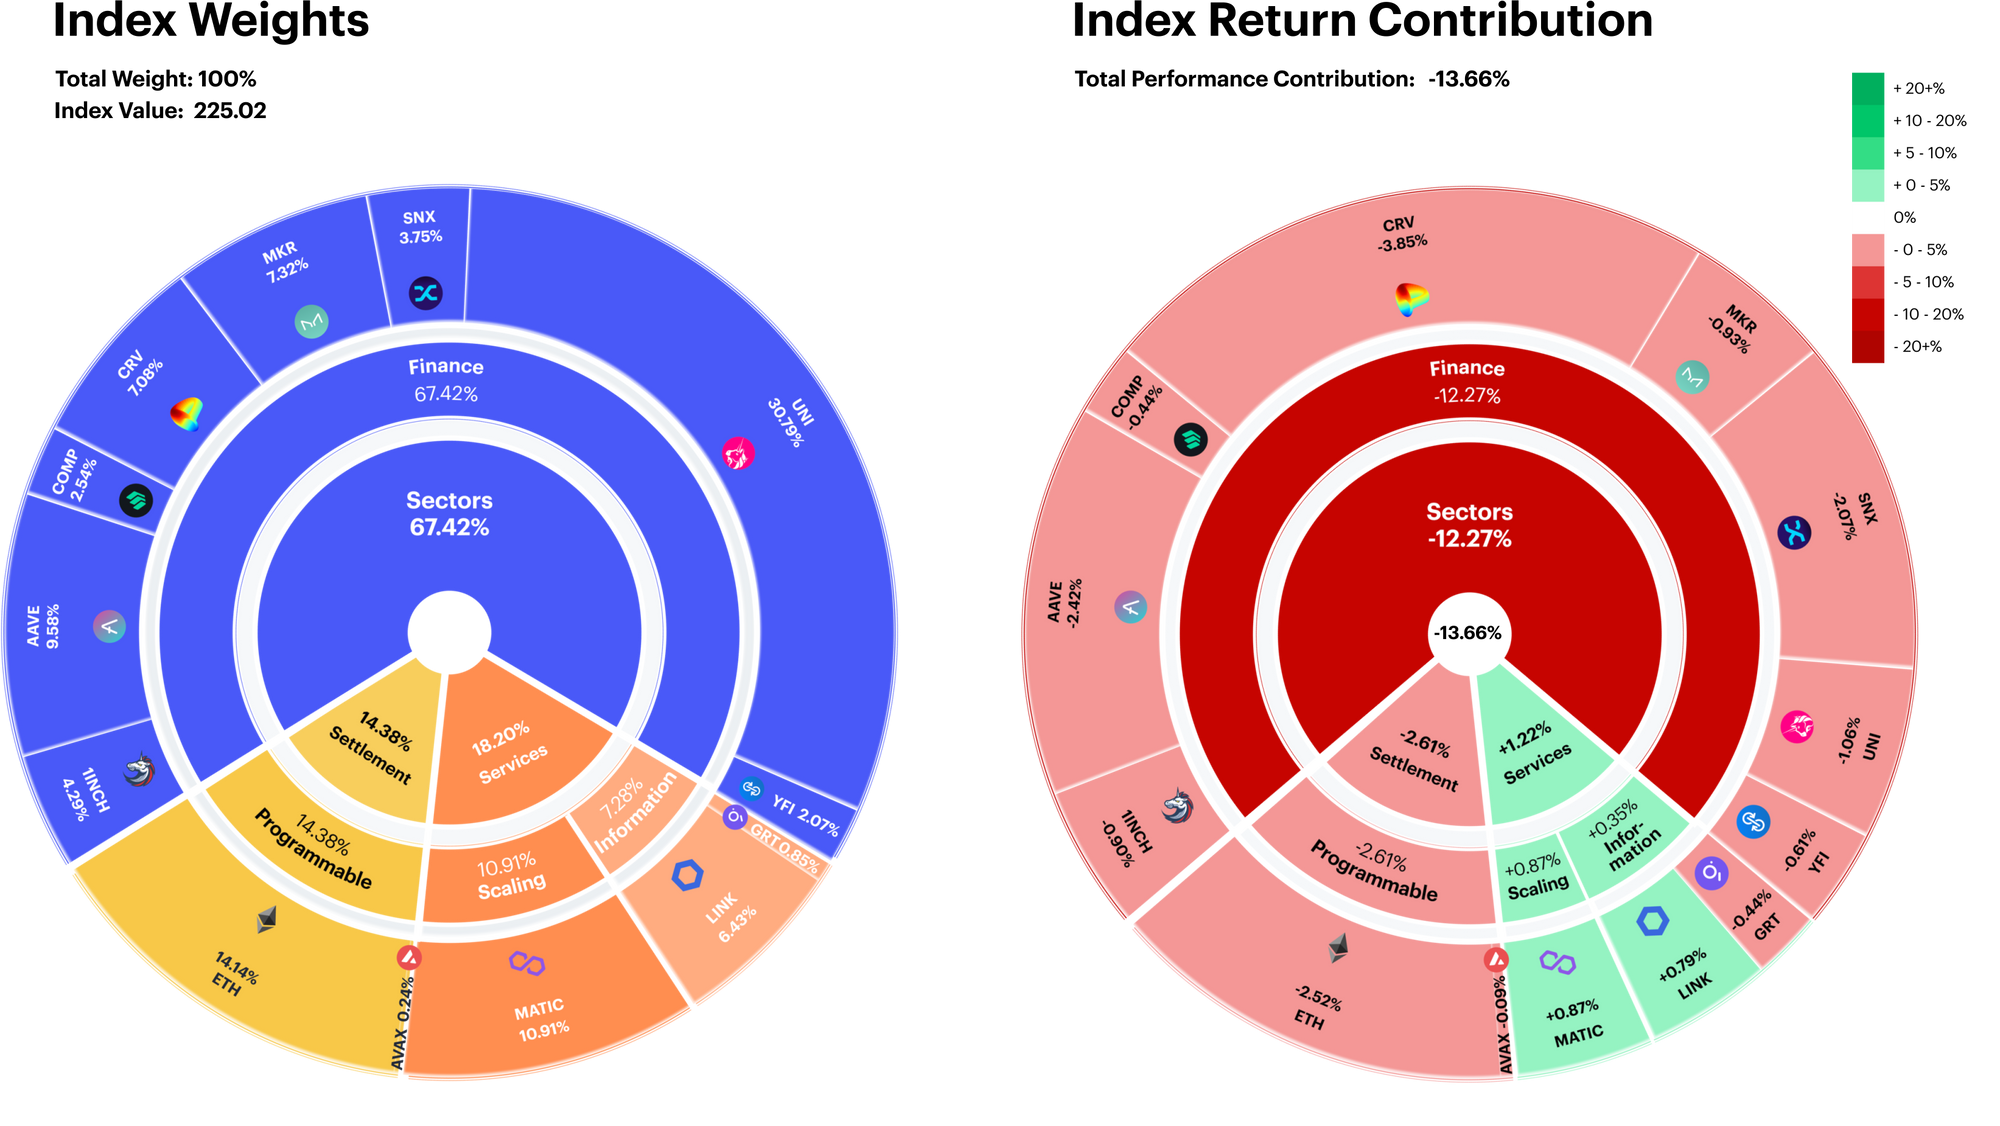
Services remains defensive
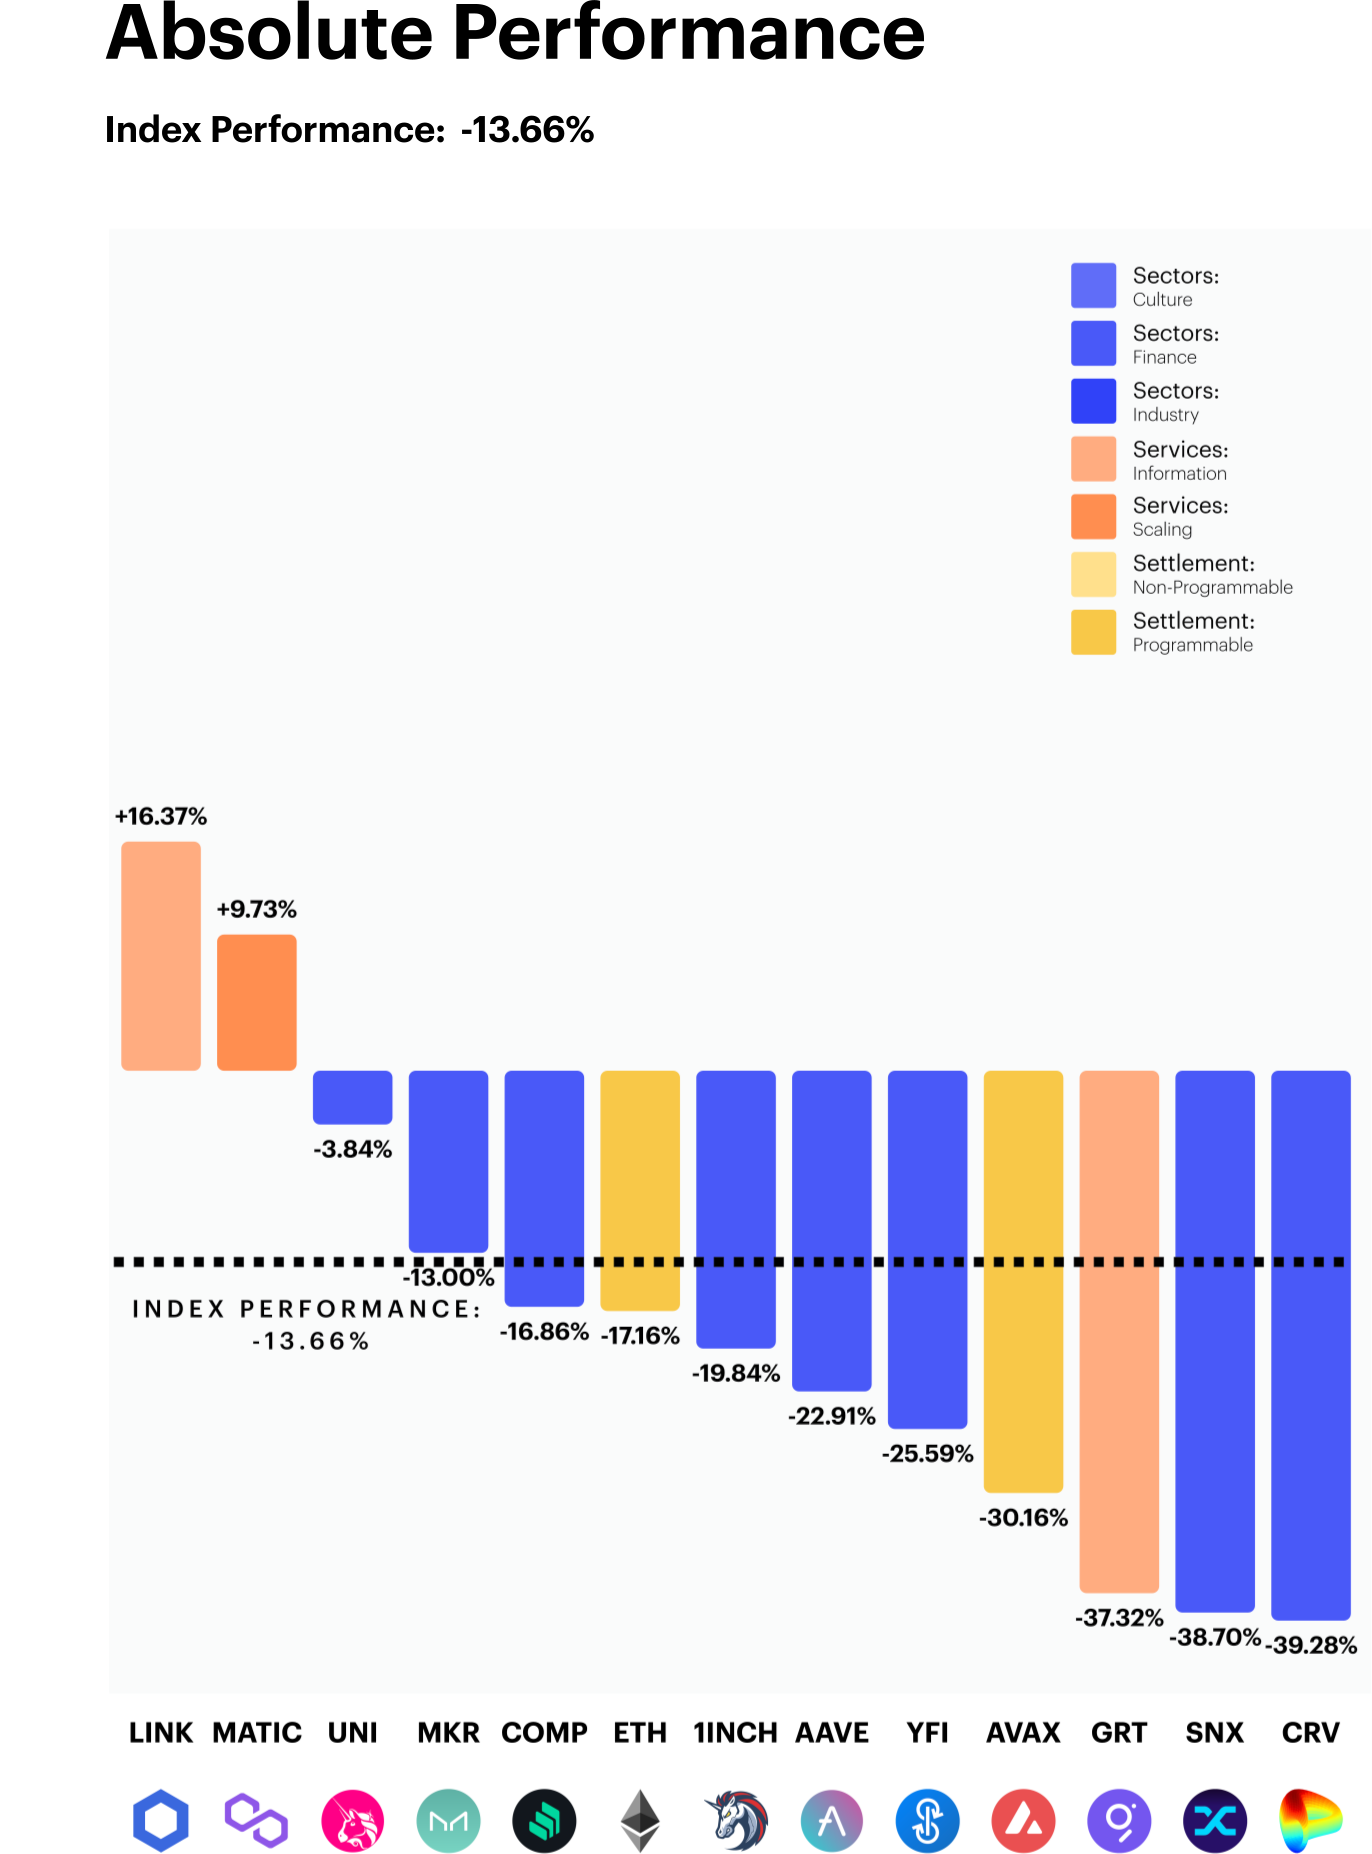
The -13.7% decline in the CF DeFi composite index remained largely concentrated in the Finance segment of the portfolio index. With almost 90% of the negative performance contribution stemming from this category alone. Meanwhile, the Services segment again showed resilience, contributing over 1.2% of positive performance.
MATIC and LINK both led in positive contributions (0.87% and 0.79%, respectively). Conversely, CRV’s larger weight and negative performance subtracted almost 4% of index performance.
Breadth broadly negative for DeFi
The CF Defi Composite Index saw broad negative performance over the course of our rebalance period. From a DACS perspective, all of the Finance category tokens finished in negative territory with CRV and SNX falling almost 40%. It is worth noting that the majority of this negative performance occurred after the collapse of FTX / Alameda, which has had a significant fundamental impact on the space. Total Value Locked (TVL), a proxy measure for the total size of DeFi, saw a reduction of over $20Bn shortly following the surprise collapse. TVL has since stabilized from the sharp decline and has settled just north of $60Bn.
Standout tokens for the quarter included Chainlink (LINK) and Polygon’s (MATIC). The former saw break-out momentum to the upside in late October after developers announced plans to launch their novel staking program which will allow token holders to earn passive income. Lastly, MATIC continued to secure strategic corporate partnerships along with being the public blockchain selected by JPMorgan to facilitate the bank's first ever DeFi trade.
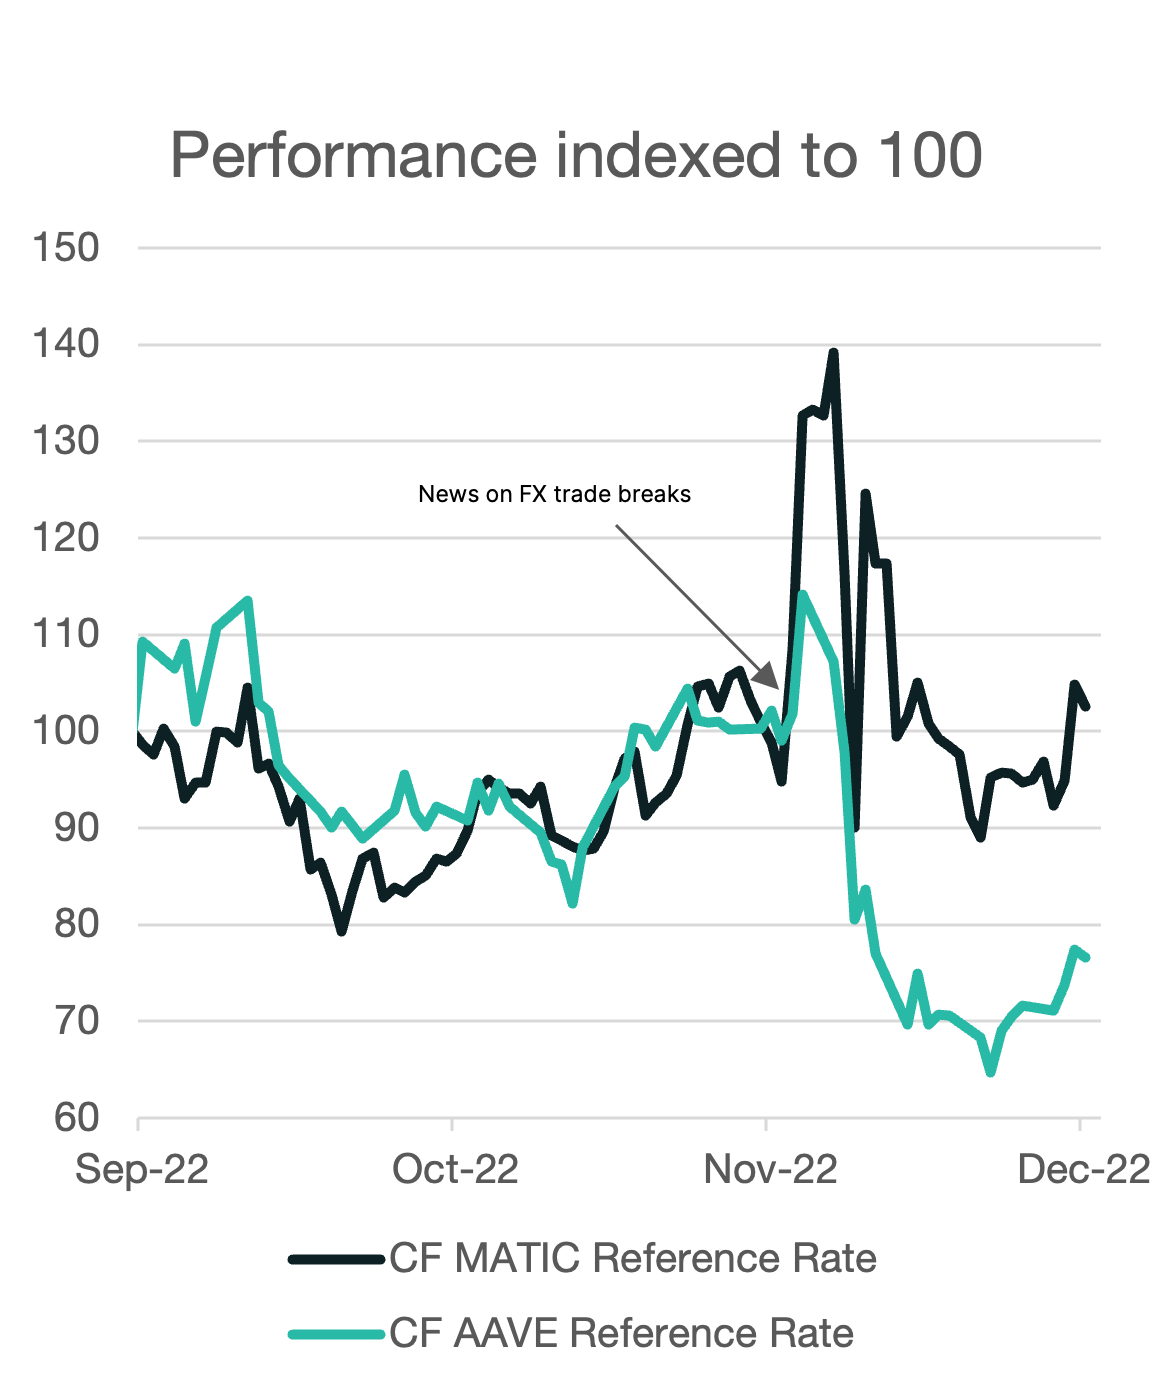
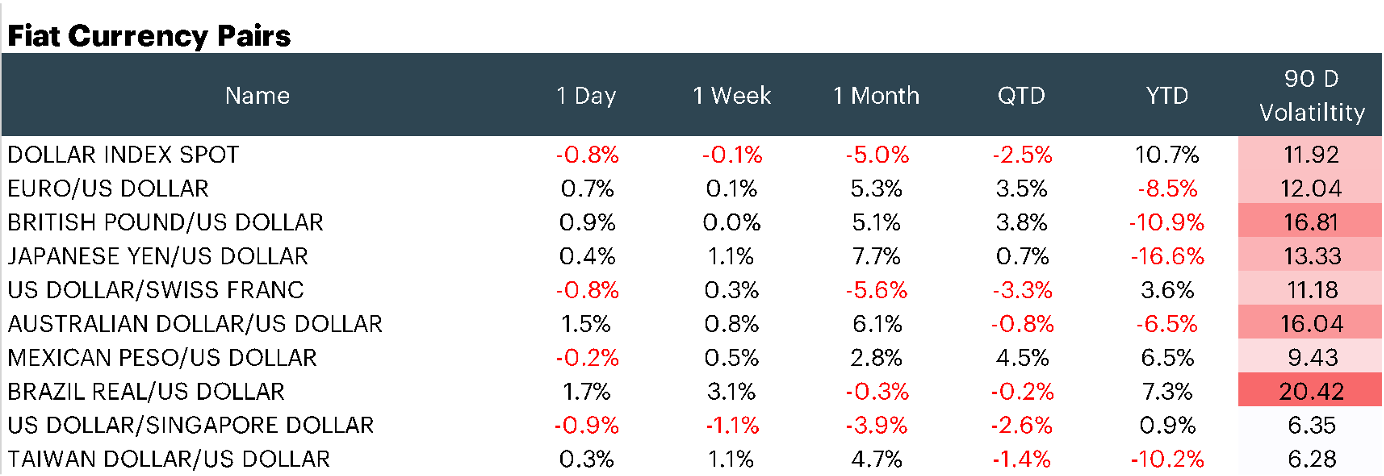
Tokenized FX trade marks milestone
In November, the DeFi space achieved a significant milestone, with JPMorgan executing its first DeFi trade on a public blockchain. The bank is part of the Singapore Central Bank’s DeFi pilot program. The tokenized transaction swapped Singapore Dollars for Japanese Yen from SBI Digital Asset Holdings in early November. Polygon’s blockchain and a modified version of Aave were utilized to execute this historical currency swap. The subsequent press release sent both tokens soaring, but this was short-lived due to the FTX fallout.
Cryptocurrency critics have often cited the the lack of practical use cases for the decentralized technology. However, a milestone achievement such as this gives credence to a potentially much wider use case. The efficiency and scalability advantages of tokenized assets on blockchains will likely transform many markets in the future.
Appendix: constituent changes for current period
CF Web 3.0 Smart Contract Platforms Index
The CF Web 3.0 Smart Contract Platforms Index is a liquid, investible benchmark portfolio index that tracks the return performance of Smart Contract Platforms within the Digital Asset space.The index seeks to capture returns of all eligible protocols under the Settlement category and Programmable sub-category of the CF Digital Asset Classification Structure (DACS). Index constituents are weighted using a capped free-float market capitalization in accordance with the CF Digital Asset Series Ground Rules and the index methodology. The index is calculated and published once a day at 4:00 pm London Time. It is reconstituted on a twice yearly basis and rebalanced quarterly. The CF Web 3.0 Smart Contract Platforms Index was incepted on December 1st 2021 with a value of 1,000. The index was launched on June 28th, all values from inception date to launch date provided are backtested.
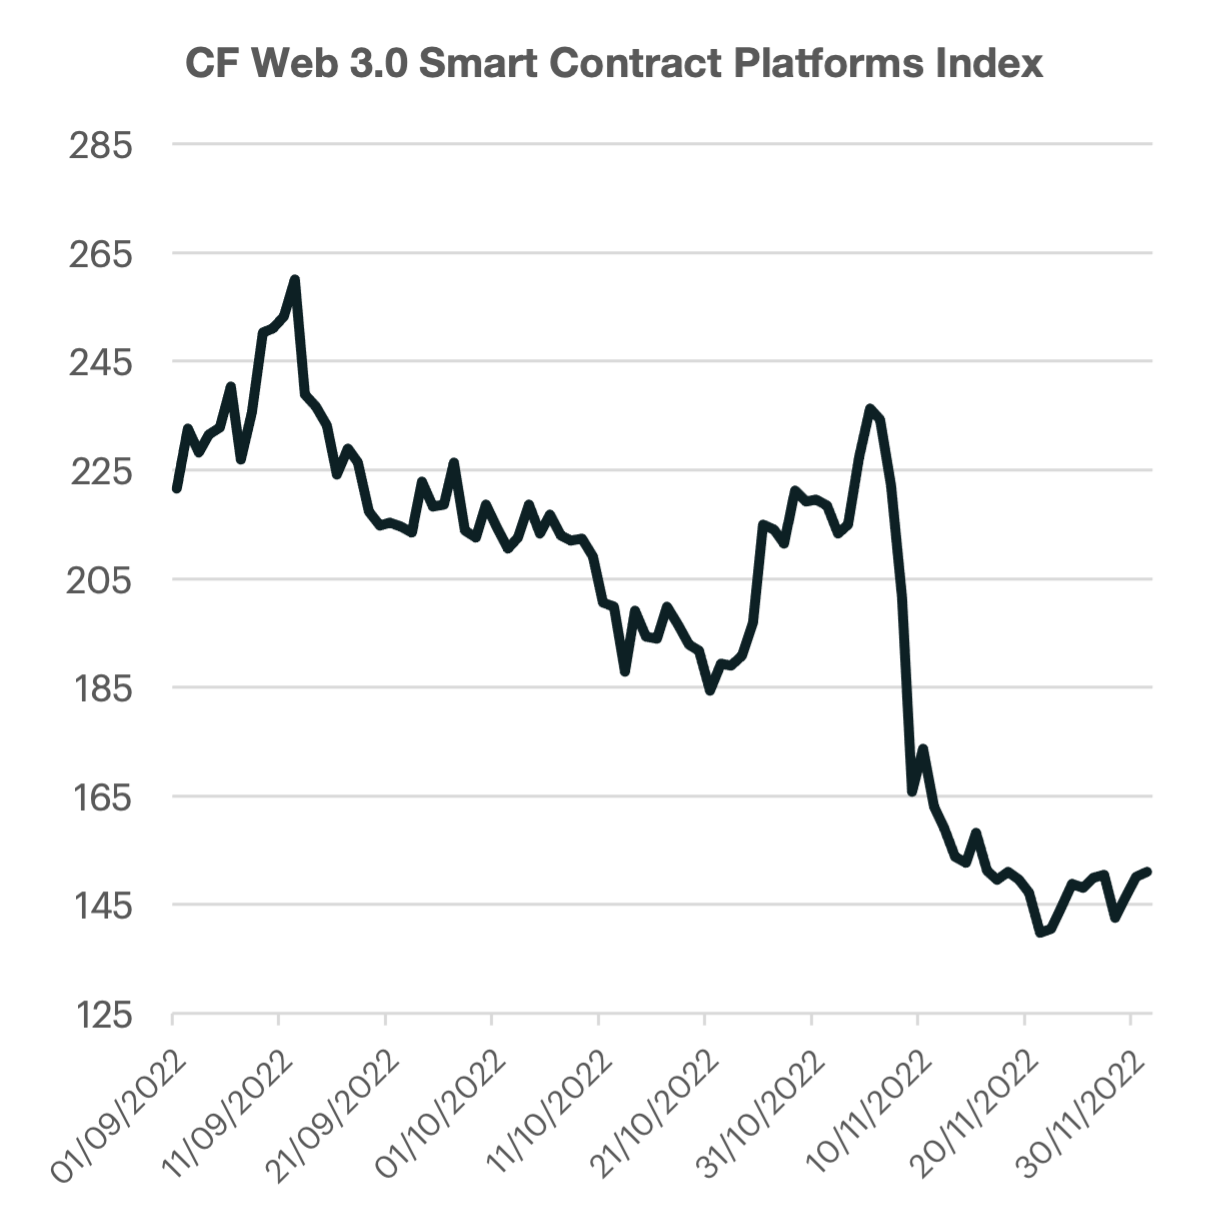
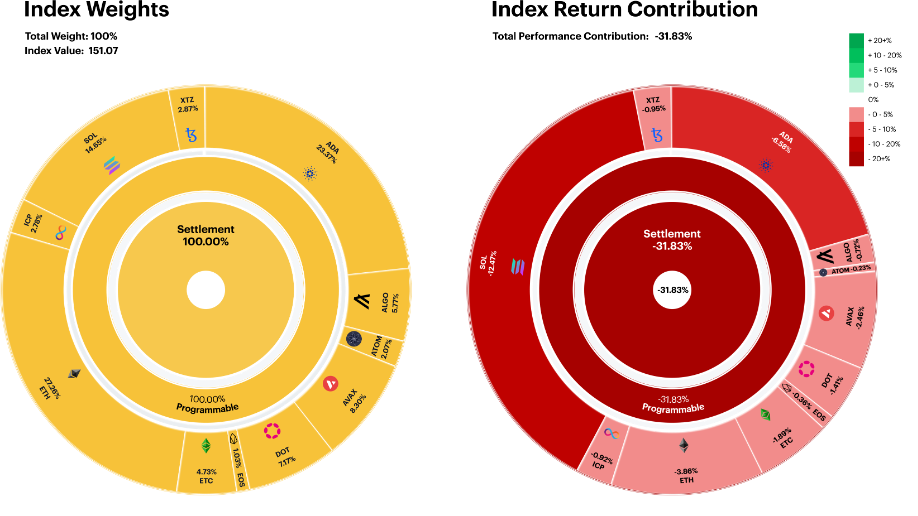
'Heavyweight Solana’ bites Smart Contracts
The higher weighting of Solana (SOL), coupled with weak performance, led to a pronounced drag on our Smart Contract Platforms Index. The total negative contribution of SOL for the rebalance period was almost 40% of the index’s total -31.8% decline.
ATOM continued to perform in a relatively defensive manner, providing the smallest negative performance contribution on the portfolio index.
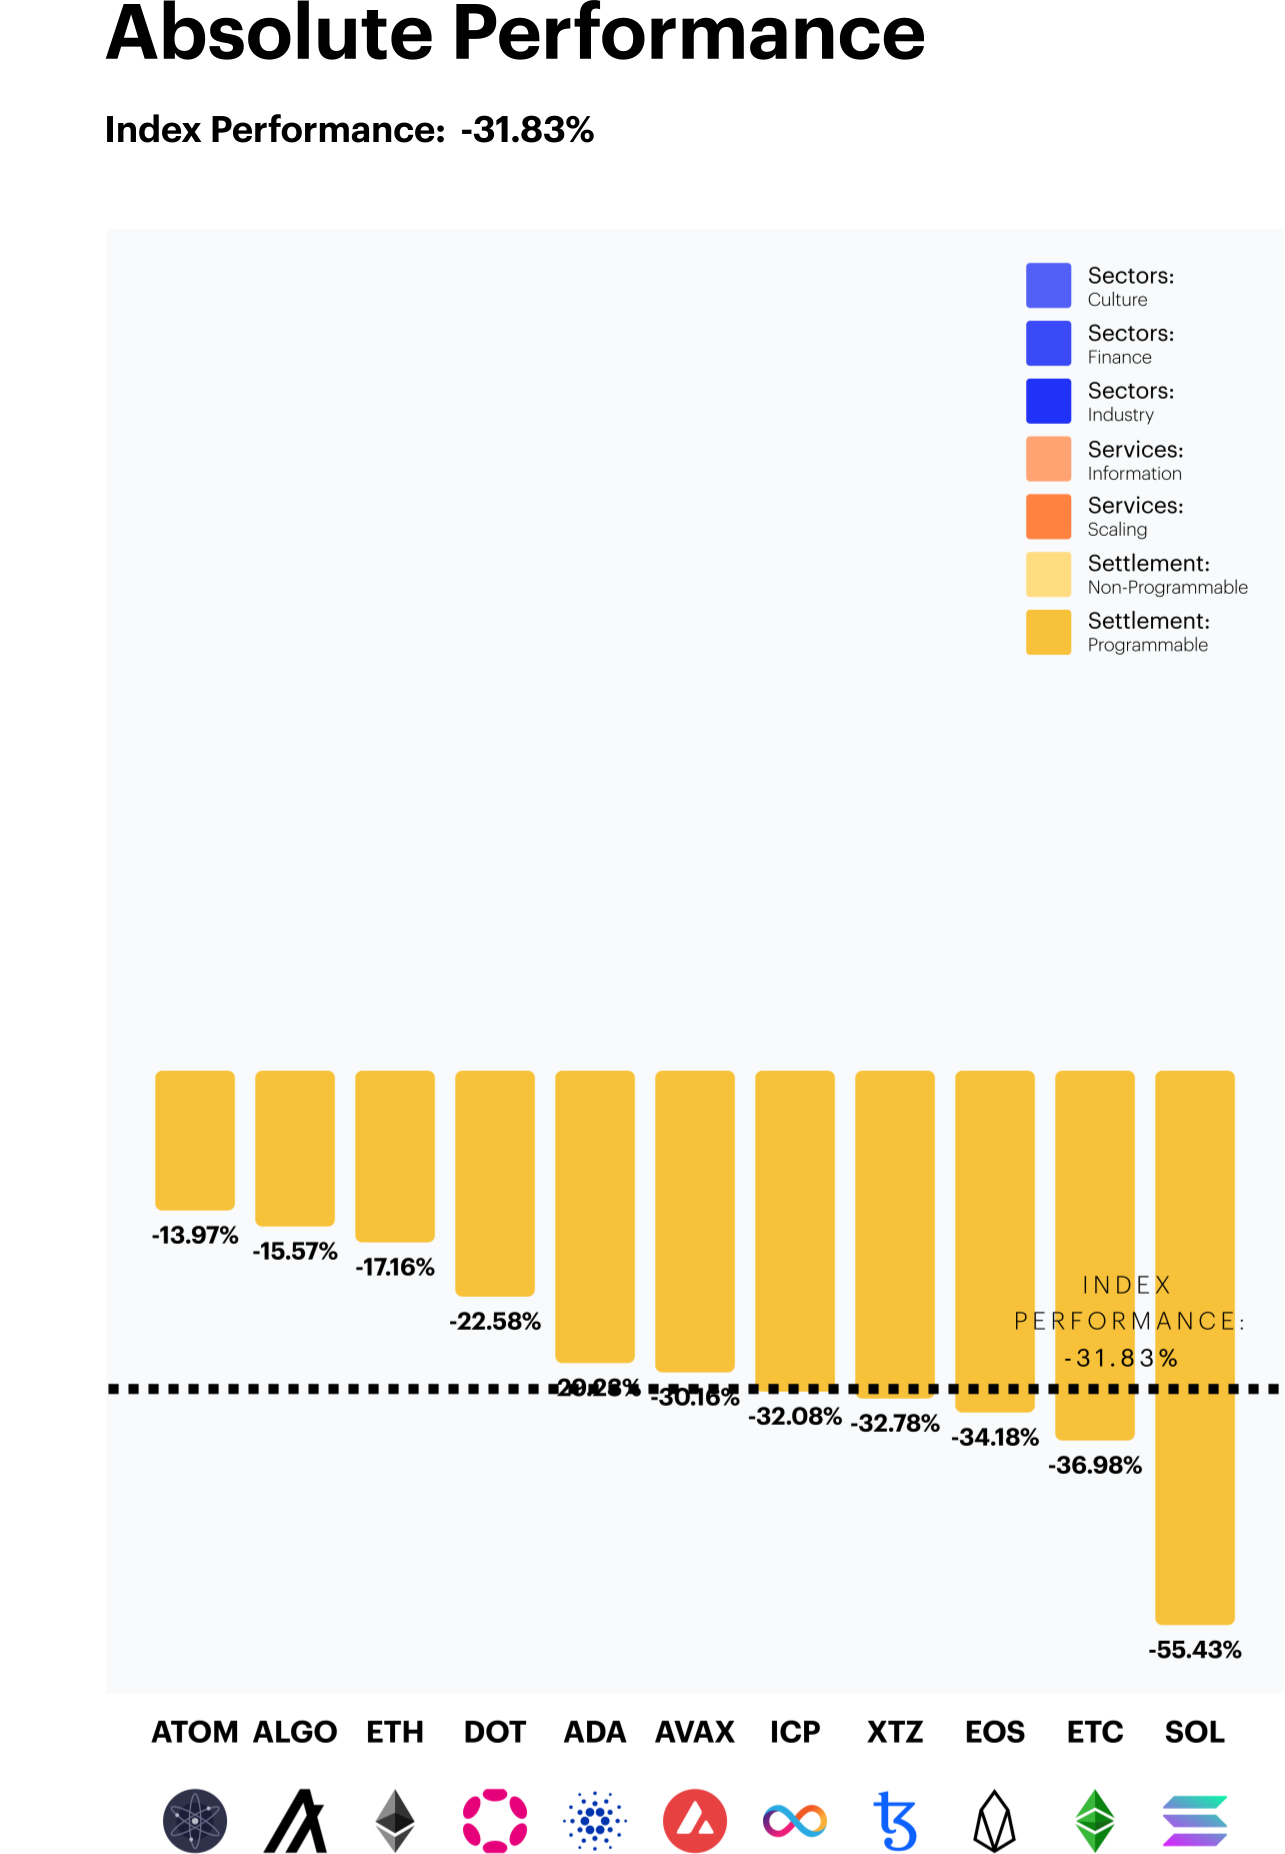
ATOM’s relative momentum intact
Cosmos' native token, ATOM remained the relative outperformer for the second straight period. The “internet of blockchains” token has continued to display lower pricing volatility when compared to the parent index. ETH and ALGO also displayed defensive performance for smart contract investors, each falling approximately half as much in relative terms vs. the index.
Solana (SOL) prices fell -55.4%, finishing the rebalance period as the worst performer. The Ethereum competitor saw steep price declines due to the fallout of FTX/Alameda where it was reported that the Solana foundation had significant exposure to the now defunct crypto exchange. SOL now trades over 90% lower from its November peak.
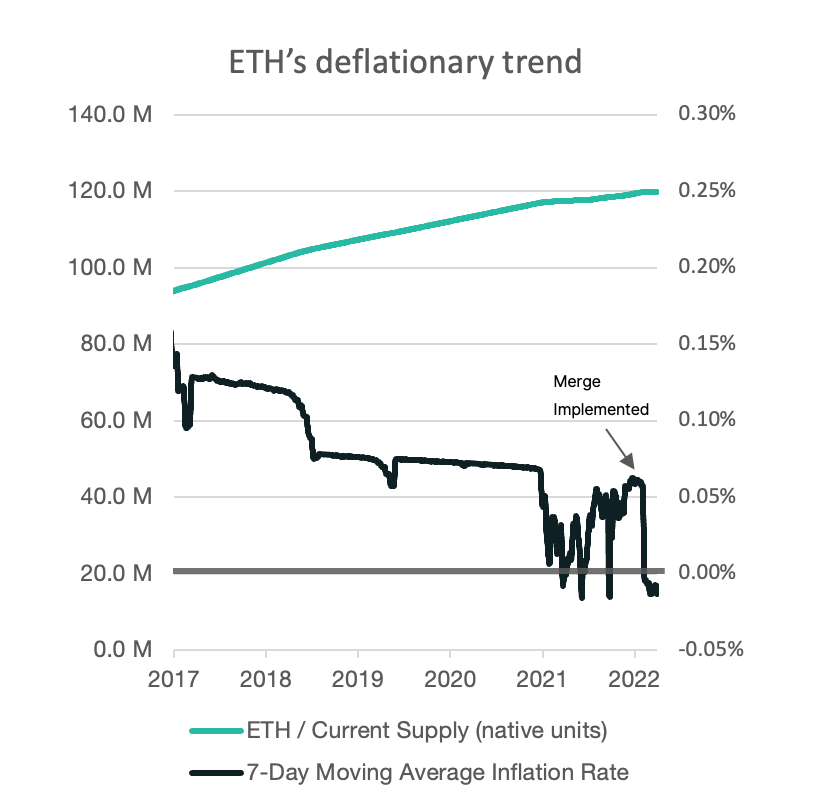
ETH 2.0’s improved tokenomics
Following the recent September upgrade to the Ethereum blockchain, the world's most popular programmable token has seen a shift in its inflationary dynamic. ETH inflation has historically been persistently positive; even after last year's rollout of the EIP-1559 burn mechanism update in August. The 7-day moving average inflation rate has been approximately +0.035% since the EIP-1559 rollout to mid-September 2022.
It now seems that ETH 2.0's new tokenomics and the shift to a proof-of-stake protocol is likely to keep burn rates elevated. This has been especially true after the recent collapse of FTX. According to some estimates, over 53,000 ETH has been burned over the past 30 days, with a large portion of the burn happening immediately after the fallout. This has led to another technical catalyst for ETH going forward.
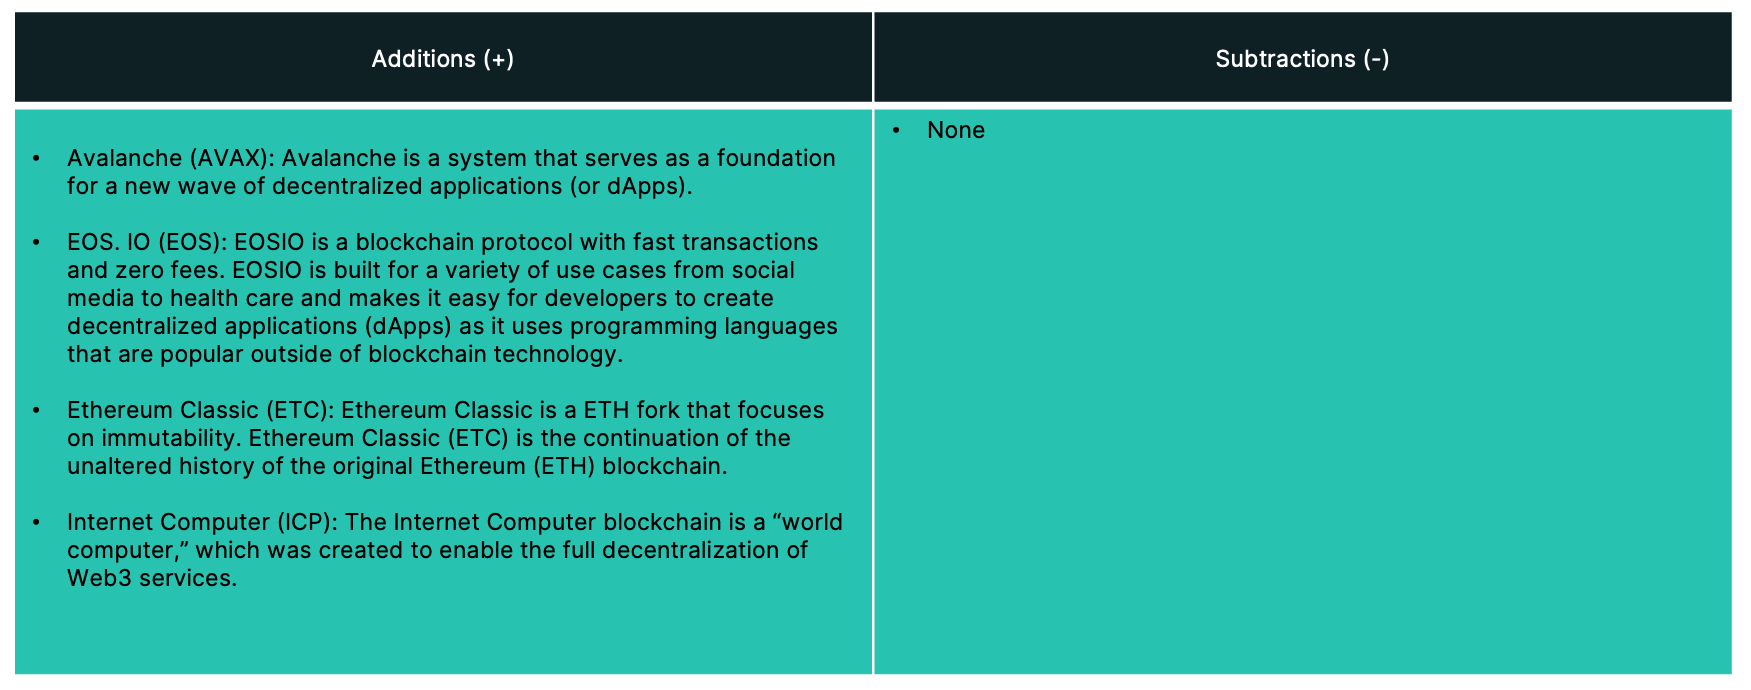
Appendix: constituent changes for current period
CF Digital Culture Composite Index
The CF Digital Culture Composite Index - is a liquid, investible benchmark portfolio index that tracks the return performance of protocols involved in the digitization and tokenization of cultural experiences and artefacts including the Metaverse, NFTs, Gaming, and Music. The index is comprised of three distinct sub-portfolios of fixed weight that represent the components of blockchain architecture that are required to deliver the digitised culture to individual and institutional end users; Digital Culture Applications, Services and Settlement Blockchains. Digital assets are classified in accordance with the CF Digital Asset Classification Structure (DACS) for sub-portfolio eligibility. Digital assets are weighted by free float market capitalisation within each sub-portfolio in accordance with the CF Digital Asset Series Ground Rules and the index methodology. The index is calculated and published once a day at 4:00 pm London Time. It is reconstituted on a twice yearly basis and rebalanced quarterly. The CF Digital Culture Composite Index - London was incepted on February 1st 2022 with a value of 1,000.
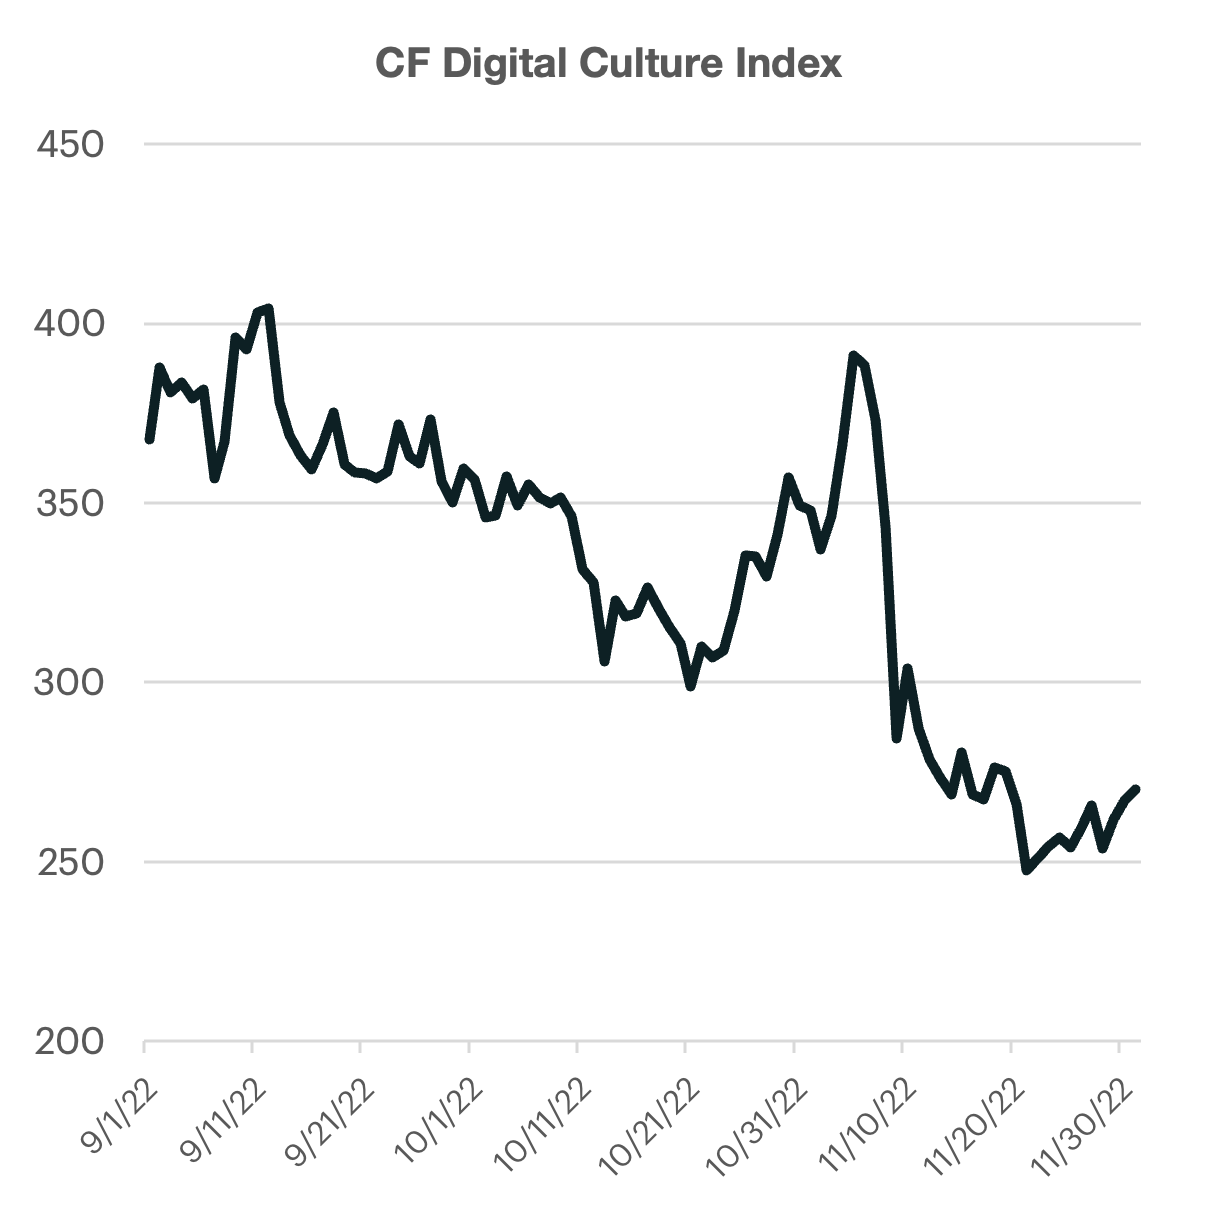
Culture lags Scaling again
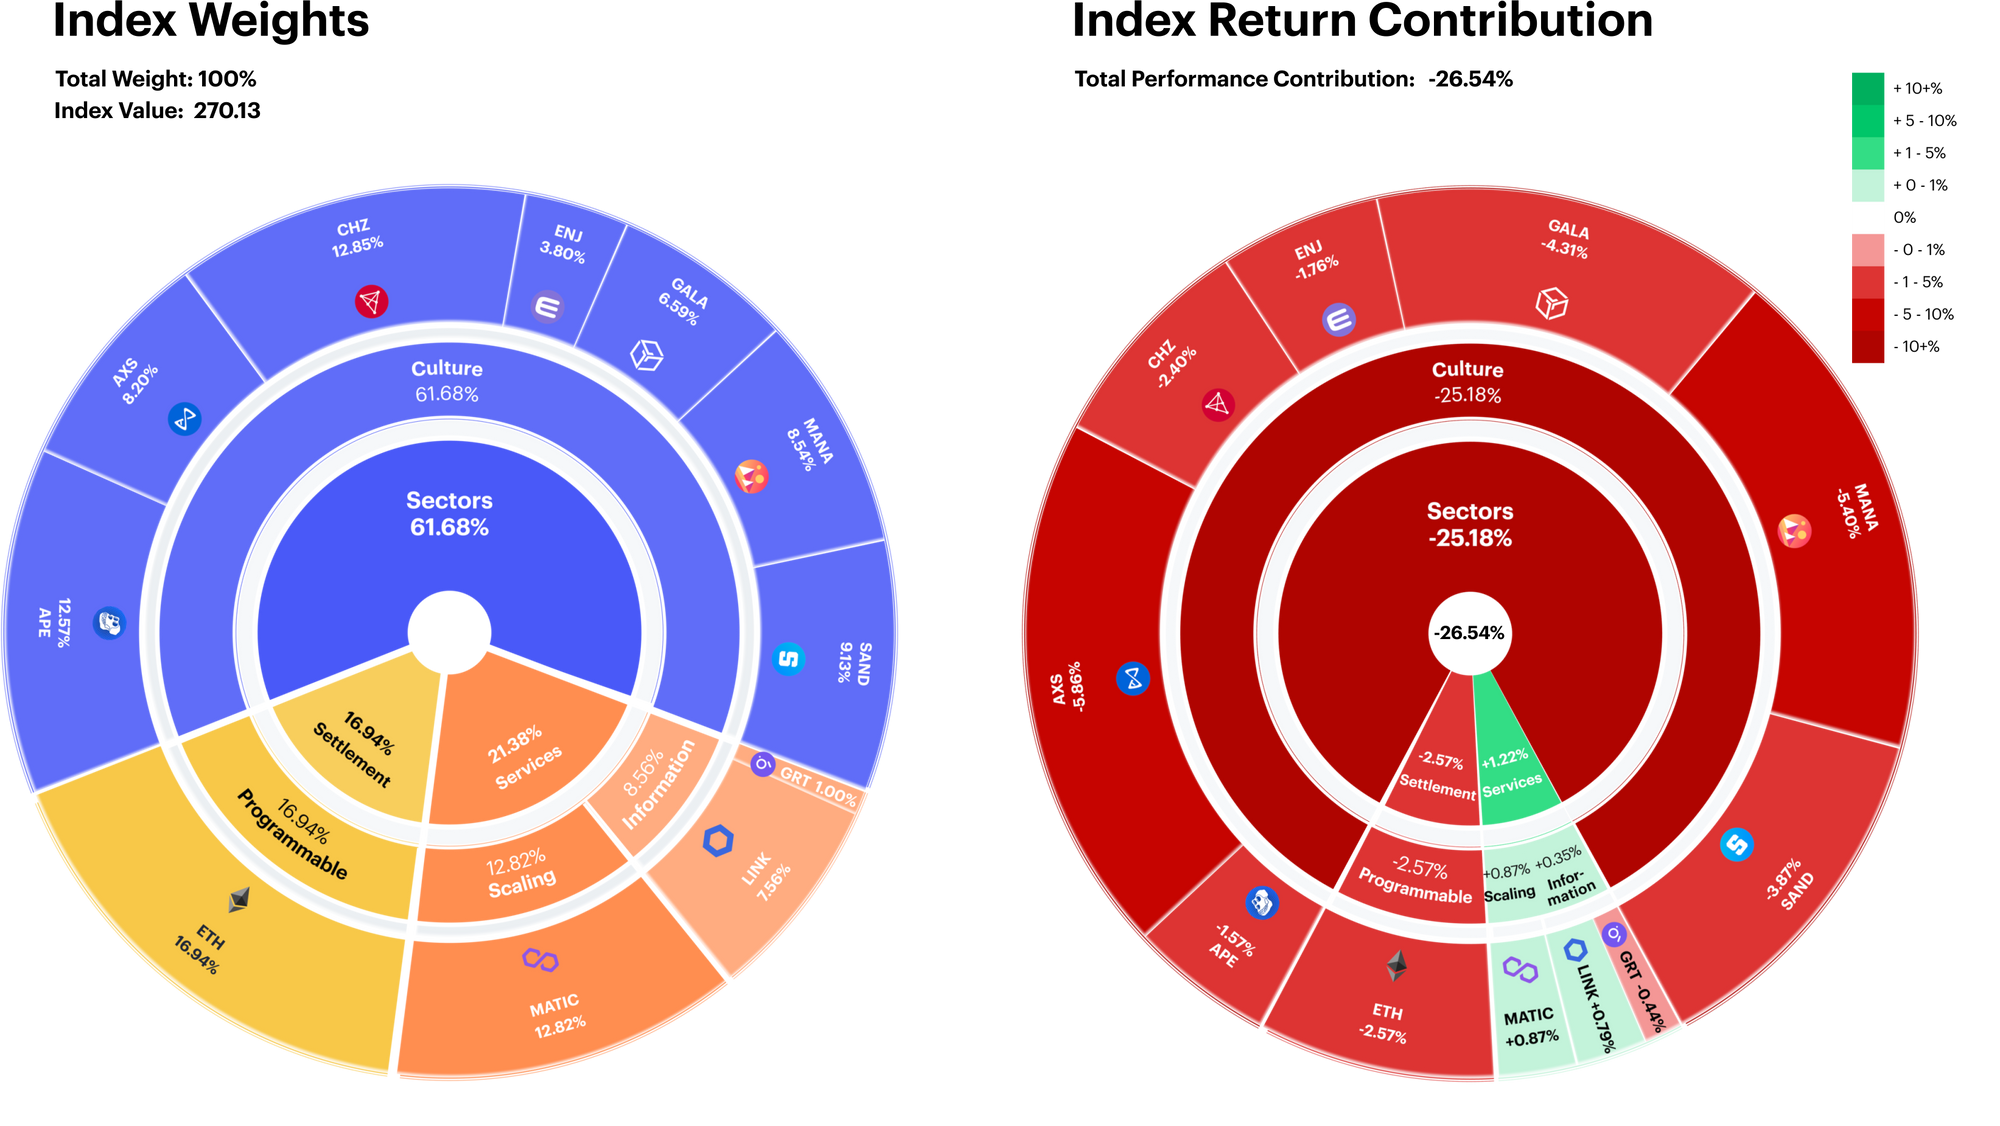
The CF Digital Culture index fell -26.5% as performance contributions from the headline DACS segment (Culture), overwhelmingly negated positive performance contributions from services segment.
Taking a closer look, the larger weights in Axie Infinity (AXS) and Decentraland (MANA) contributed to approximately 40% of the negative price performance in the index. Meanwhile, the modest weighting in Chainlink (LINK) and Polygon (MATIC) only amounted to 1.6% of positive index return.
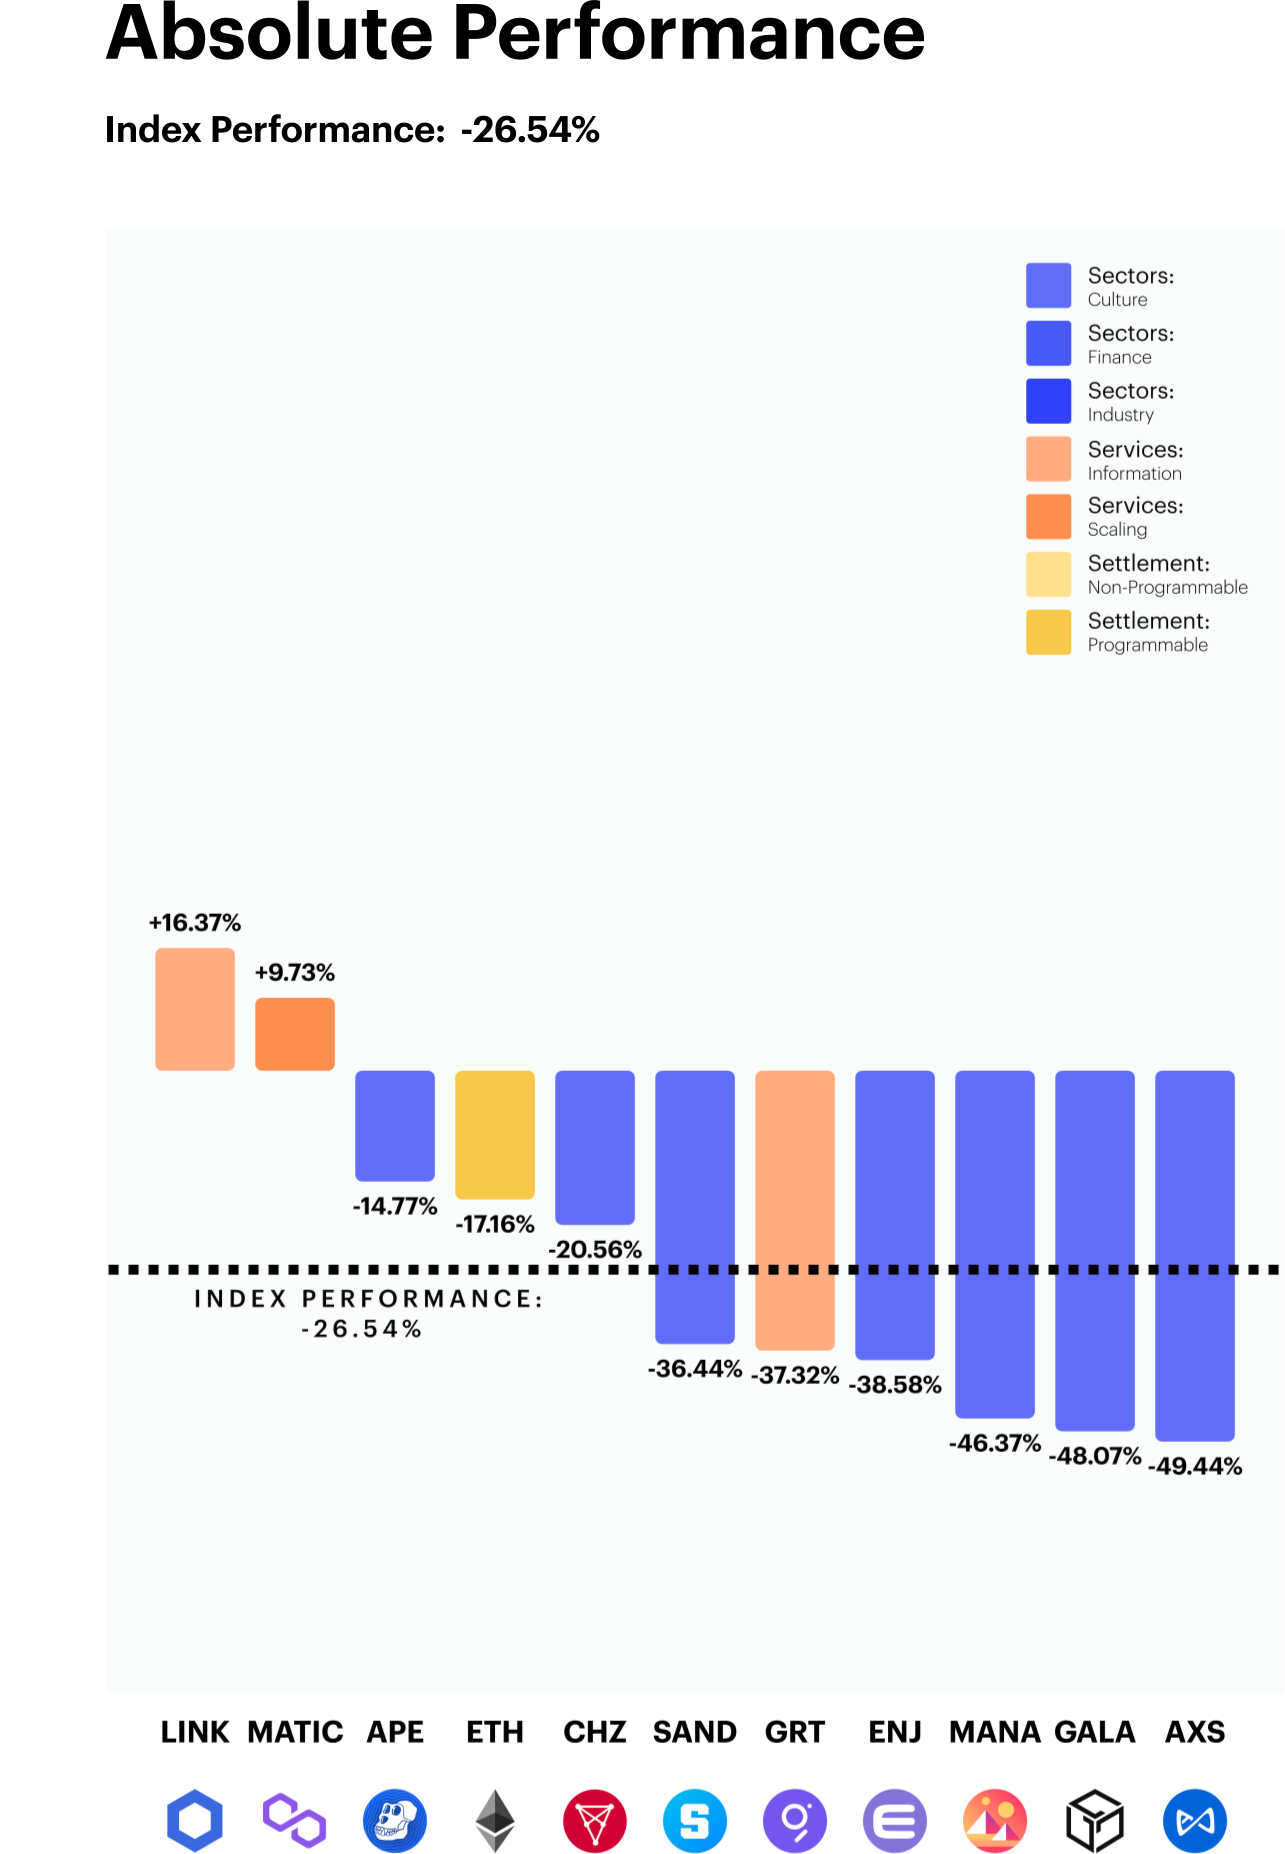
Crypto winter chills culture sentiment
Market breadth in the CF Digital Culture Composite continued to be historically weak. All constituents in the headline segment finished the rebalance period in negative territory, with three tokens almost losing half of their market cap. The recent collapses of major crypto organizations, coupled with bearish sentiment surrounding the future of the metaverse, has had a chilling impact on investor sentiment in the space.
Taking a deeper look, we can see that the play-to-earn tokens, such as AXS, GALA, and MANA, were major laggards when compared to the rest of the digital culture cohort. The average negative performance of these gaming related tokens was over twice the amount the other metaverse related assets (-43.7% vs -17.5%, respectively).
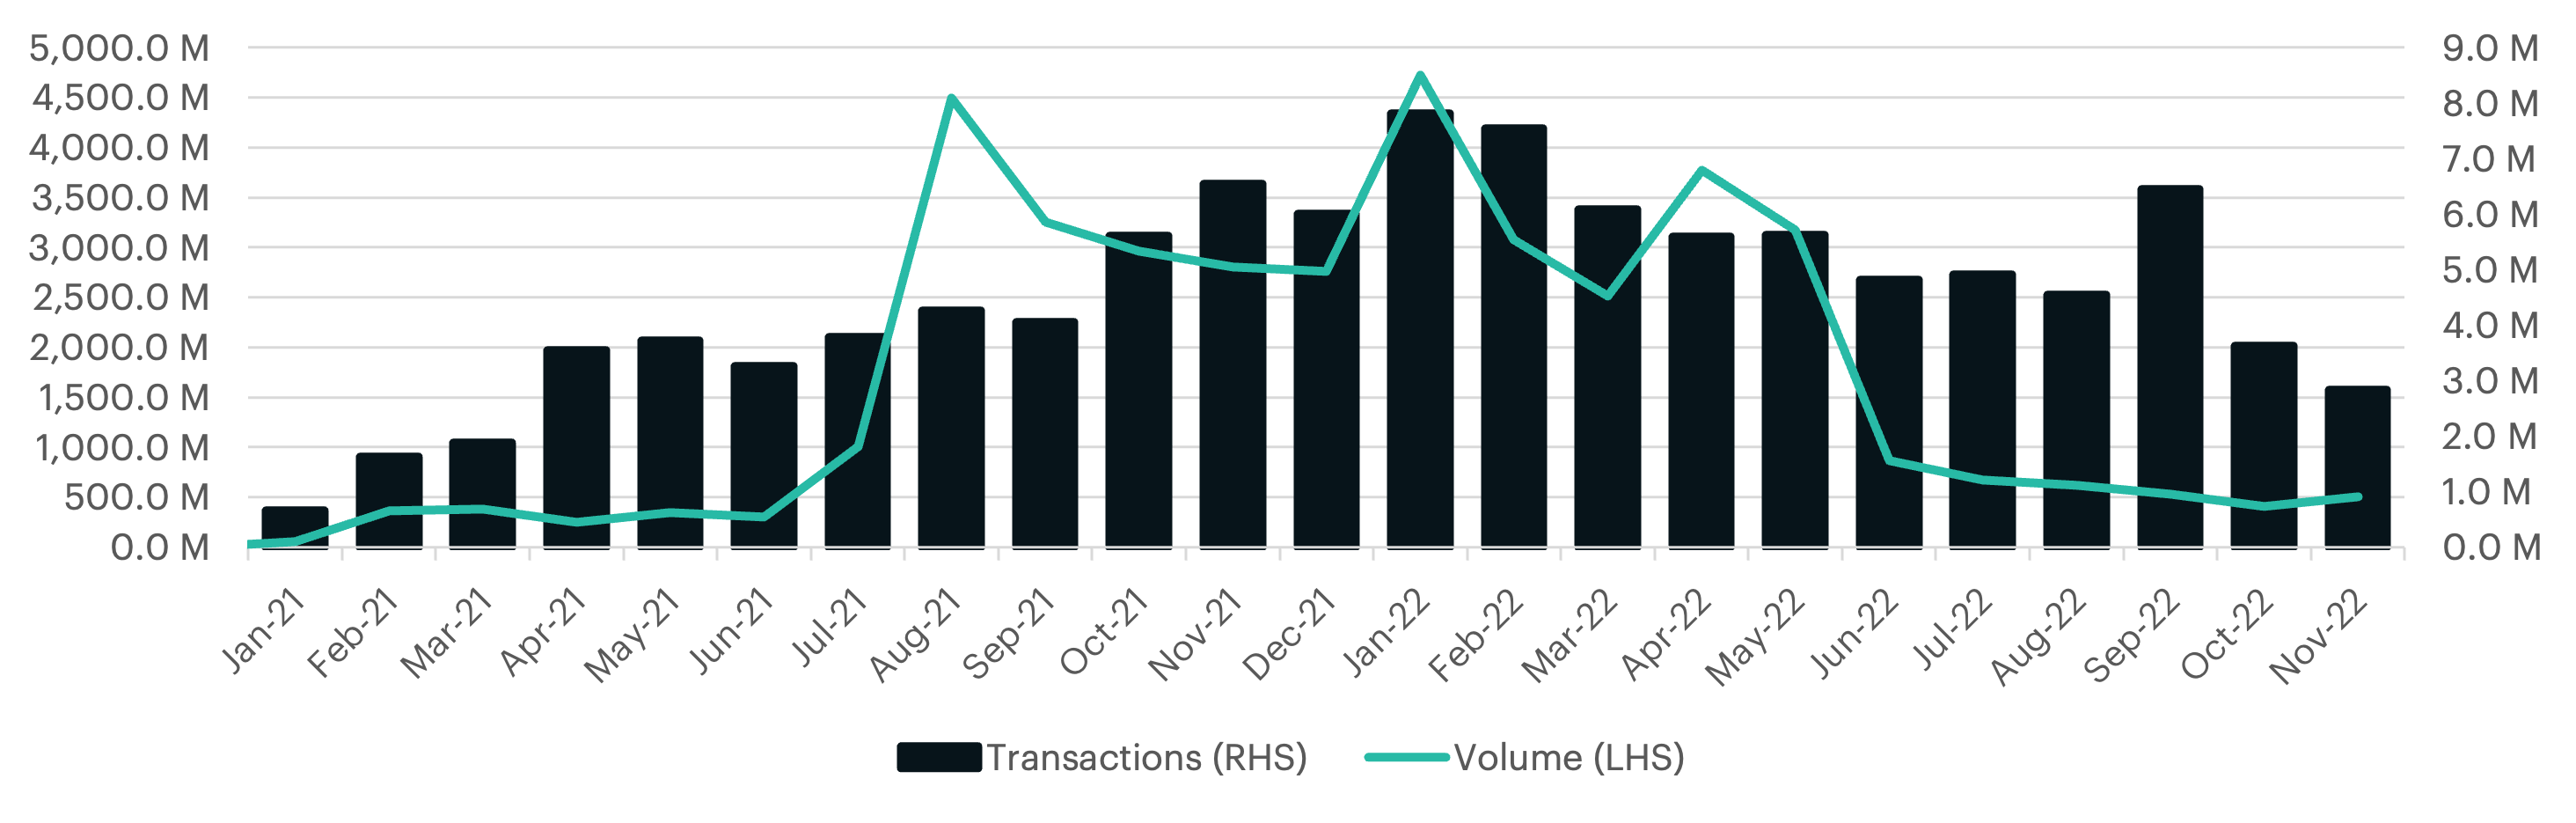
NFT Market Activity Update
The overall decline in NFT transactions continued over the past quarter. The metric, which can be seen as a proxy for overall sentiment in the space, has suffered greatly during this bear-market cycle. Meanwhile, it does appear that the negative price momentum has recently stabilized. The slight uptick in prices in November helped lift NFT volumes.
Appendix: constituent changes for current period
CF Blockchain Infrastructure Index
The CF Blockchain Infrastructure Index is a liquid, investible benchmark portfolio index that tracks the return performance of blockchain services within the Digital Asset space. The index seeks to capture returns of all eligible protocols under the Services category of the CF Digital Asset Classification Structure. Index constituents are weighted by using a capped free-float market capitalisation in accordance with the CF Digital Asset Series Ground Rules and the index methodology.
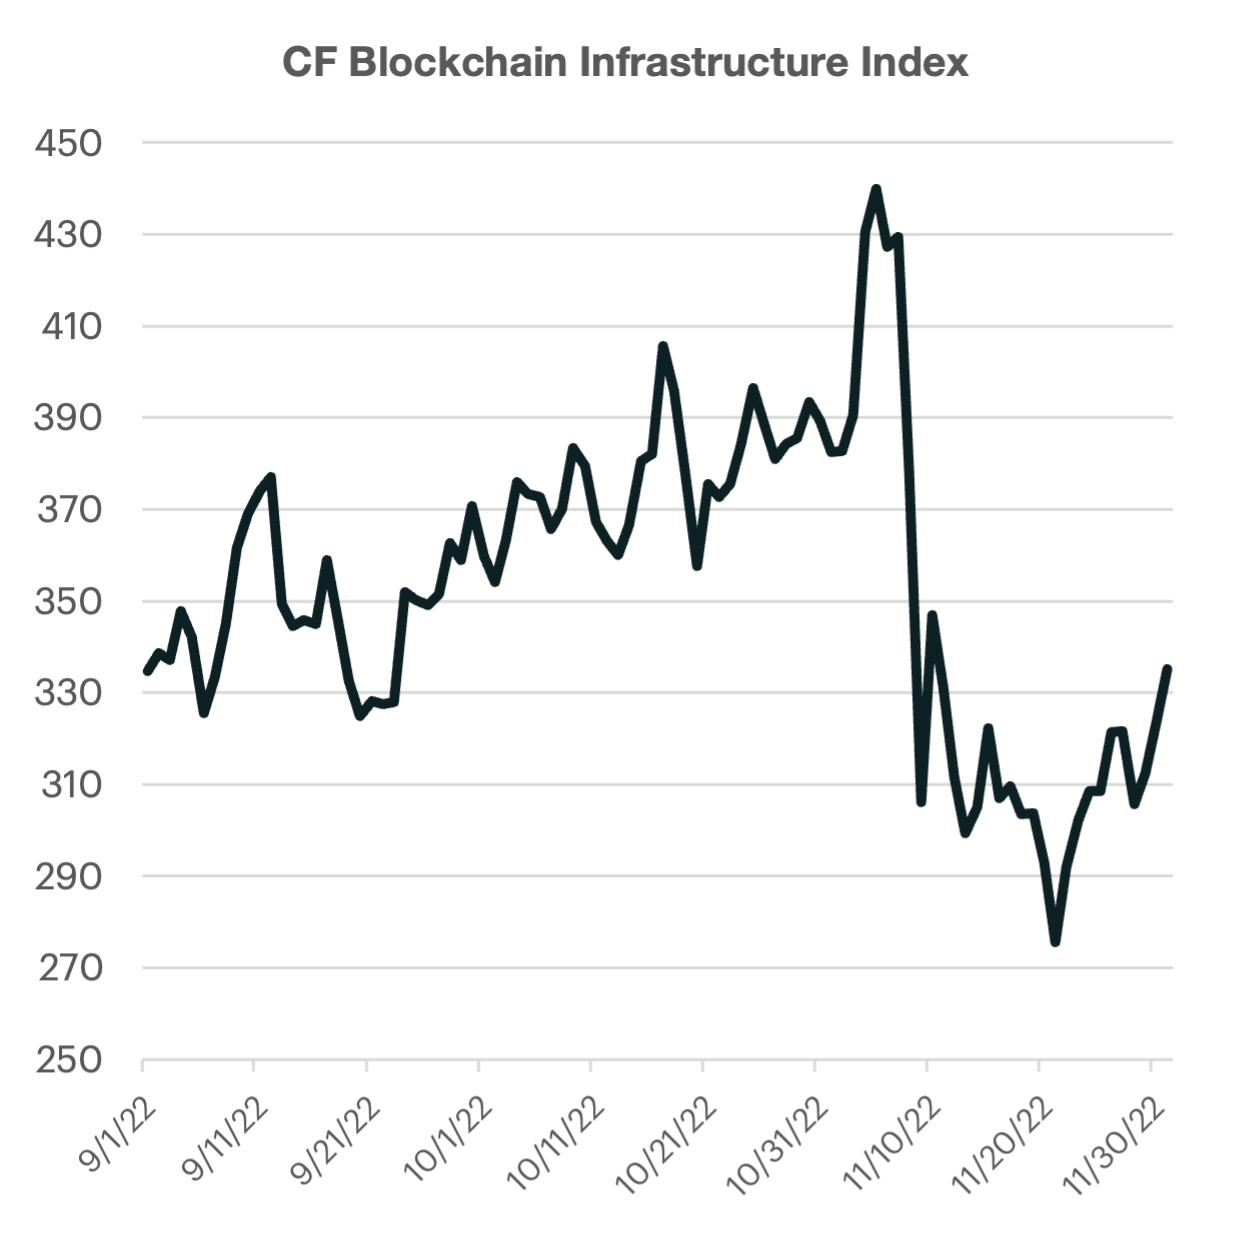
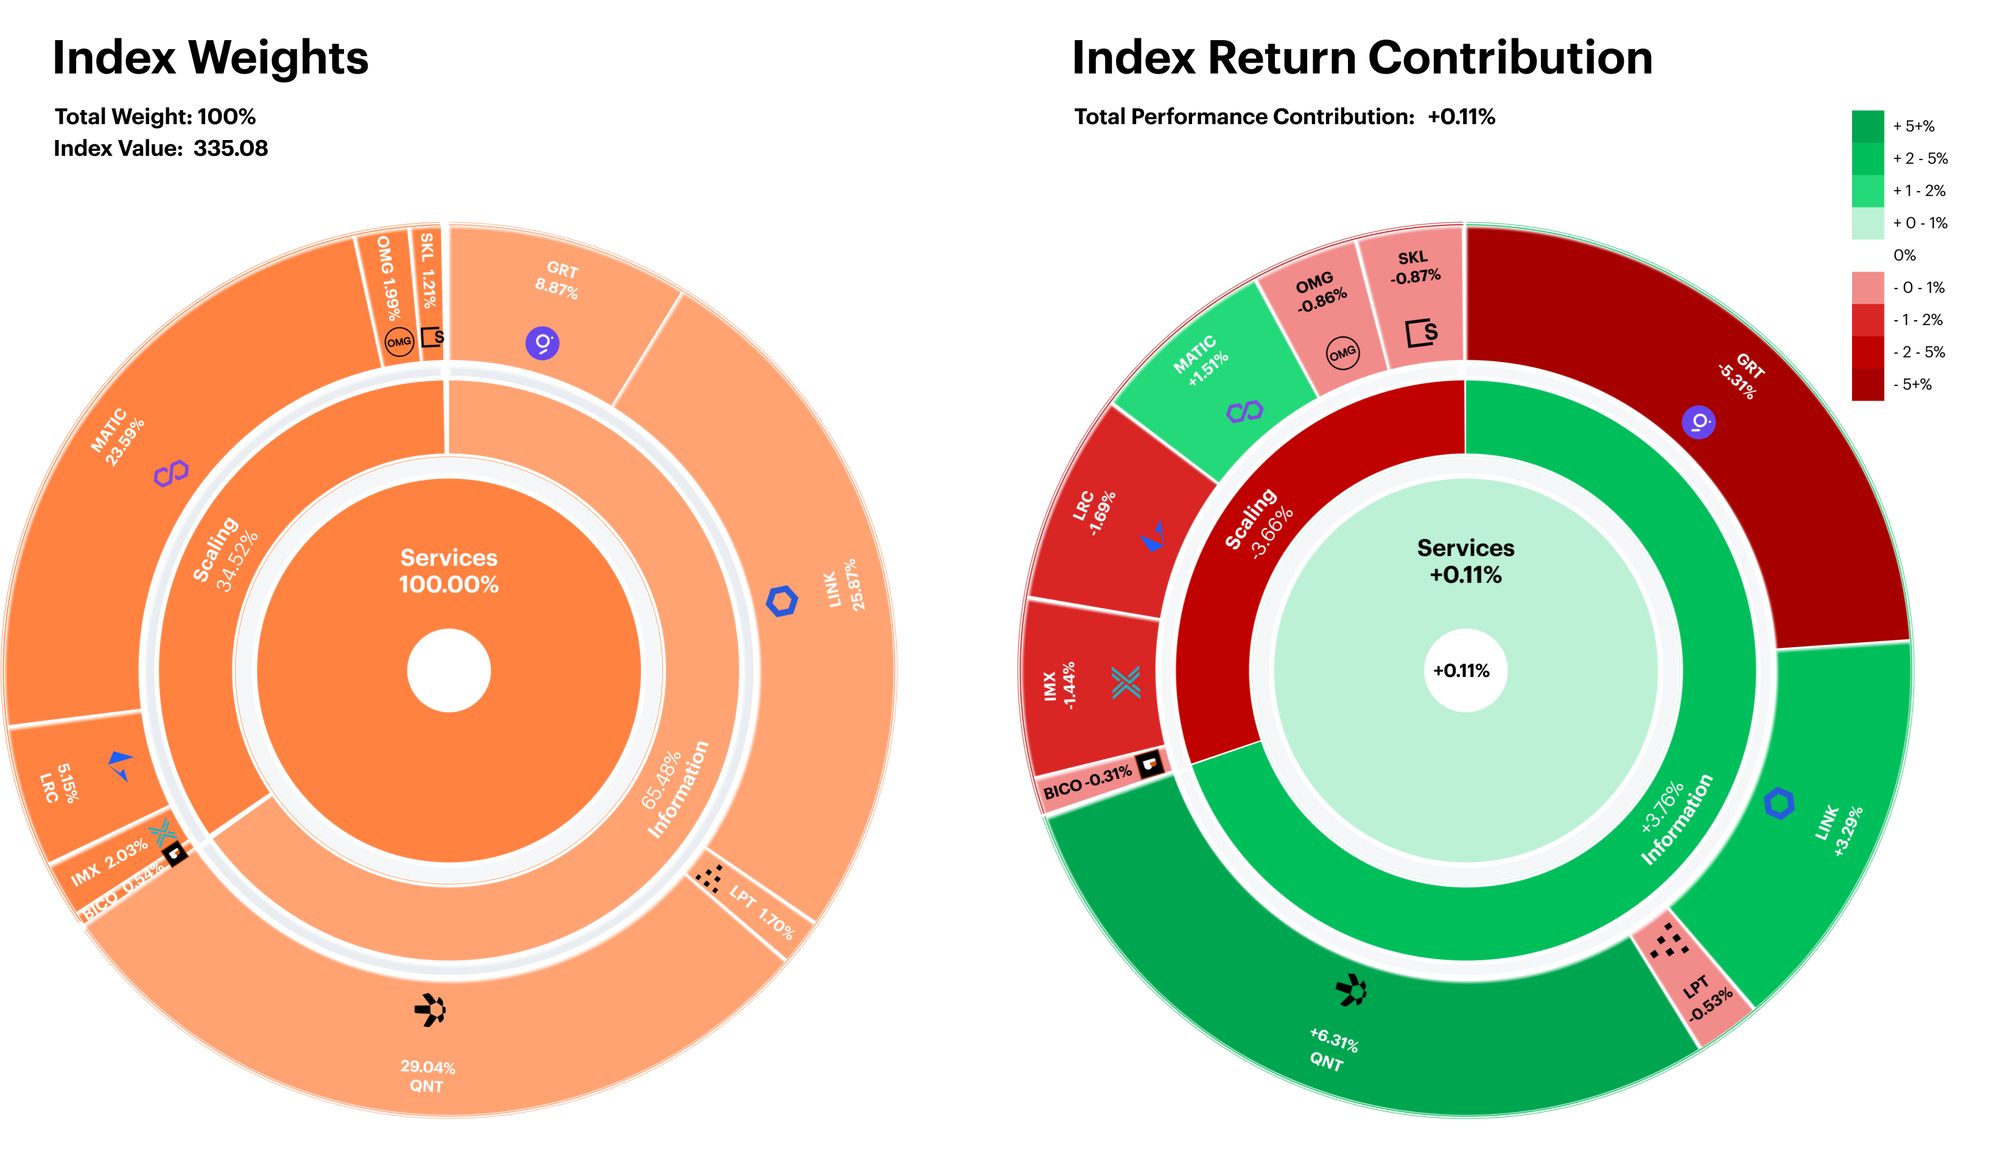
Infrastructure nets neutral
The CF Blockchain Infrastructure Index finished the rebalancing period mostly flat, notching a +0.11% increase in value. The index composition has a slight bias toward Scaling protocols, which contributed -3.7% of negative performance. This was offset by the positive +3.8% contribution from the Information segment.
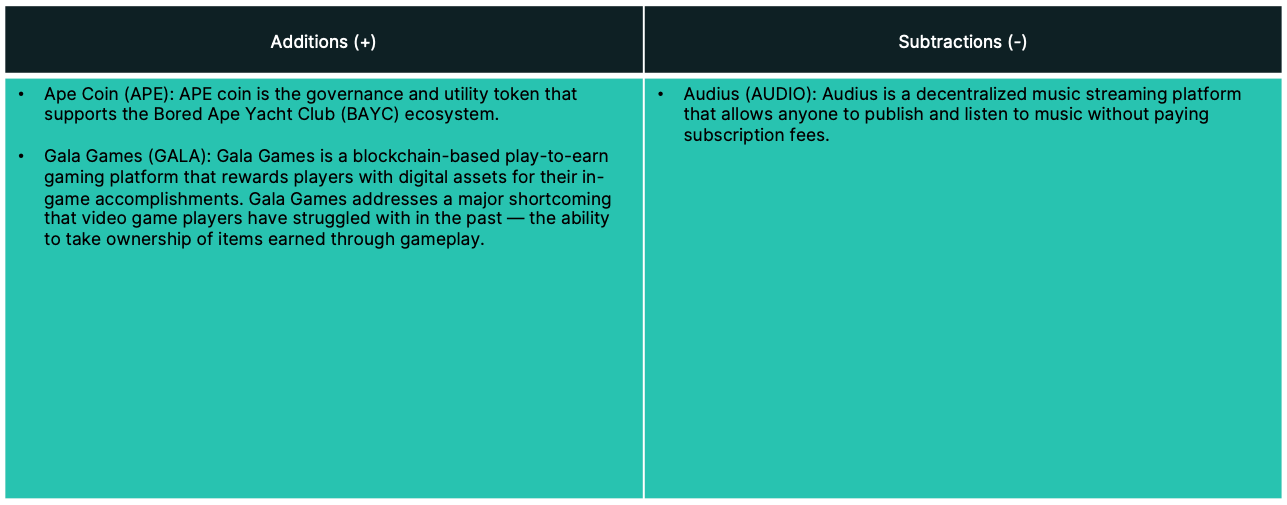
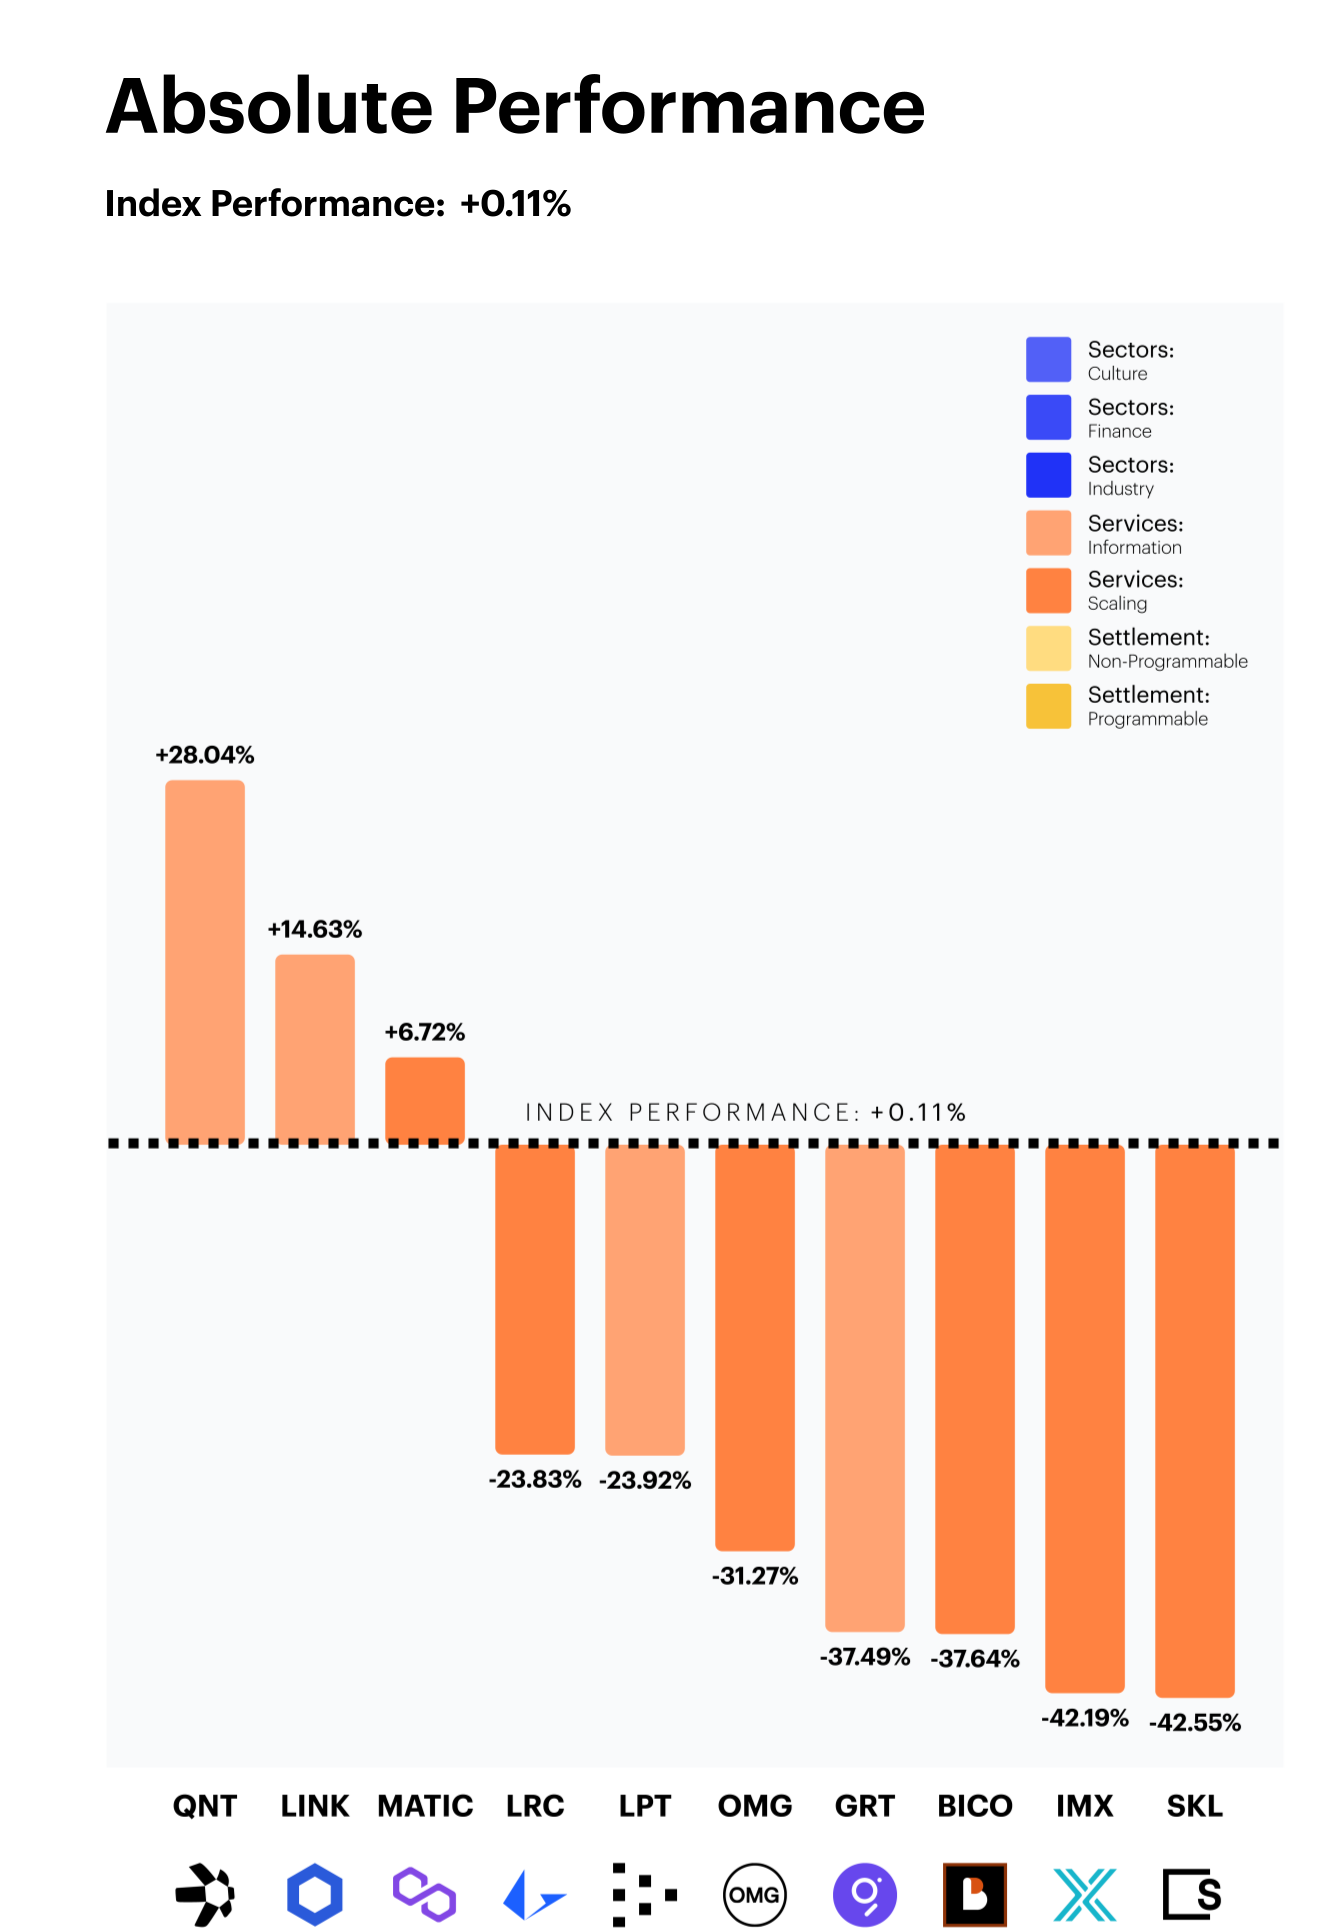
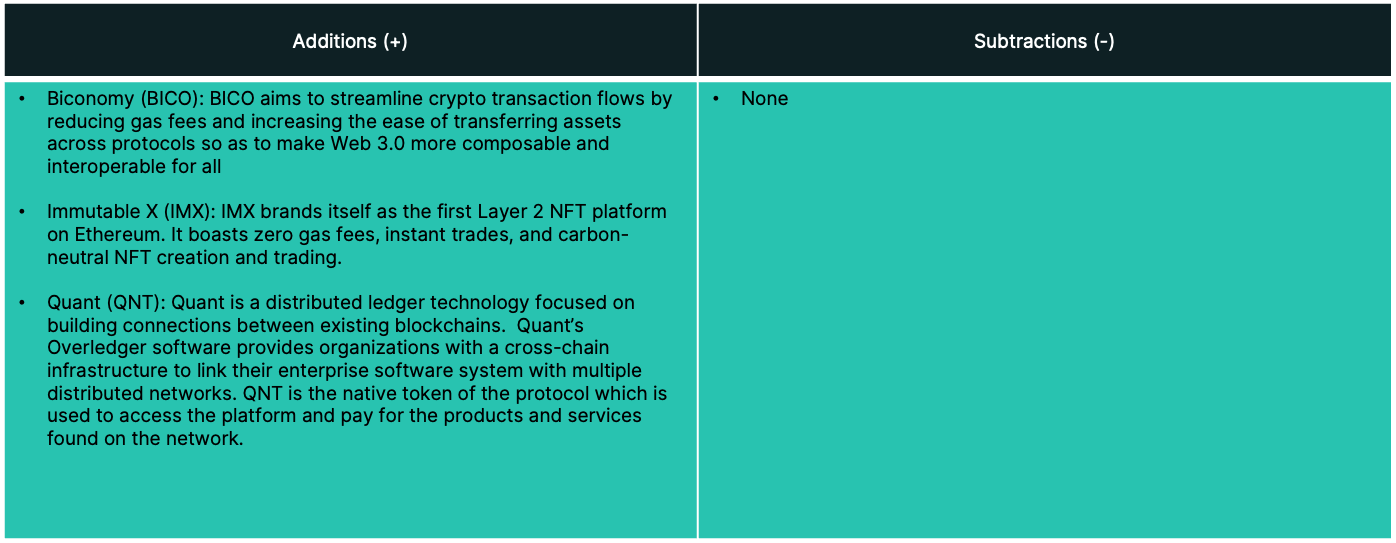
From an individual asset level, recently added Quant (QNT) contributed the most positive performance (+6.3%) due to its sizable weight and stellar performance.
Select standouts mask broadly negative breadth
Although it may appear that the performance of our Blockchain Infrastructure Index finished the quarter in a truly split fashion, most tokens in each category ended the rebalance period in negative territory. Information saw Quant (QNT) and Chainlink (LINK), lead their peer group. QNT has seen strong bouts of price outperformance as a series of developer upgrades and strategic partnerships helped maintain positive price momentum. Meanwhile, LINK’s recent announcement of the launch of its novel staking program has garnered investor interest. Lastly, MATIC, a Scaling protocol continued to display defensive pricing characteristics in a broadly negative environment.
Major laggards included Skale (SKL) and Immutable X (IMX), which both saw steep declines following the collapse of FTX/Alameda.
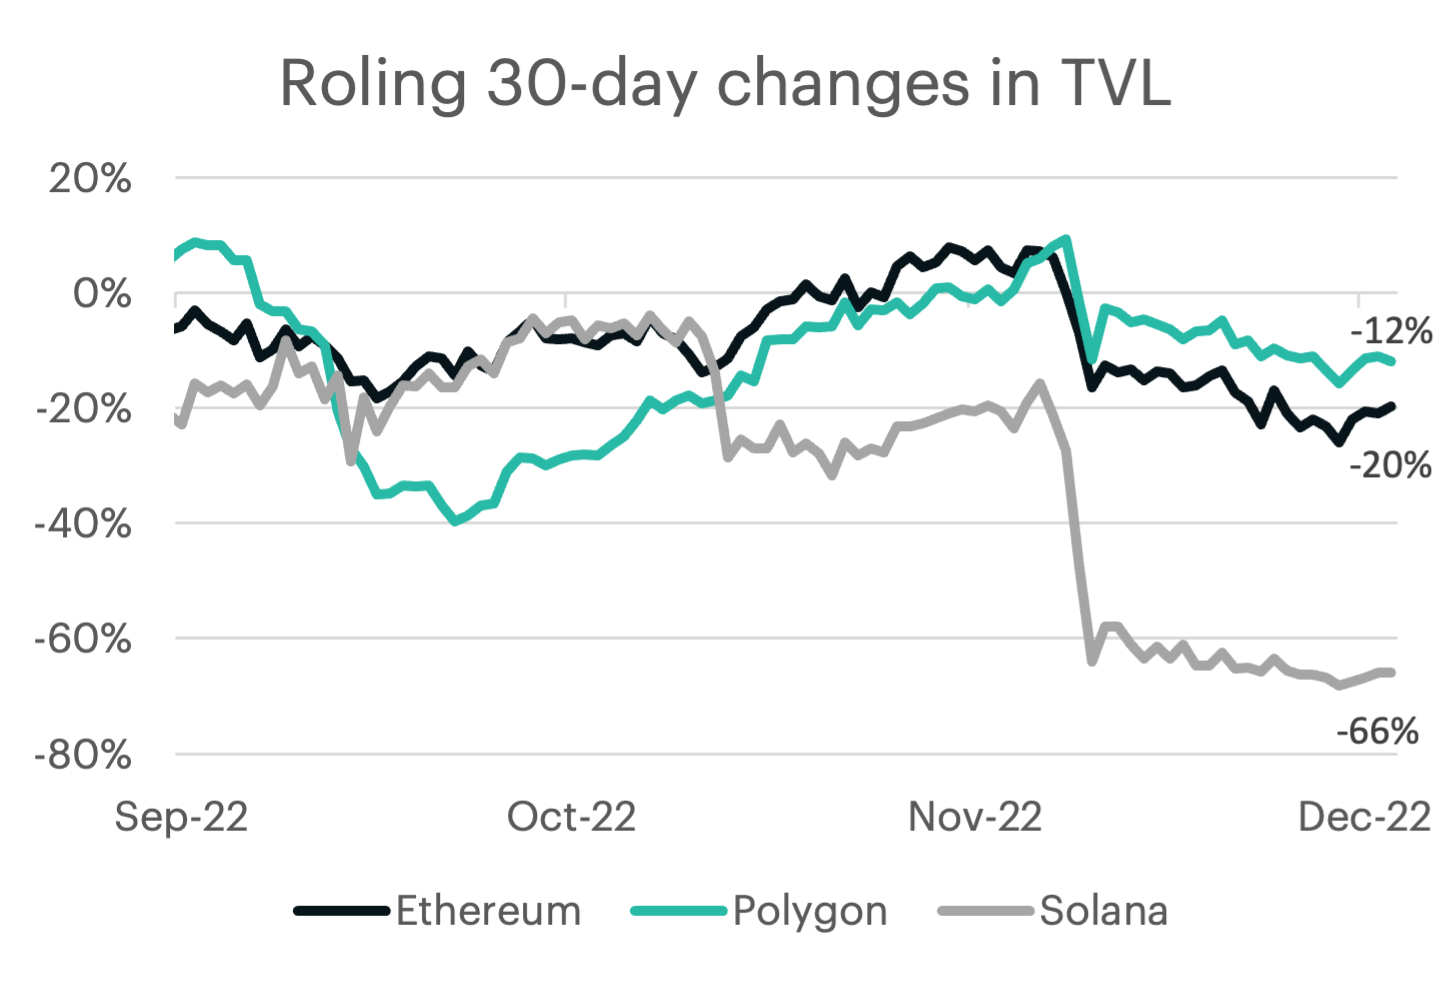
TVL fundamentals post FTX
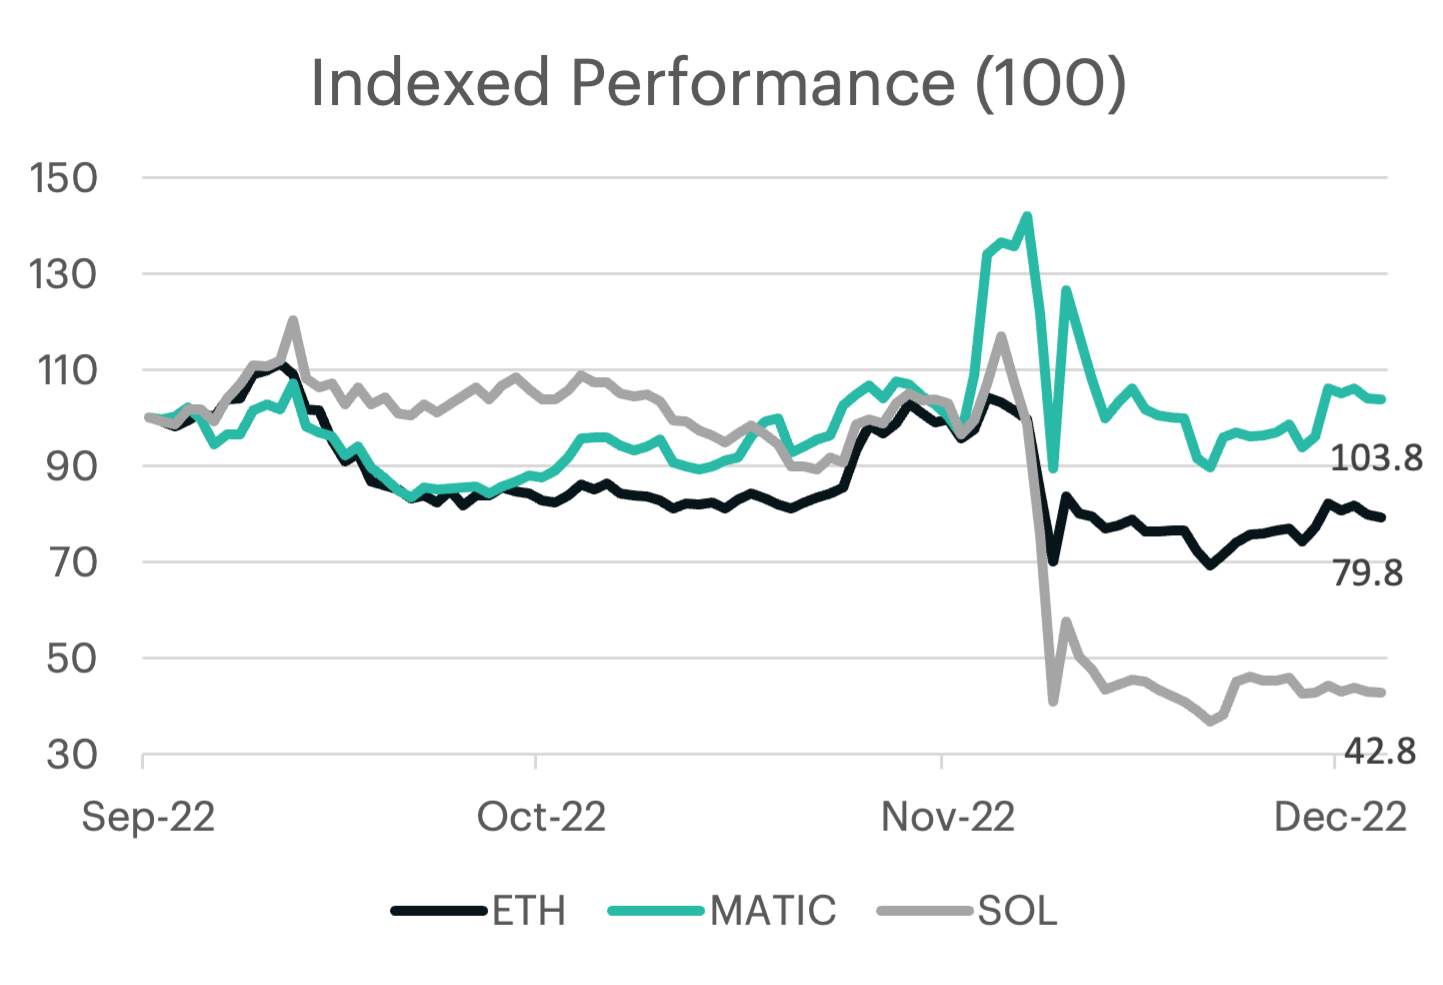
The surprise collapse of FTX has had a profound impact on the price performance of some of our leading Blockchain Infrastructure constituents. One way to better explain this is to analyse the change in the Total Value Locked (TVL), which can be seen as a fundamental metric for activity. Solana’s exposure to FTX (through reported investments and custodied assets), has caused the amount of TVL on the blockchain to decrease 66% since September 1st. This decrease was much more profound than its peers, and the market price of SOL has proportionately reflected this, falling almost 60% over the same time period.
Appendix: constituent changes for current period
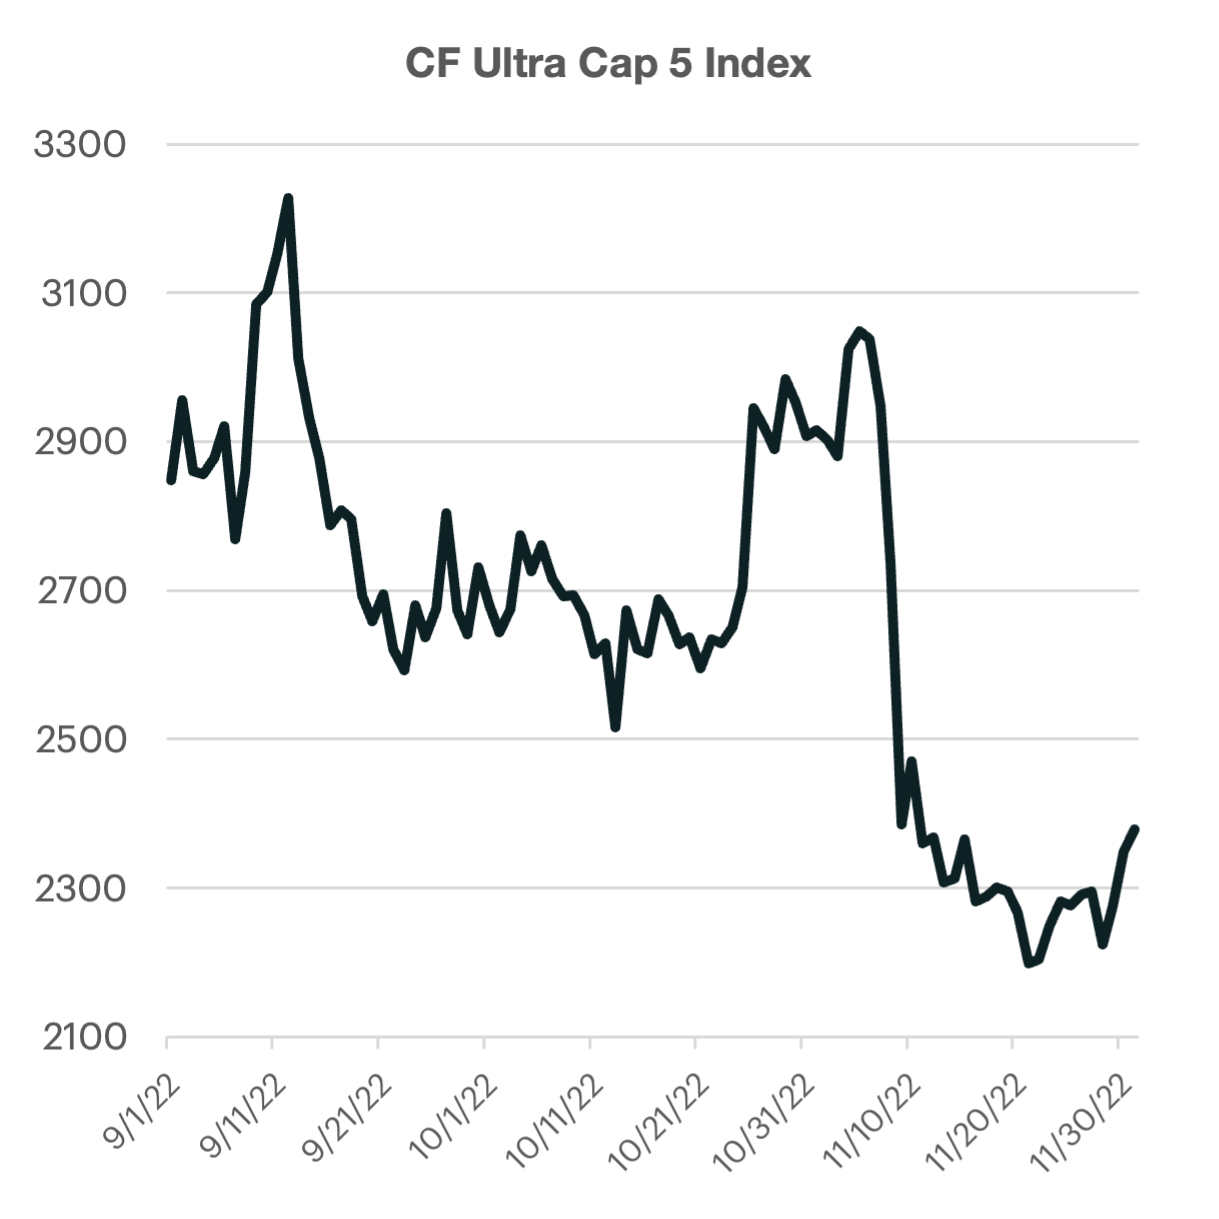
CF Ultra Cap 5 Index
The CF Cryptocurrency Ultra Cap 5 (CFUC5) is an investible benchmark index tracking the performance of a free float market capitalization weighted portfolio of the 5 largest cryptocurrencies by market capitalization. It is the first true measure of the market beta of cryptocurrencies being a Registered Benchmark under EU BMR. All pricing sources for constituents of the index are also themselves Registered Benchmarks. The index is calculated and published once every second in accordance with the methodology. The portfolio composition is determined by the CF Digital Asset Index Family Multi Asset Series Ground Rules with constituent reviews taking place twice a year and monthly rebalancing. The index was launched on August 18th 2020 with an inception date of September 1st 2018 at a value of 1000.
Big-blues outweigh LINK’s rise
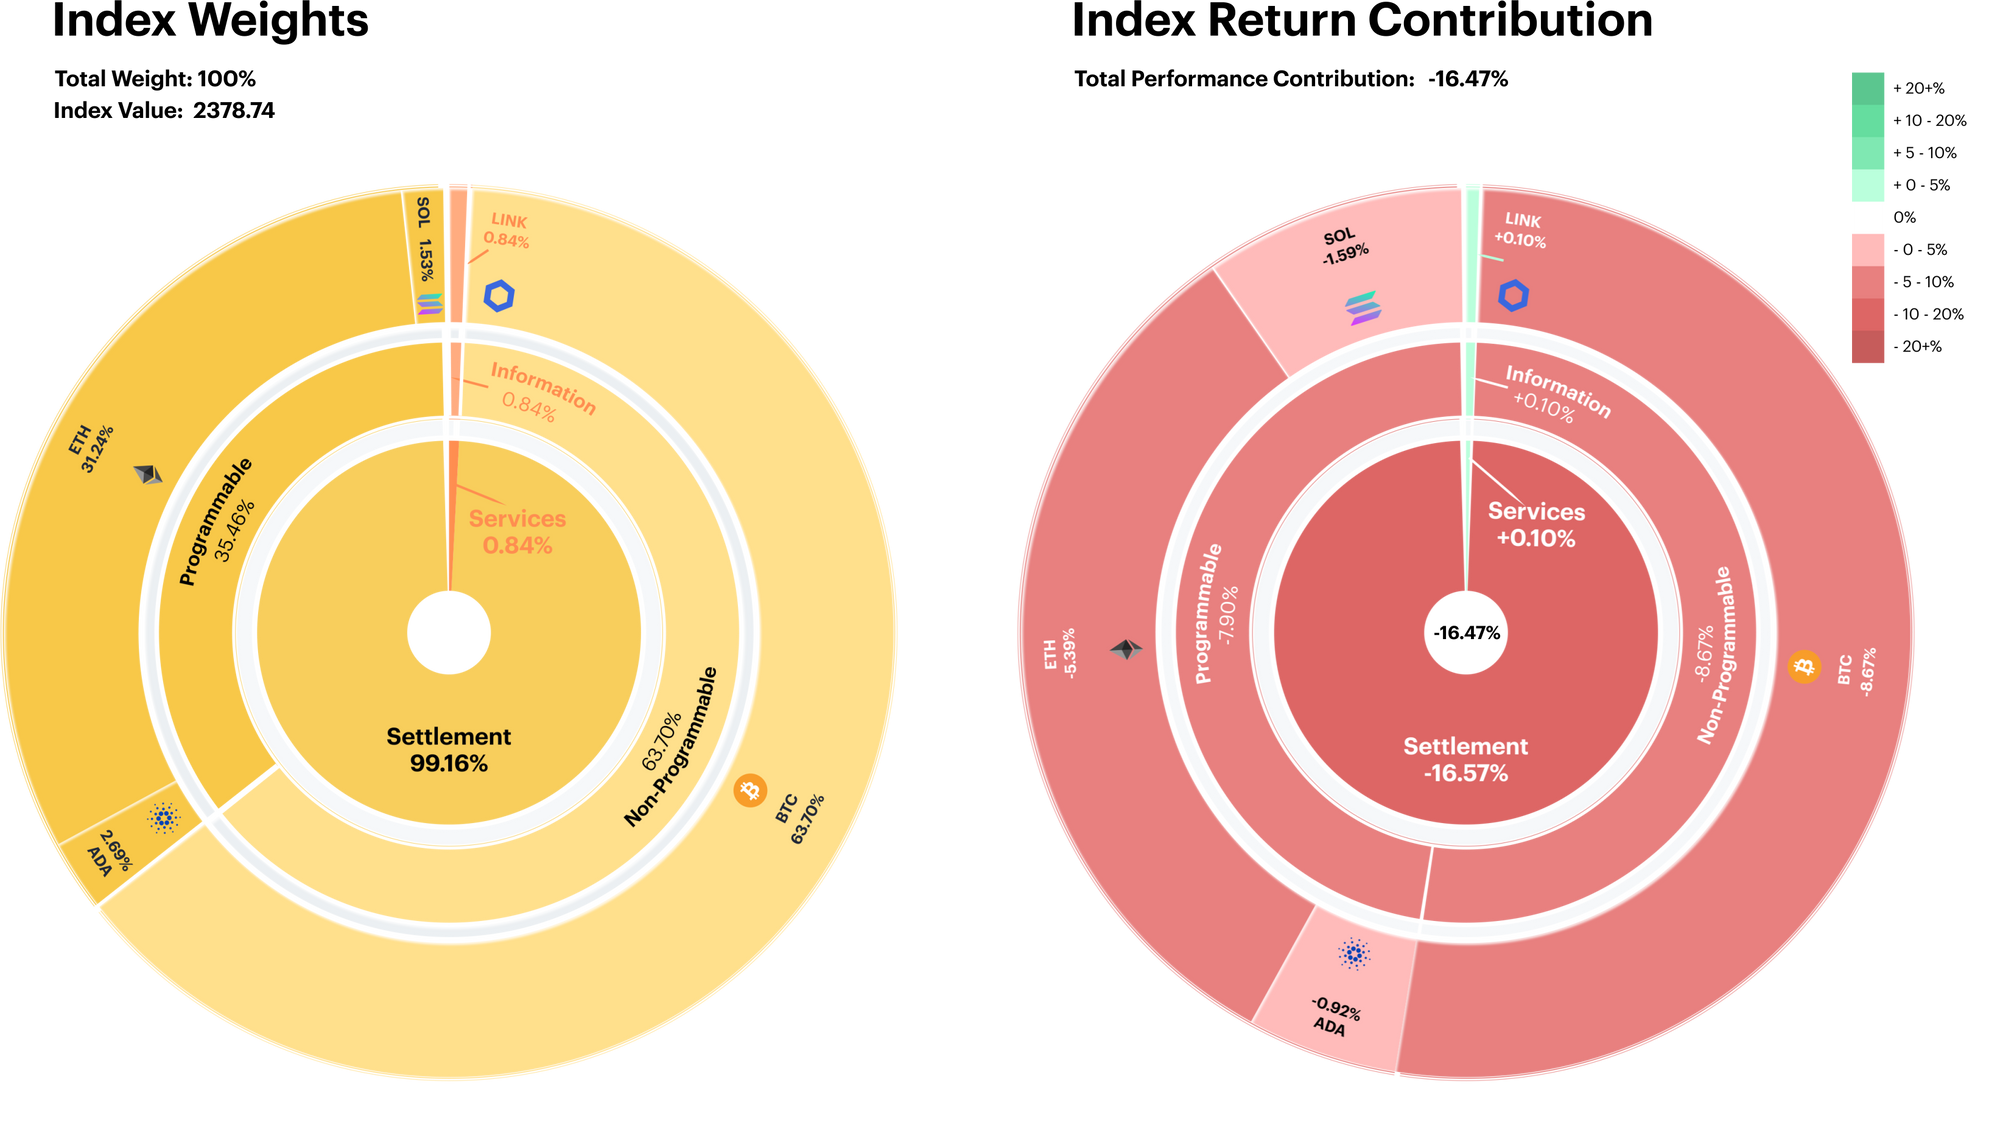
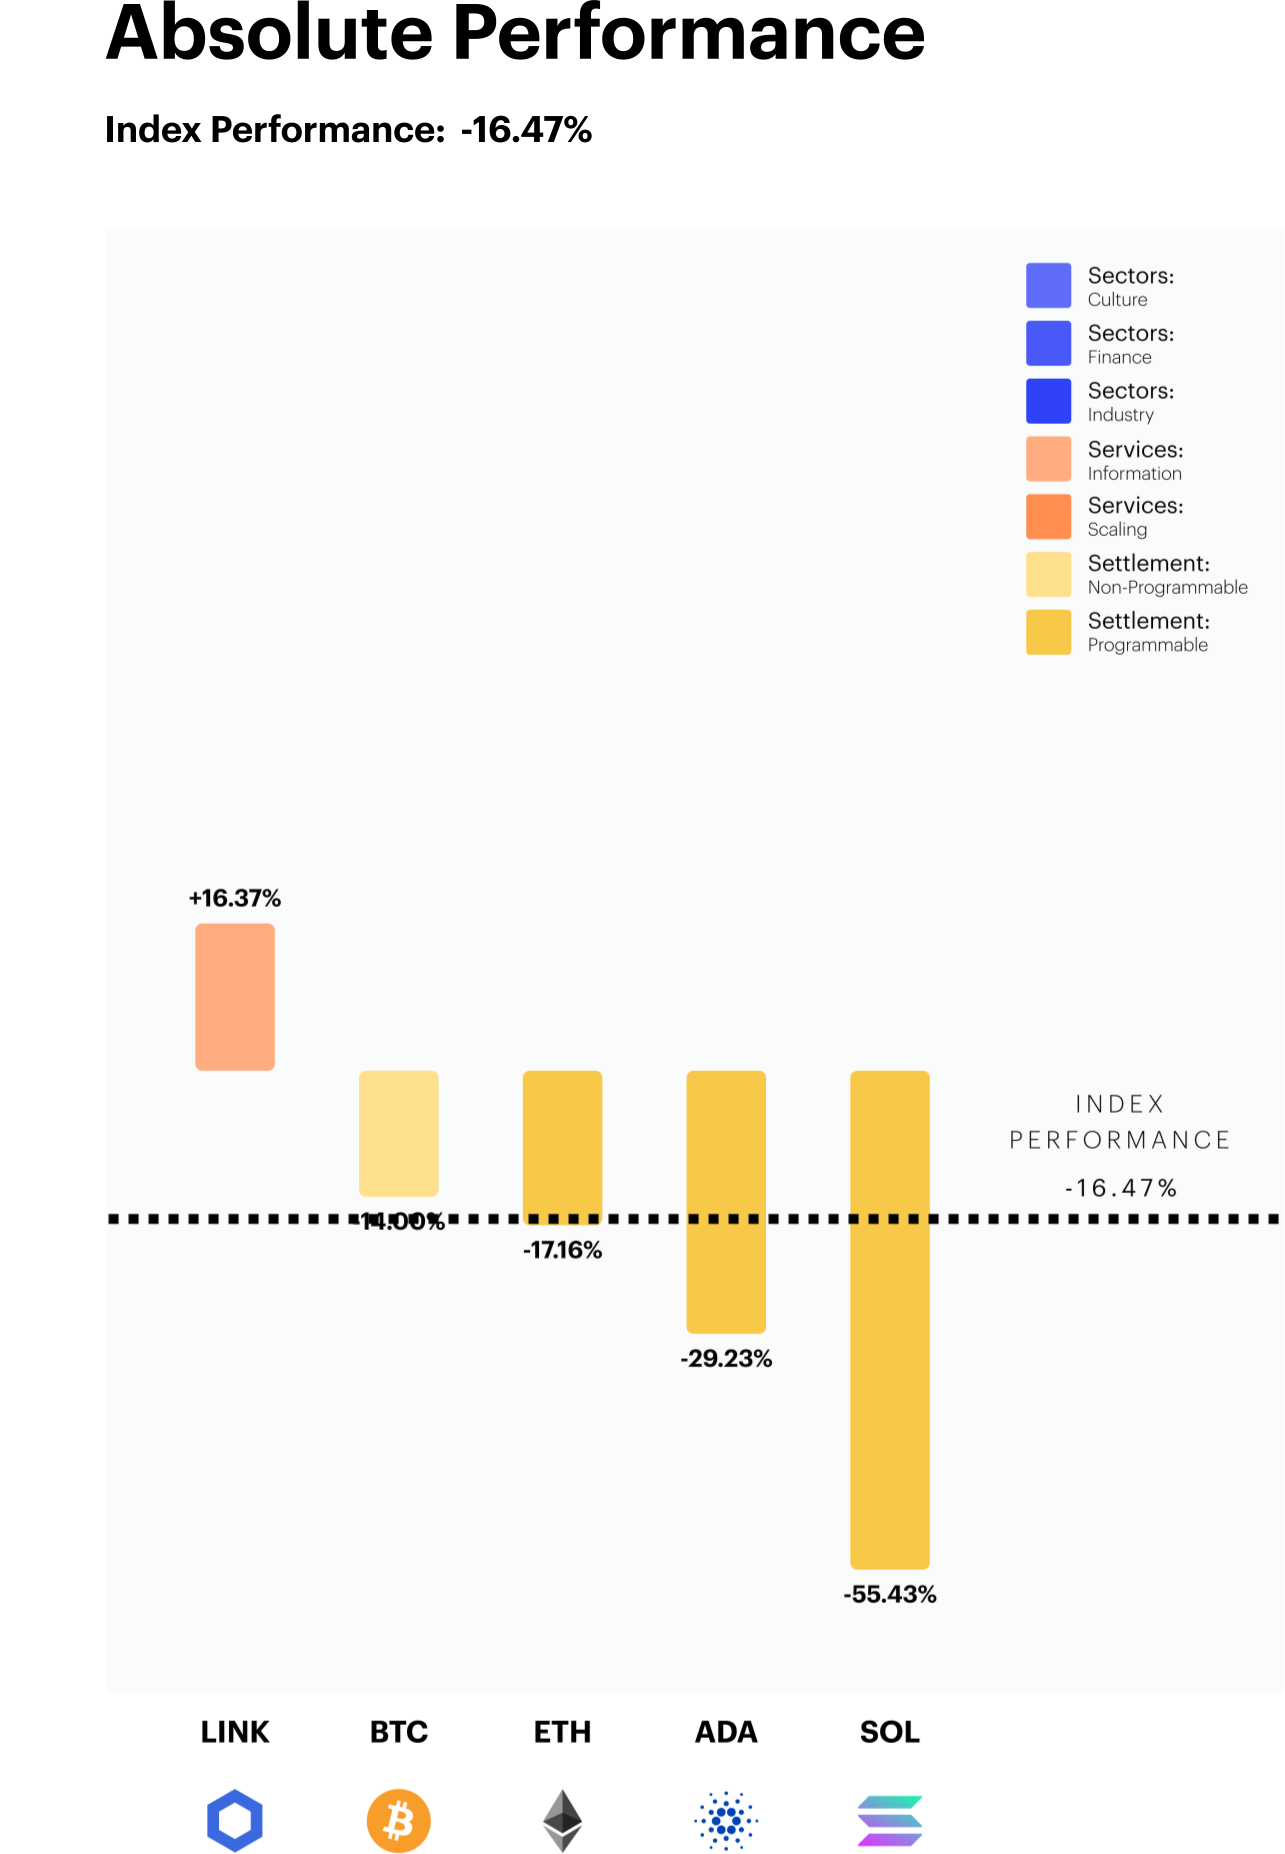
Our barometer for mega-cap tokens remained under pressure, falling approximately -16.5%. The index is heavily weighted towards the Settlement segment, which contributed over 100% of the negative performance during the last rebalancing period.
The Level 2 layer was heavily impacted by Solana’s (SOL) weak performance. The Ethereum competitor detracted almost 1.6% of performance despite its modest 2.8% initial weighting. Lastly, the Services segment ended in positive territory due to Chainlink’s (LINK) resilient quarter.
Planned staking launch boosts LINK
Chainlink (LINK) outperformed the mega-cap peer group by a significant margin, rising over 16% for the quarter. This marks the second straight quarterly-rebalance period that LINK has remained on top. Bullish price action began in late October after its developers announced plans to launch a novel staking program. This will eventually allow token holders to earn passive income on their holdings. Furthermore, staking activity should potentially provide steady burning of LINK tokens, adding a deflationary catalyst for its tokenomics.
Solana (SOL) saw its market cut in half over the last three months. The Ethereum competitor came under pressure the wake of FTX/Alameda fallout. The FTX empire was a major investor and supporter of Solana. FTX’s fatal liquidity crunch ultimately led to forced selling of SOL holdings, sending the token to levels last seen in March of 2021.
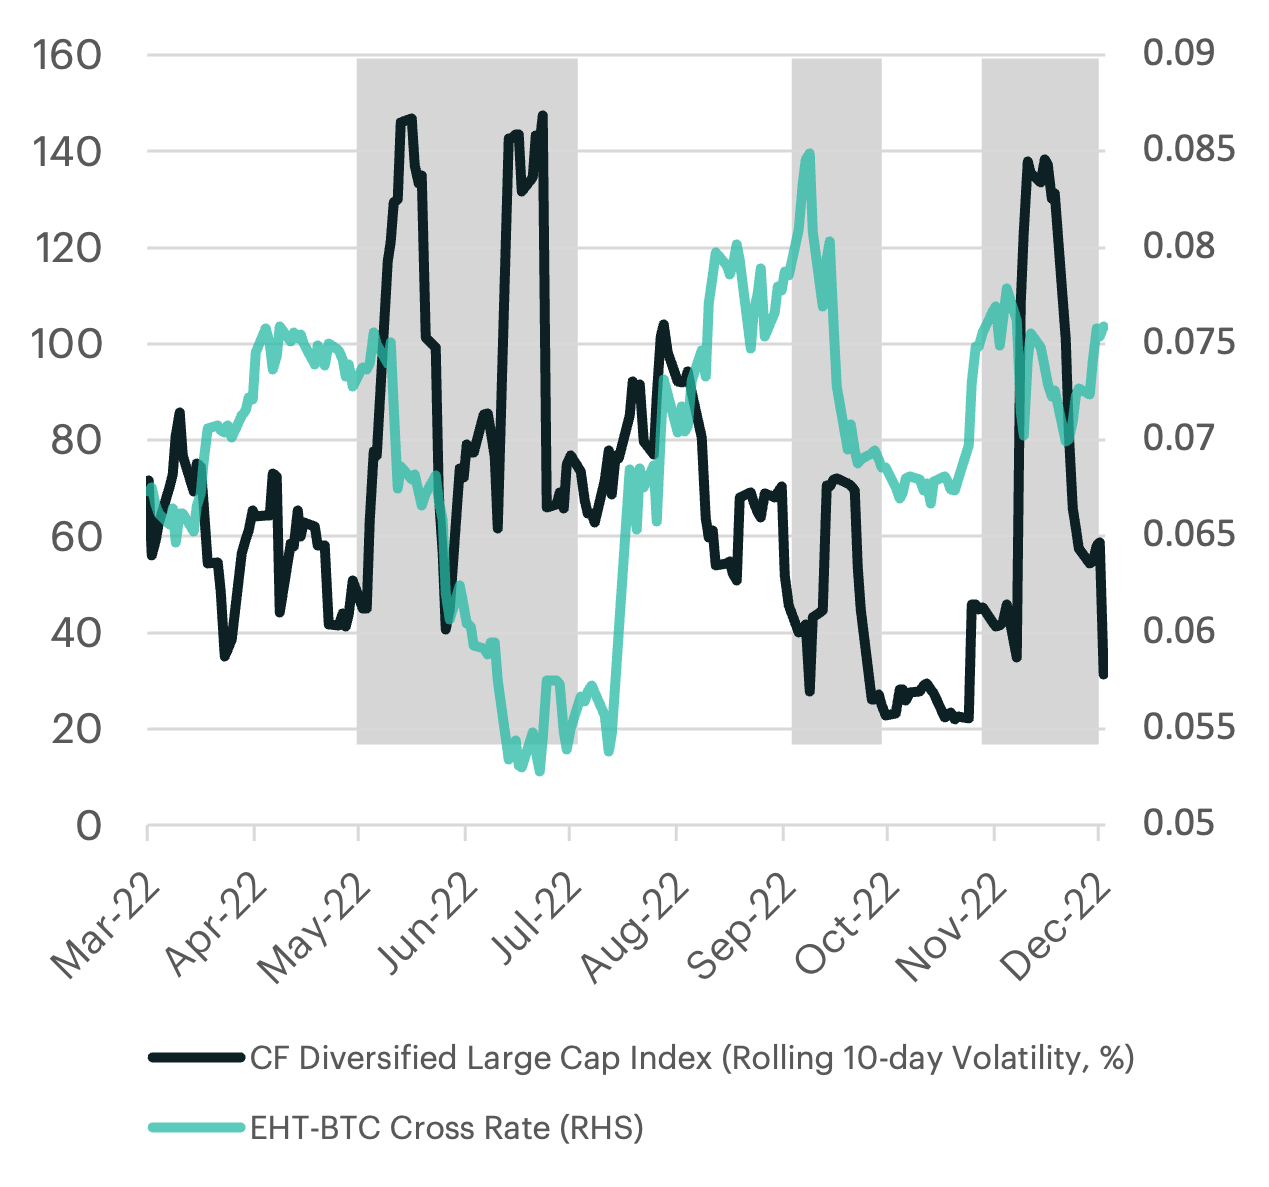
Market sentiment swings favours BTC over ETH
The CF Ultra-Cap index is intended to represent the mega-cap tokens in the crypto universe. Of which, a large portion is then allocated to the two largest: bitcoin (BTC) and ethereum (ETH). The relative pricing performance of the two crypto-behemoths are often cited as gauges for risk sentiment of the overall crypto market. An example of this would be when BTC outperforms ETH, which would indicate a more defensive sentiment in the marketplace (or vice versa).
For the first time since the April-June quarter, bitcoin has seen a relatively stronger performance when compared to its programmable peer. If we study the 10-day rolling volatility measure of a broader index, such as our Diversified Large Cap, we see that the recent volatility spikes in mid September and early November has had a diminishing impact on ETH’s relative performance. However, the quick collapse in volatility back to the sub-40% level is likely to remain supportive for ETH once again.
Appendix: constituent changes for current period
Appendix: Market Performance Overview
Appendix: CF Digital Asset Classification Structure
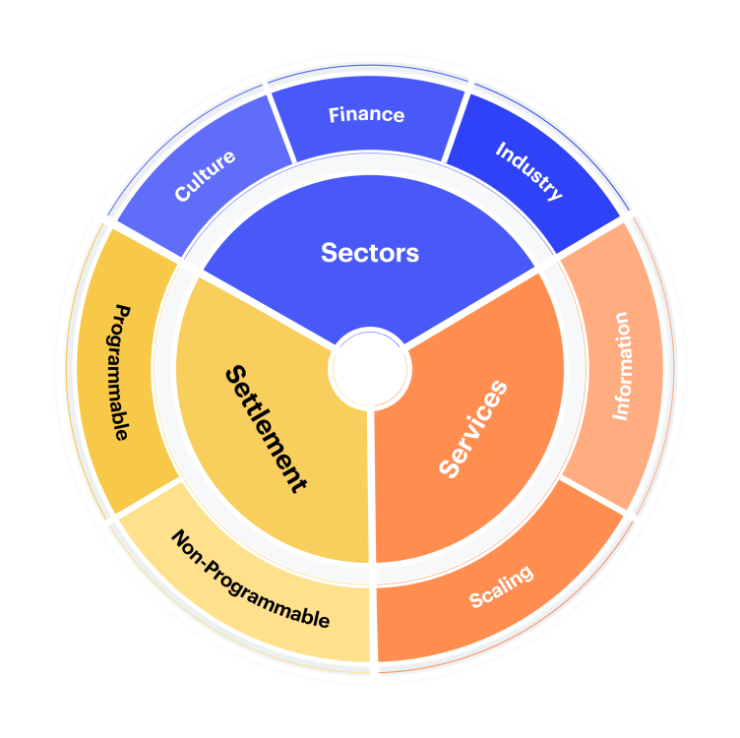
The CF Digital Asset Classification Structure (DACS) classifies coins and tokens based on the services that the associated software protocol delivers to end users, grouping assets by the role they play in delivering services to end users. The CF DACS powers CF Benchmarks' sector composite and category portfolio indices and allows users to perform attribution analysis to better understand the fundamental drivers of returns within their digital asset portfolios.
Additional Resources
For more information about our CF Benchmark indices and our methodologies, please visit the respective web links below:
- CF Diversified Large Cap Index
- CF DeFi Composite Index
- CF Web 3.0 Smart Contract Platforms Index
- CF Digital Culture Composite Index
- CF Blockchain Infrastructure Index
- CF Cryptocurrency Ultra Cap 5 Index
Contact Us
Have a question or would like to chat? If so, please drop us a line to:
The information contained within is for educational and informational purposes ONLY. It is not intended nor should it be considered an invitation or inducement to buy or sell any of the underlying instruments cited including but not limited to cryptoassets, financial instruments or any instruments that reference any index provided by CF Benchmarks Ltd. This communication is not intended to persuade or incite you to buy or sell security or securities noted within. Any commentary provided is the opinion of the author and should not be considered a personalised recommendation. Please contact your financial adviser or professional before making an investment decision.
Note: Some of the underlying instruments cited within this material may be restricted to certain customer categories in certain jurisdictions.
Changes to the Token Market Price Benchmarks Series - Market Prices – 21 July 2026
The Administrator has confirmed changes to the Token Market Price Family for the period 14 July 2026 to 21 July 2026.

CF Benchmarks
Softer CPI Reprices July Hike Risk & Lifts Digital Assets
Digital assets extended their recovery over the past week as cooler US inflation prints repriced Fed expectations; the bid was broad across the large cap indices, growth factor leadership returned, stablecoin funding repriced lower, and stress stayed isolated in names hit by token-specific news.
Mark Pilipczuk
Notice of the Demising of CF Dai-Dollar Settlement Price and Spot Rate
The Administrator announces that it will demise the CF Dai-Dollar Settlement Price (DAIUSD_RR) and CF Dai-Dollar Spot Rate (DAIUSD_RTI) which are members of the CF Digital Asset Index Family.
CF Benchmarks
By clicking Accept, you consent to CF Benchmarks's use of cookies.
Visit Cookie Settings to learn how CF Benchmarks uses cookies and to adjust your preferences.