
Apr 05, 2025
CF Benchmarks Newsletter Issue 79
- Bitcoin, crypto large caps show signs of resilience
- BlackRock plants Bitcoin flag in EU with IB1T
- Now learn Solana: Get our research team's SOL explainer
Liberated
Unfortunately, evidence of crypto’s near-term immunity to ‘Liberation Day’ is as apocryphal now as it appeared to be during the run-up, spanning several months. Within 12 hours of President Trump’s ostensibly final announcement, in a widely trailed speech delivered with characteristic dramatic flair, stocks, bonds, and other assets reacted in kind:
- S&P 500, already on course for its worst quarter for 3 years, baked that in with a second drop of around 5% on Friday, its biggest single-day drop since June 2020, and first ever consecutive sessions of falls above 1,500 a piece. The gauge is now in correction territory; more than 10% off its February top
- The U.S. fixed income benchmark also has flashed a signal move by way of immediate reaction: the 10-year Treasury yield edged below 4% on Thursday for the first time since November’s election, telegraphing concerns tariffs could trigger a demand shock that ultimately upends the economy. As Wall Street economists’ downgrades begin to filter in, it's clear those analysts are on the same page. They're generally forecasting resurgent core U.S. inflation, weakening GDP and rising unemployment into year-end
- Fed policy expectations are anchored on ‘no change’ at the central bank’s next meeting, ending May 7th, for now. Still, certainties among CME Group Fed Fund futures traders are clearly beginning to ebb. The probability of the Fed’s target rate being held at its current 425-450 bp, stood at 68.8% late Thursday, vs. an 89.4% probability a day earlier
- Bloomberg’s U.S. Spot Dollar Index, measuring the greenback against a basket of leading currencies posted its sharpest intraday decline since it’s 2005 inception on Thursday, off by 2.1% at one point and the most versus the euro in 10 years
Crypto extends fall
Digital assets duly accelerated the re-calibration of their own place in the risk spectrum after the actual tariff hammer fall; a process already underway during the months-long escalation of trade tensions, additionally fuelled by a recent spate of weaker-than-expected macroeconomic readings.
The most liquid institutional Bitcoin benchmark, CME CF Bitcoin Reference Rate (BRR) continues to grind lower. However, it printed a relatively contained -4.43% retreat in the first post Liberation Day session to stand at $81,866.15.
Large-cap gauges, like our regulated CF Cryptocurrency Ultra Cap 5 (CFUC5), the settlement price of which was down 4.98% at the 4 PM London Time cut on Thursday, implied a similar sentiment, by varying degrees, for other dominant tokens.
ETHUSD_RR lost 5.49%, XRPUSD_RR was down 6.20%, SOLUSD_RR tumbled 10.70%, and our Cardano benchmark, ADAUSD_RR dropped 9.25%.
Outflows slow
Inevitably this retrenchment is also showing up in ETF flows. U.S.-listed Bitcoin funds saw outflows totalling around $768m in March, according to crypto ETF data aggregator site SoSoValue. That extended the decline in spot BTC fund assets following a torrential $3.56bn of outflows in February, the worst month for deallocation since most spot BTC funds in the region launched in January 2024.
Still, as the CF Benchmarks research team, led by Head of Research Gabe Selby, CFA and Research Analyst Mark Pilipczuk noted in their recent Monthly Market Recap, out earlier in the week, signs of moderation – or at the very least, investor differentiation – may be beginning to appear.
(Click here to get the full report now, or read on for excerpts and select insights.)
Flight to Quality Helps Mega-Caps: Our CF Ultra Cap 5 Index led relative performance with a more modest decline of 3.02%, followed by the CF Free-Float Broad Cap Index at 3.88% and the CF Diversified Large Cap Index at 8.21%. In contrast, sector-specific indices posted steeper losses, with the CF DeFi Index down 17.22%, CF Digital Culture Index off 17.45%, and CF Blockchain Infrastructure Index trailing at 18.46%. Amid the uncertainty surrounding trade policy, investors clearly fled to the relative safety of larger-cap cryptocurrencies, abandoning riskier bets as macro concerns dominated overall market sentiment.
From Monthly Market Recap, March 2025
CME BTC pre-Tariff longs outpaced shorts
Another tentative read of sentiment, chiefly relating to institutional investors and major liquidity participants, may be evident in CME Bitcoin futures net positioning and open interest, as shown in the graphic below. It’s excerpted from the Monthly Market Recap and is based on transactions from April 2022 through March 31st, 2025. (CME Bitcoin futures settle to our BRR index).
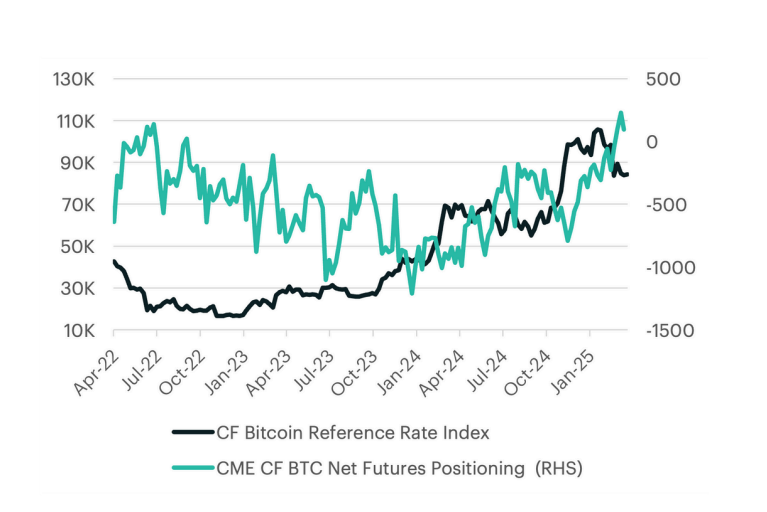
“Net sentiment positioning in Bitcoin improved in March, with long positions outpacing shorts”, note Selby and Pilipczuk. “As a result, net futures positioning on the CME rose to 94 contracts, up from -57.”
The proviso is of course that these data have been superseded post Liberation Day. Still, it’s notable net longs were increasing into the announcements, despite Bitcoin’s sustained price downtrend already being underway.
Bitcoin seeks stronger trend
Meanwhile, a simplified analysis of CME Bitcoin futures technical price characteristics, as shown in the continuation chart below (basically, these are daily prices of successive front-month contracts) offers a current perspective, and a very near-term horizon for Bitcoin, also tentative, through the lens of institutional sentiment.
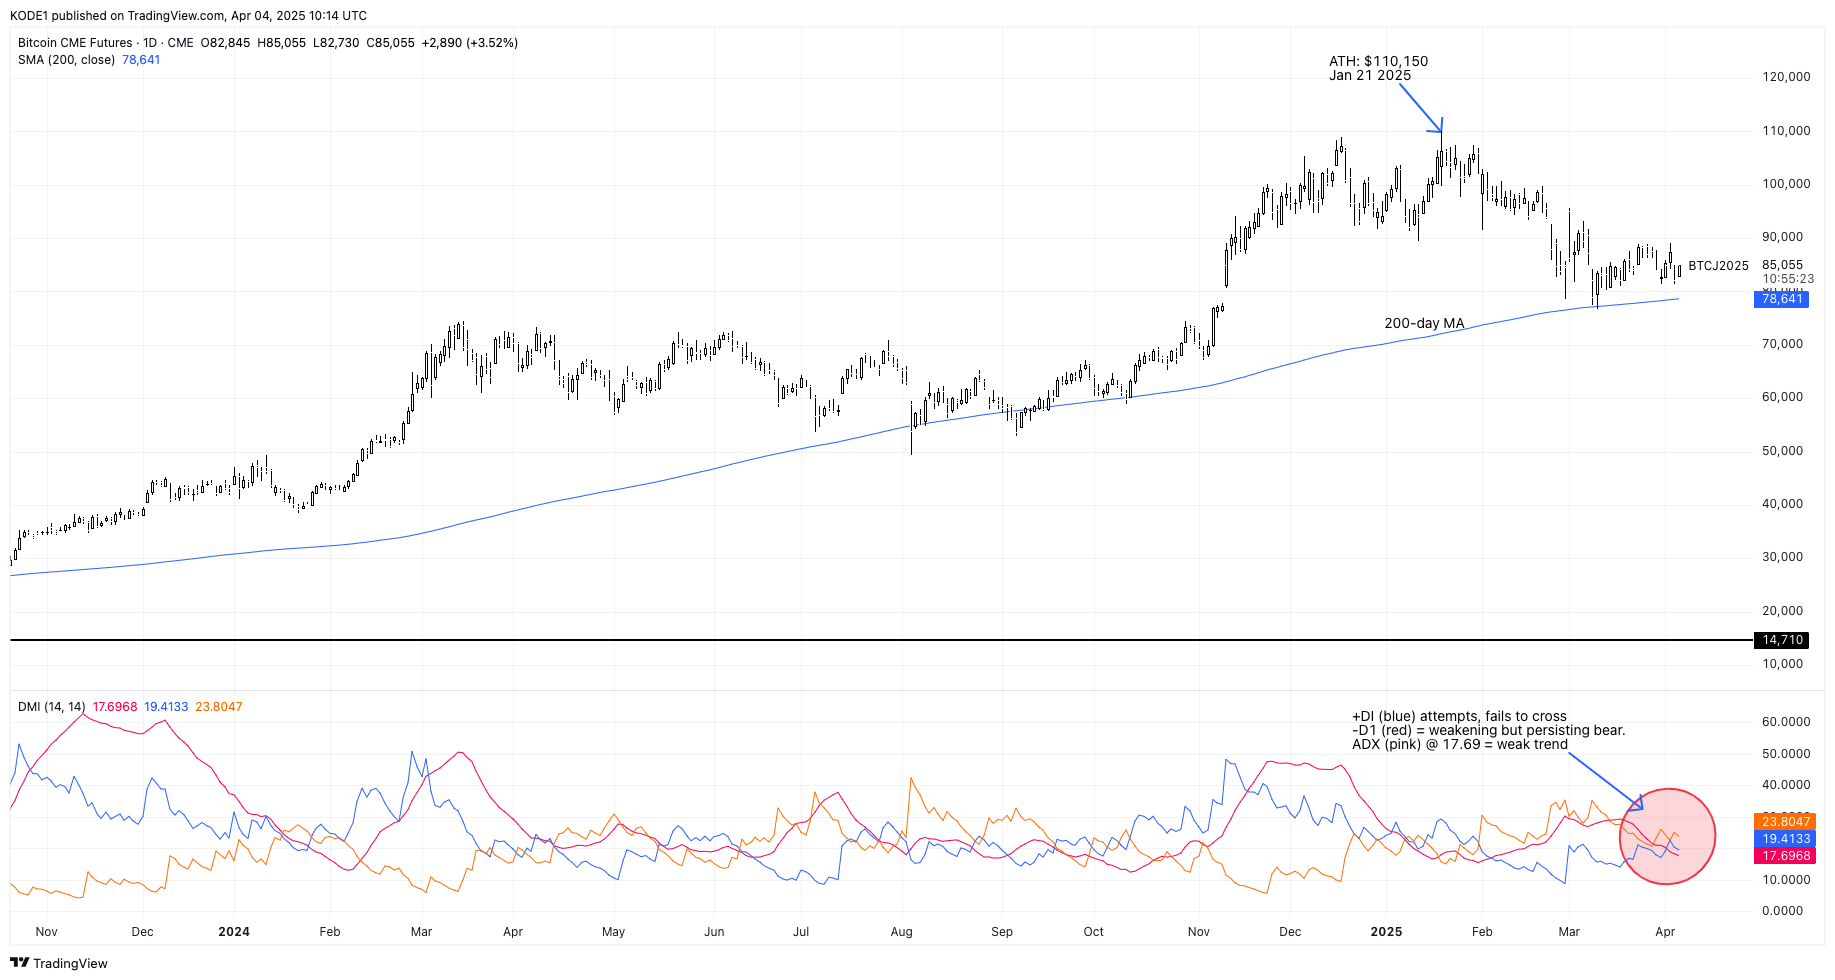
For now, the downturn is contained within the range from the last Bitcoin top in January (for futures, circa $110k) and the – still rising –200-day moving average (200-DMA), a widely monitored and systemically integrated trending indicator for any market asset. There’s also at least one clear instance in recent weeks of indicative price support at the 200-DMA.
Turning to the Directional Movement Index (DMI) sub-chart; based on J. Welles Wilder’s guidance for interpreting its components, no strong uptrend, nor downtrend would currently be indicated, as per the annotation.
For Bitcoin at least, for now, the key bias seems to be persistent uncertainty rather than deepening negative sentiment; albeit geopolitical developments could soon confirm a definitive worsening of the outlook. Particularly if rounds of tariff escalation begin to add further indeterminate variables. China retaliated on Friday April 4th with 34% tariffs on all US imports.
Market Outlook Q2 2025

The following section contains highlights from the Market Outlook Q2 2025 report produced by CF Benchmarks analysts Gabe Selby, CFA, and Research Analyst Mark Pilipczuk.
Navigating the Tariff Aftermath
Whilst the indeterminate variables we mentioned above pose significant challenges for forecasters, our research team, led by Gabe Selby, CFA and Research Analyst Mark Pilipczuk, continues to delineate the highest-probability scenarios and estimates based on several years of uniquely combined expertise as both traditional, and institutional digital asset practitioners.
They’re just-released Market Outlook – Q2 2025 is a case in point. As with all of the team’s research forecast publications, the report constructs a comprehensive narrative around an expected macro backdrop, secular themes and a specific asset class overview and forecasts. The current edition was completed after the White House’s ‘Liberation Day’ publication of trade tariffs, and therefore takes these and their likely impact into account.
Read the excerpted sections below, then click the button underneath to navigate to the full report.
Growth Outlook
A Slower Start to 2025 Amid Policy Uncertainty and Softening Demand
The U.S. economy enters the second quarter of 2025 under growing pressure from overlapping shocks. While early optimism followed the election and anticipated policy easing, that narrative has been overtaken by a sharp recalibration of macro expectations. With universal 10% tariffs now in effect-and reciprocal levies on 60 nations raising the average effective U.S. import tariff rate above 20%-a broad-based drag on consumption, investment, and trade is beginning to take hold. External risks, including China's prolonged property slowdown and inflation volatility in key emerging markets, compound the global risk backdrop.
Can the Economy Absorb the Tariff Shock?
Despite consensus expectations for 1.9% real GDP growth in 2025, the economy is already tracking a weaker path. High-frequency data show front-loaded import activity, eroding consumer momentum, and weather-affected services output. With the tariff regime now fully in effect, a Fed Model from 2018 suggests a potential GDP drag of 2.3% from a 16 percentage point increase in the effective tariff rate.
The inflationary channel is more nuanced: while retail pass-through has been limited to date, input cost pressures are rising, particularly in tariff-exposed sectors like autos, appliances, and pharmaceuticals. Firms may absorb some costs through margin compression, but downstream effects are likely to intensify as inventories unwind. The labor market is already softening, and the Fed's projections for the unemployment rate have been revised upward by year-end.
Fiscal austerity efforts under the Department of Government Efficiency (DOGE) may reinforce this demand shock, particularly through public sector layoffs. Although corporate tax relief and deregulation may offer a back-end tailwind, they are unlikely to fully offset the near-term drag. Confidence remains fragile-businesses are in a defensive posture, and capital formation remains subdued.
BlackRock enters Europe's Bitcoin ETP market with IB1T

The key exchange traded product news for this edition is BlackRock’s expansion of its dominant position in the U.S., overseas to Europe.
BlackRock's iShares Bitcoin Trust ETF (IBIT) is the fastest growing fund of its kind, and, with assets under management (AuM) currently totalling some $47.3bn as of April 3rd, the largest.
Now though, in a ‘cat-amongst-the-pigeons’ move, the number one BTC fund issuer has entered the smaller, though highly competitive, European crypto exchange traded product (ETP) market, where the first Bitcoin ETP was launched as far back as December 2019.
As Bloomberg notes, “While ETPs linked to cryptocurrencies have traded on European bourses for years, the market’s $13.6 billion size pales in comparison to that of the US.”
BlackRock's 1st EU BTC fund
The iShares Bitcoin ETP listed on Euronext Amsterdam (ticker: BTCN), Euronext Paris (IB1T), and Frankfurt-based Deutsche Boerse’s Xetra (IB1T) on March 25th.
IB1T marks BlackRock’s first Bitcoin product of any kind outside of North America. Just like IBIT, IB1T utilizes a regulated CF Benchmarks index for NAV calculation, in this case CME CF Bitcoin Reference Rate (BRR).
BRR is our first BTC price variant, and has been integrated into the settlement procedure for CME Group’s, Bitcoin futures and options – among the first ever regulated crypto products products – for almost a decade; making BRR truly the most utilized and liquid institutional Bitcoin price.
Meanwhile IBIT, listed on Nasdaq, tracks our CME CF Bitcoin Reference Rate - New York Variant (BRRNY).
A new iShares BTC ETP tracking BRRNY's European-hours variant, could enjoy market structural liquidity effects, ultimately benefitting investors and consumers.
Again, like IBIT, Coinbase’s custody services secures IB1T's physical Bitcoin holdings, while Bank of New York Mellon is fund Administrator.
iShares has a 10 basis point fee reduction in place till end-2025, on a Total Expense Ratio that was already among the lowest relative to European Bitcoin funds, at 0.25%.
Featured Benchmark: CME CF Solana-Dollar Reference Rate (SOLUSD_RR)
The following section contains highlights from the report "Solana: The High-Speed, Low-Cost Blockchain Rival" produced by CF Benchmarks analysts Gabe Selby, CFA, and Research Analyst Mark Pilipczuk.
Read the excerpt, then click the button underneath to navigate to the full report.
Solana: The High-Speed, Low-Cost Blockchain Rival
Solana is a high-speed, low-cost programmable settlement network blockchain designed to support smart contracts and decentralized applications (DApps)—similar to Ethereum, but with a strong focus on scalability, efficiency, and affordability.
A blockchain is a decentralized digital ledger that records transactions across a network of computers in a secure and transparent way. Unlike traditional systems controlled by banks or companies, blockchains are trustless, tamper-proof, and operate without a central authority. Unlike older blockchains that struggle with slow speeds and high fees, Solana can handle thousands of transactions per second while keeping costs extremely low. This makes it an ideal platform for building financial services, games, social networks, and more in a decentralized and censorship-resistant way. Solana uses a combination of innovative technologies to process transactions faster and cheaper than most blockchains.
Validators Keep the Network Secure: A global network of computers (validators) work together to verify transactions and maintain the blockchain, ensuring security, transparency, and decentralization.
Smart Contracts Automate Processes: Solana supports self-executing contracts (smart contracts), which automate agreements without middlemen—powering everything from decentralized finance (DeFi) applications to NFT marketplaces and games.
SOL Token Powers the Ecosystem: SOL is the native cryptocurrency of Solana, used to: Pay for transaction fees (which are much lower than Ethereum’s). Stake and
participate in the blockchain’s security while earning rewards. Serve as a digital currency for payments and decentralized applications.
What Makes Solana Different?
Unmatched Speed: Solana uses a groundbreaking system called Proof of History (PoH) combined with Proof of Stake (PoS) to process thousands of transactions per second (TPS)—compared to Ethereum’s 13 TPS.
Ultra-Low Fees: On Solana, transactions cost fractions of a cent (~$0.01), while Ethereum transactions can cost $5 or more.
Scalability Without Sacrificing Decentralization: Solana’s technology allows it to scale while remaining secure and decentralized, making it ideal for large-scale applications.
Ideal for Developers and Businesses: From finance and gaming to real estate and social media, Solana’s infrastructure empowers developers to create applications that are fast, affordable, and resistant to censorship.
The information contained within is for educational and informational purposes ONLY. It is not intended nor should it be considered an invitation or inducement to buy or sell any of the underlying instruments cited including but not limited to cryptoassets, financial instruments or any instruments that reference any index provided by CF Benchmarks Ltd. This communication is not intended to persuade or incite you to buy or sell security or securities noted within. Any commentary provided is the opinion of the author and should not be considered a personalised recommendation. Please contact your financial adviser or professional before making an investment decision.
Note: Some of the underlying instruments cited within this material may be restricted to certain customer categories in certain jurisdictions.
Changes to the Token Market Price Benchmarks Series - Market Prices – 21 July 2026
The Administrator has confirmed changes to the Token Market Price Family for the period 14 July 2026 to 21 July 2026.

CF Benchmarks
Softer CPI Reprices July Hike Risk & Lifts Digital Assets
Digital assets extended their recovery over the past week as cooler US inflation prints repriced Fed expectations; the bid was broad across the large cap indices, growth factor leadership returned, stablecoin funding repriced lower, and stress stayed isolated in names hit by token-specific news.
Mark Pilipczuk
Notice of the Demising of CF Dai-Dollar Settlement Price and Spot Rate
The Administrator announces that it will demise the CF Dai-Dollar Settlement Price (DAIUSD_RR) and CF Dai-Dollar Spot Rate (DAIUSD_RTI) which are members of the CF Digital Asset Index Family.
CF Benchmarks
By clicking Accept, you consent to CF Benchmarks's use of cookies.
Visit Cookie Settings to learn how CF Benchmarks uses cookies and to adjust your preferences.