
Jun 10, 2026
Pricing the Perp DEX Leader: A Valuation Framework for Hyperliquid
A fully diluted valuation, a market-share earnings model, and a probability-weighted price target
Executive summary
Hyperliquid is a Layer 1 blockchain whose flagship product is an on-chain perpetual futures exchange; it now also runs spot markets, builder-deployed markets in equities, commodities and FX, and earns yield on the stablecoin collateral traders post against open positions, with nearly all net protocol fees and most of that collateral yield used to buy HYPE in the open market so that earnings reach holders directly through repurchases. We value HYPE on fully diluted supply, about $53.7bn, because team and contributor tokens are still vesting and the buyback has to compete with that supply as it enters float, which makes FDV the right denominator for an institutional underwrite; the circulating view is far cheaper and we treat it as the optimistic bound in the appendix. Annualized fees are about $1.06bn and earnings about $0.88bn, putting HYPE near 61x earnings on FDV and a 1.6% earnings yield, with earnings having peaked in Q3 2025 and fallen for three straight quarters as perpetual-DEX volume cooled and incentive-driven rivals took share. At 61x against a mature-venue multiple near 25x, the price assumes earnings more than doubling over the next few years, on the order of a mid-30s percent annual growth rate held for three years; the base case clears that bar in the first year, and the open question is durability. Our forward framework grows the comparable revenue pool one year at Bloomberg consensus, to about $37.6bn, assumes HYPE captures 3%, 5% or 7% of it, converts to earnings at the historical buyback margin and applies target multiples of 40x, 65x and 75x, which weighted 20/60/20 gives fair value of about $101bn FDV, roughly $106 per token. Supply is the swing factor: contributor tokens unlock at roughly 9.9m HYPE a month through 2027, and at current fees and price the buyback retires only about a sixth of that, so float keeps expanding until the vesting schedule runs off, which is why we underwrite on FDV and would size any position to the unlock calendar.
How Hyperliquid makes money
Hyperliquid runs a high-performance order-book exchange on its own Layer 1. The original product is perpetual futures; it has since added spot trading, an EVM execution layer, and builder-deployed markets that reach into equities, commodities, FX and prediction markets. Following the latest product launches, revenue now comes from four places: perpetual futures fees, still the core and the arena where competition is fiercest; spot fees, which share a volume tier with perps; builder-deployed markets, where outside teams stake HYPE to launch their own markets and the protocol takes a cut; and yield on collateral. That last line is easy to miss. Traders post stablecoins as margin, and with several billion dollars of USDC on the platform, the interest earned on those reserves is a real revenue stream, most of which is routed into the buyback. It rises and falls with interest rates.
The distribution mechanic is what makes HYPE unusual. Between 97% and 99% of net protocol fees flow to the Assistance Fund, which continuously buys HYPE on the open market and holds it off circulation.1 The buyback works like a near-total earnings payout returned through repurchases rather than dividends. By May 2026 the fund had deployed over $1.3bn and held about 28.5m HYPE, and its annual buyback runs near 7% of market capitalization, several times the intensity of Ethereum’s or BNB’s.2 We treat protocol earnings and holder returns as the same number, with one caveat: the buyback is a protocol policy, not a contractual dividend, and could in principle be changed by governance.
Trailing earnings, and why they have slipped
Hyperliquid scaled from almost nothing in late 2024 to a peak quarterly run-rate in Q3 2025. Both gross revenue and earnings crested that quarter and have stepped down since.
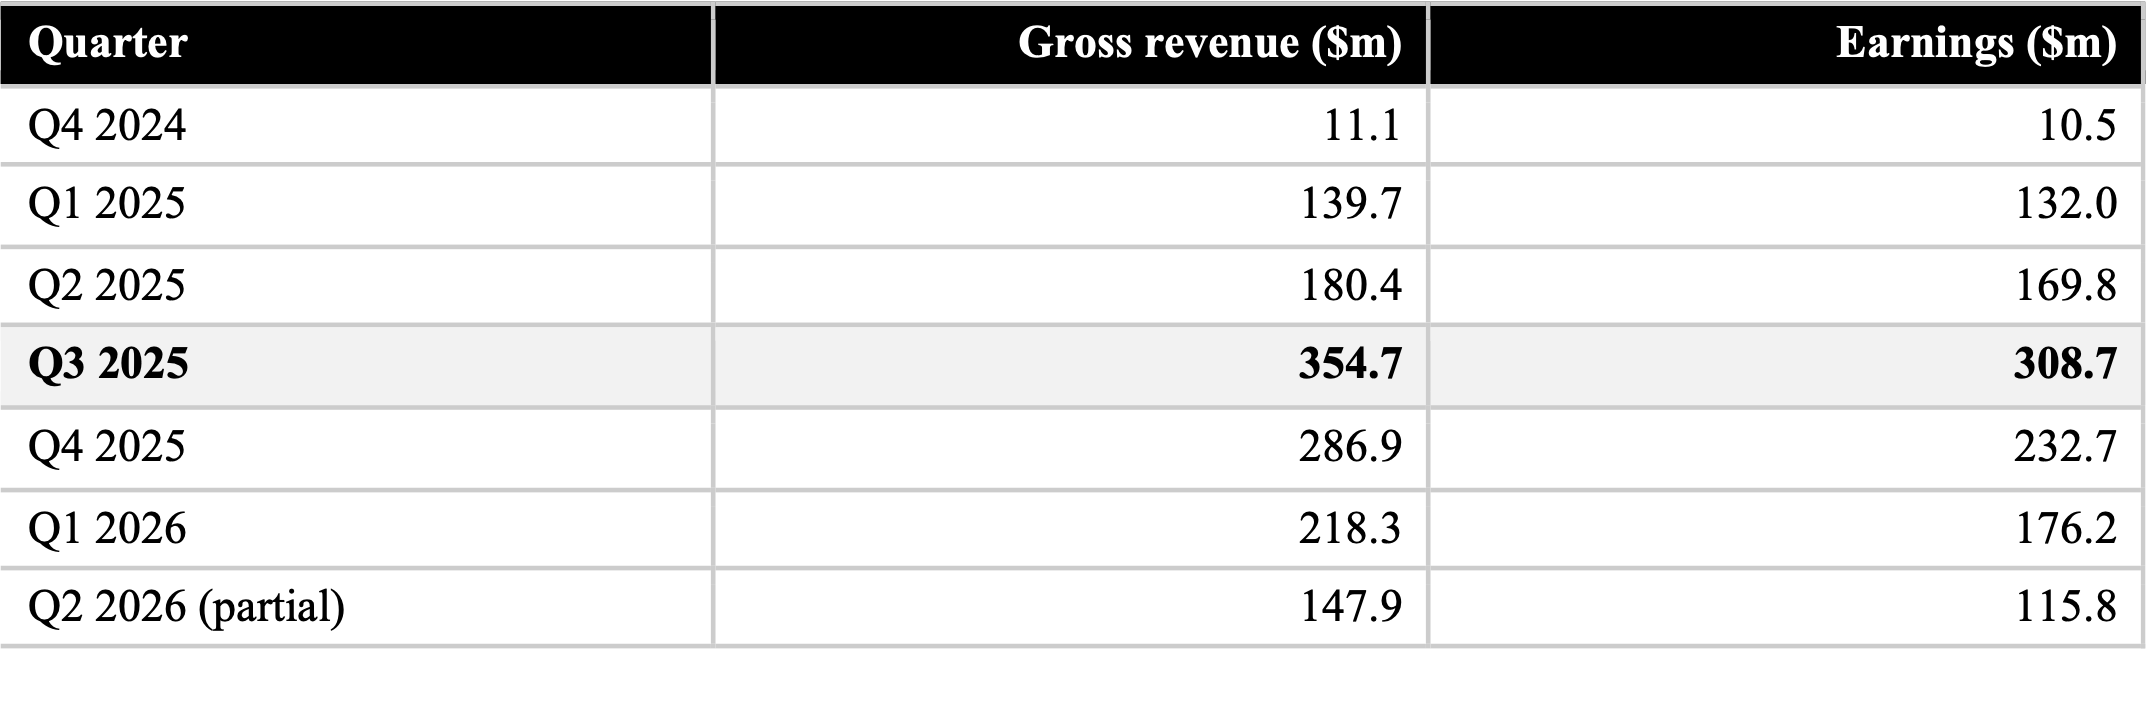
Q1 2026 earnings of $176m were still up about 34% year on year but down roughly 43% from the Q3 2025 peak. Trailing twelve-month earnings are about $887m, close to the $881m annualized figure. The trend, not only the level, is what a forward multiple has to price. The decline has two distinct causes, and separating them changes how the forward case reads.
The sector cooled: On-chain perpetual-DEX volume peaked in October 2025 above $1.2tn for the month, then fell for five straight months. By early April 2026 thirty-day volume was about $629bn and daily volume near $8.4bn, the lowest since the previous summer.3 A large part of the earnings decline is simply Hyperliquid’s exposure to a quieter market.
Competition fragmented volume: Hyperliquid held about 71% of on-chain perpetual volume in May 2025. When Aster, a Binance-linked venue, launched its token in September with aggressive rewards, its reported volume briefly eclipsed Hyperliquid’s, and Lighter, built by former Citadel engineers on a zero-fee model, took another slice. By April 2026 Hyperliquid was running roughly a third of on-chain perpetual volume.
What keeps this from being a story of structural decline is the quality of the volume that moved. Much of the rivals’ activity is reward-farming rather than real trading: Aster’s volume ran at roughly eight times its open interest, a ratio well above anything seen in a genuine market. On open interest and on profitable market-making, both far harder to manufacture, Hyperliquid held up better than its headline share suggests, and the live question is what the challengers keep once their token incentives lapse. Our read is that the deceleration is mostly a cooler market plus a temporary incentive war, not erosion of the franchise. That is the premise behind the share-recovery assumption in the forward model, and we flag it as a premise to monitor rather than a certainty.
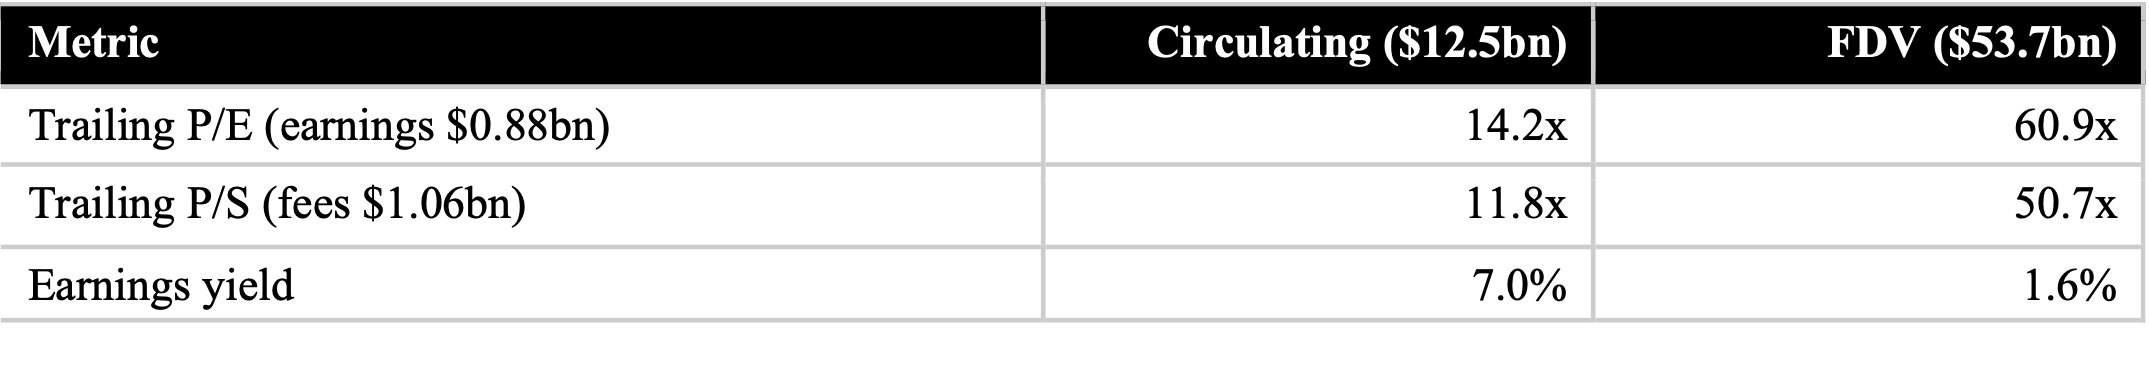
Valuation today, on a fully diluted basis
On fully diluted supply, Hyperliquid is one of the most expensive trading venues in the market. The multiples below use annualized earnings of $0.88bn and fees of $1.06bn against an FDV of about $53.7bn.
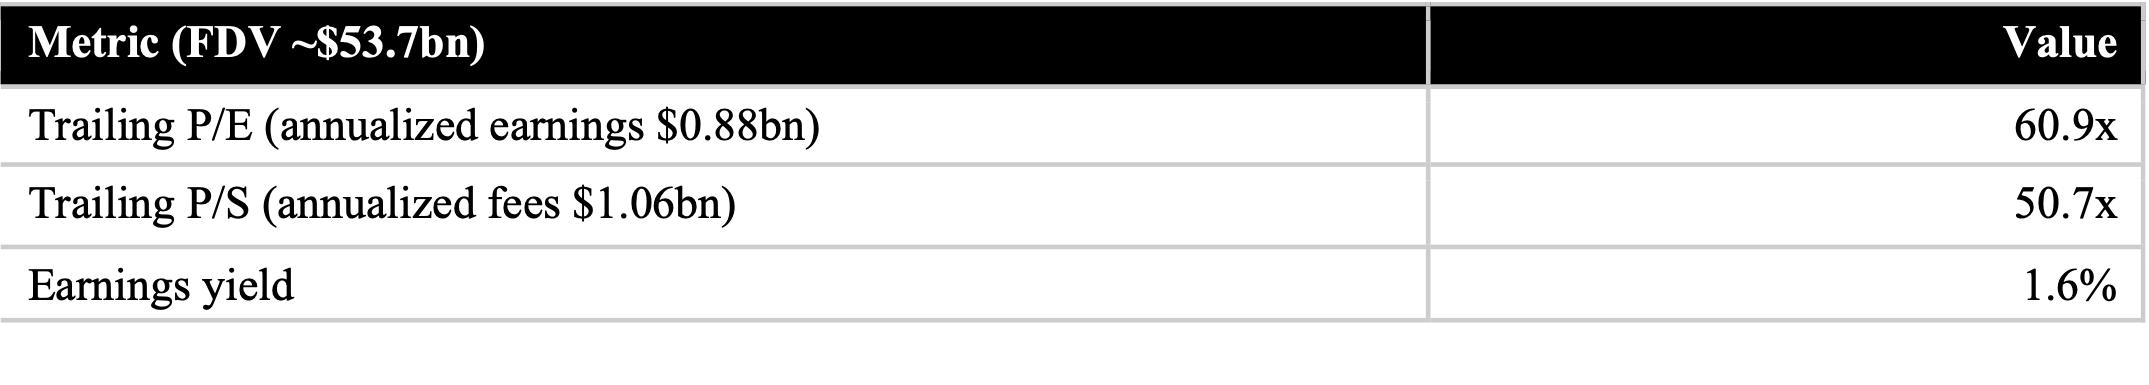
Why we use FDV: Circulating supply is about 222m tokens against a maximum near 1bn, so the circulating market cap of roughly $12.5bn implies far gentler multiples, about 14x trailing earnings and a 7.0% yield. We do not anchor there. Team and contributor allocations enter float on a known schedule over the next two years, and an honest valuation has to assume the buyback competes with that supply rather than ignore it. Section 5 sets out the supply arithmetic; the appendix keeps the full circulating-versus-FDV comparison and treats the circulating multiple as the optimistic bound.
What today’s multiple is paying for
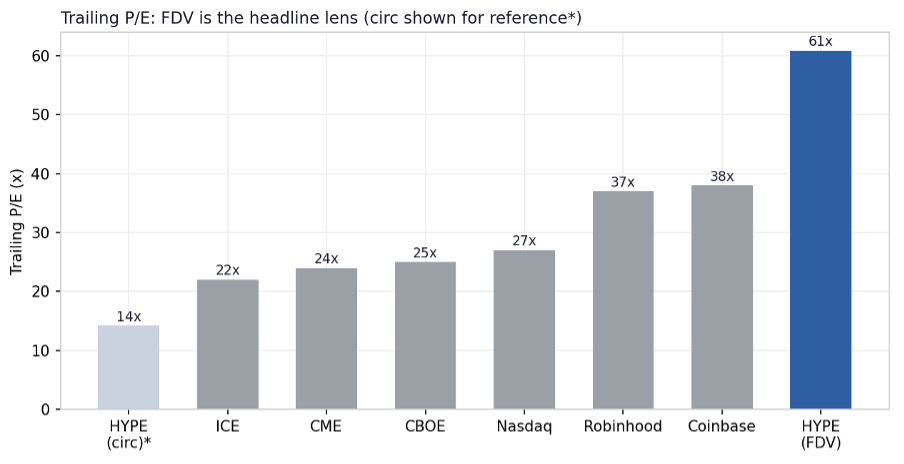
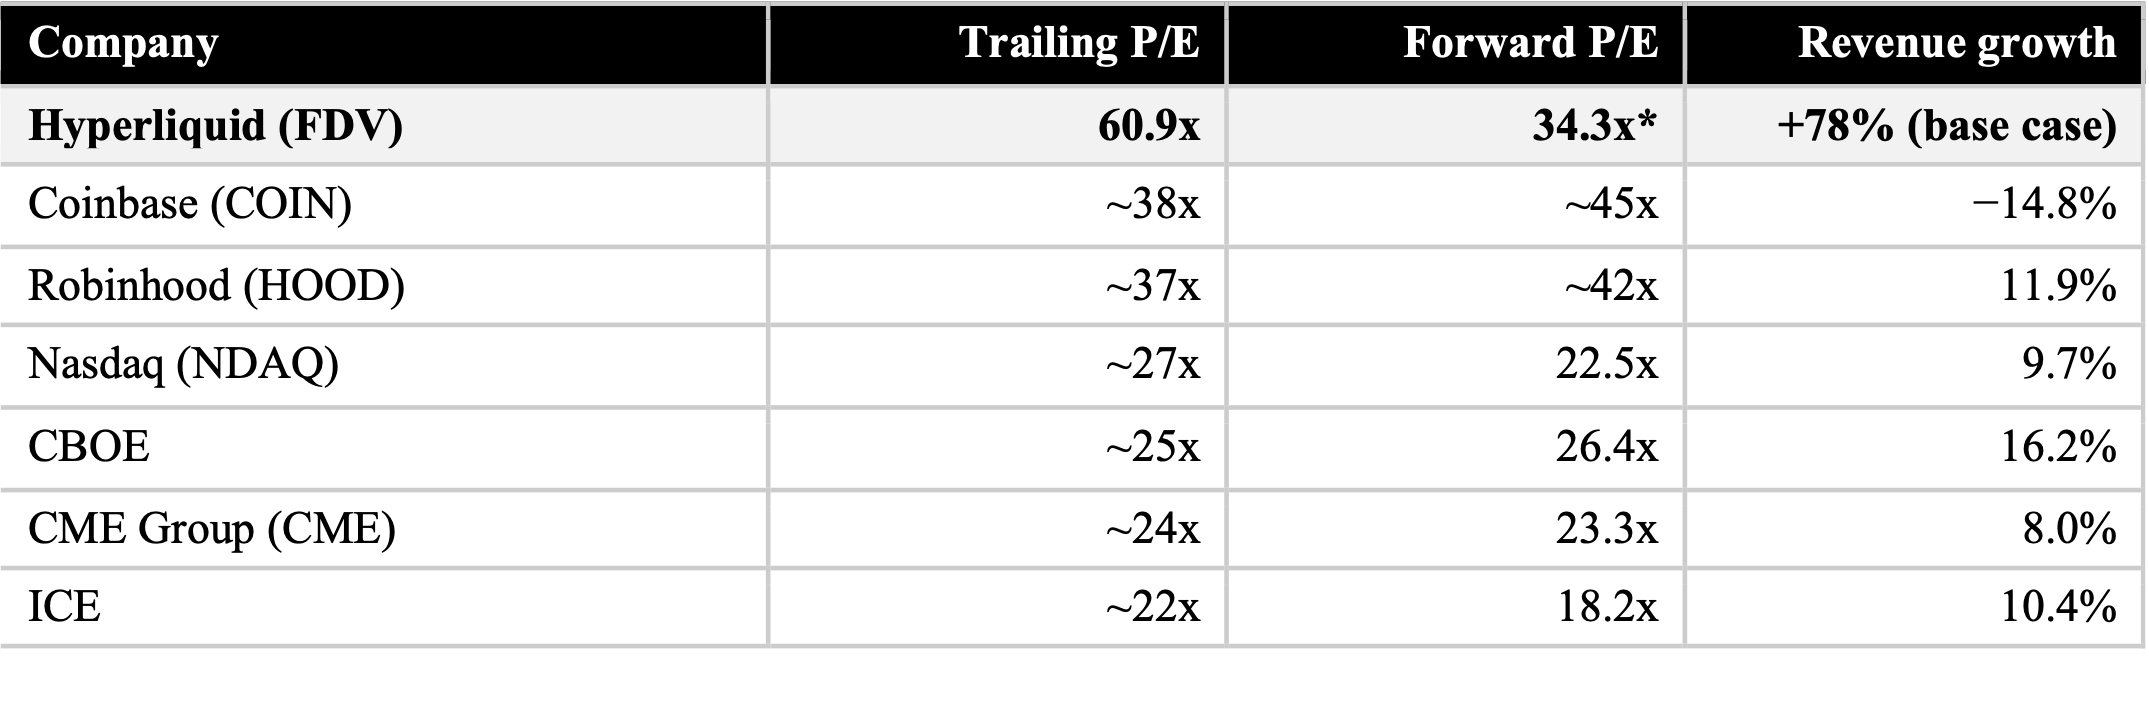
A 61x earnings multiple is only defensible if earnings grow into it. The cleaner question is what growth the current price already assumes. Set a normalized exit multiple for a high-quality but maturing venue at around 25x, between today’s Coinbase near 38x and ICE near 22x. To hold the current $53.7bn valuation at that multiple, earnings have to reach about $2.15bn, roughly 2.4x the current $0.88bn. The implied growth rate depends on the horizon.
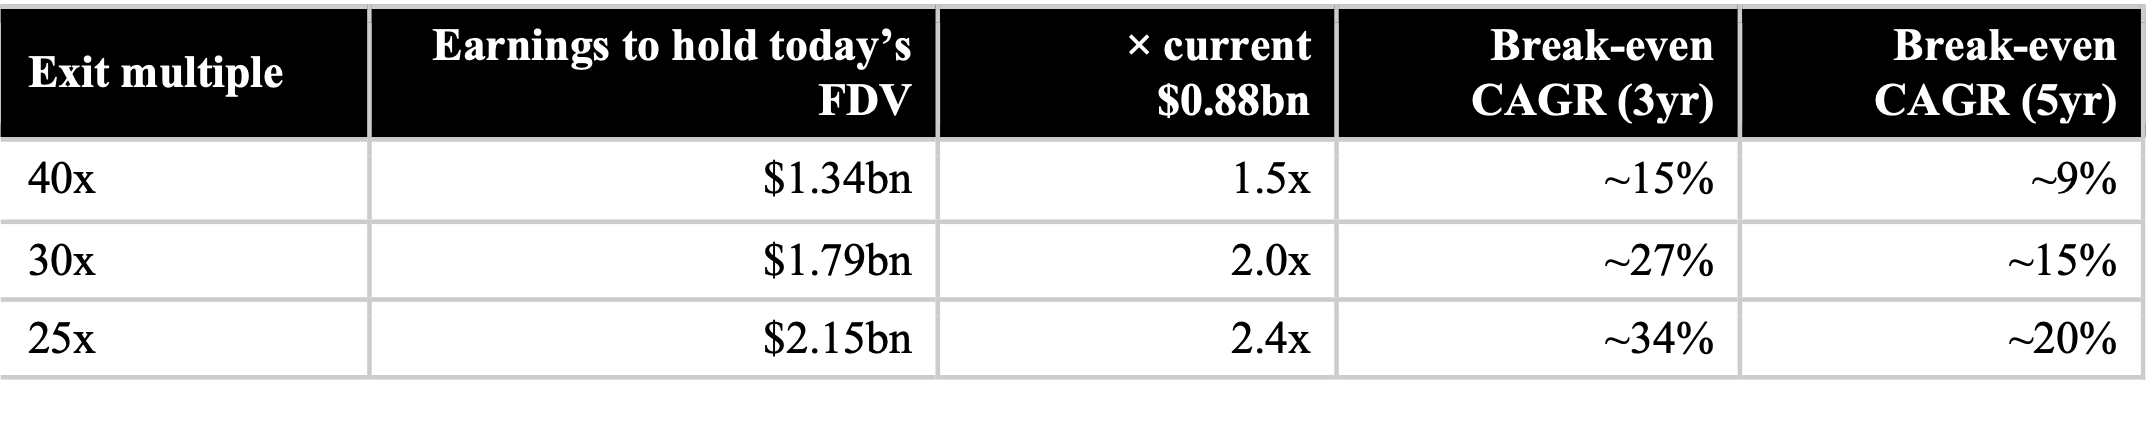
So the price embeds something like a mid-30s percent annual earnings growth rate sustained for three years just to break even at a normalized multiple, and closer to 45 to 50% for an attractive return. The base case’s implied 78% jump in fees clears that hurdle in the first year, and in its last genuine growth phase the protocol did far more than this: quarterly earnings rose from about $10m in Q4 2024 to $309m in Q3 2025, and year-on-year fee growth was still about 56% as recently as Q1 2026, so the mid-30s multi-year rate the price requires sits well inside what the franchise has delivered when volumes expand. The difficulty is that a multiple prices several years, and the most recent trend points the other way: trailing earnings are down 43% from the peak and still decelerating. The forward case is therefore a bet on reacceleration, and Section 2 is where that bet is argued. The gap between recent deceleration and assumed reacceleration is the central tension in the valuation, and a reader should treat it as such.
Supply, unlocks, and whether the buyback can keep up
The thesis rests on a supply claim, so it is better shown than asserted. The buyback is real and large. It is funded by trading fees, not by token issuance, and over the trailing twelve months it ran near $74m a month, about $0.9bn in total, repurchasing on the order of 20m HYPE; through calendar 2025 it averaged about $65m a month, repurchasing some 21m HYPE at an average near $30.4 Against most tokens that is an unusually strong cash-return mechanic. The unlock is larger. Hyperliquid took no outside venture funding, so there is no early-investor cliff; the scheduled supply is the team and contributor allocation, roughly 238m tokens, vesting on a straight line over 24 months from early 2026. That is close to 9.9m HYPE a month entering float through 2027. The right way to compare the two is in token terms, because the buyback spends a fixed dollar amount while the unlock releases a fixed token amount.
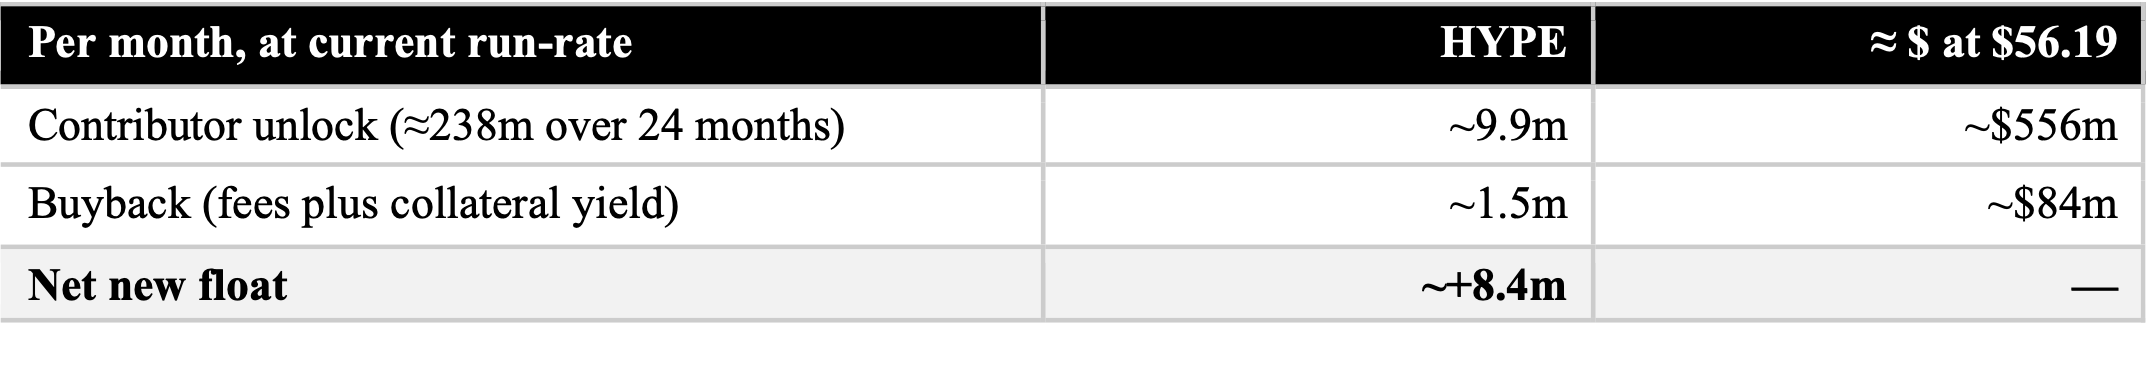
At the current price the buyback absorbs about a sixth of each month’s unlock. Net float still expands by roughly 8m HYPE a month, on the order of 100m a year, which is close to half of today’s circulating supply. For the buyback to fully offset the unlock at $56, fees would have to run several times higher, on the order of $7bn a year against about $1bn today. This is the concrete reason circulating-supply multiples are the optimistic bound and FDV is the honest denominator.
Two features sharpen the picture. First, the buyback’s effect on supply is counter-cyclical in token terms: because it spends a fixed dollar amount, it retires more tokens when the price is low and fewer when the price is high, so its support is weakest in a rally and strongest in a drawdown, the reverse of the intuition. Since fees also fall when volume falls, the harder scenario is low volume without a low price. Second, the math turns net-deflationary only once contributor vesting runs off around late 2027; after that the same buyback shrinks a roughly fixed float.
One mitigant is worth taking note of, because it materially softens the overhang. An unlock is eligibility to sell, not selling, and the distinction matters more here than for most tokens. Hyperliquid took no venture money, so the supply entering float belongs to the team and contributors who are long the franchise rather than to funds with a mandate to exit; they can stake their tokens for yield or simply hold, and across comparable unlocks only a fraction has historically reached the market. Three forces blunt the overhang further: staking locks tokens away, the buyback is a standing bid that absorbs part of any selling, and contributors share the protocol’s own reflexive interest in not pressuring the price. The net-float figures above are therefore a ceiling on supply, not a forecast of realized selling, which is plausibly well below them. The direction of pressure is not in doubt, which is why we still underwrite on FDV and size to the vesting calendar, but the honest reading treats the unlock as a manageable headwind rather than a wall of guaranteed selling.
Sizing the market and Hyperliquid’s place in it
The six listed venues we use as comparables generated about $35.7bn of net revenue in FY2025. Hyperliquid’s annualized fees of roughly $1.06bn equal about 3% of that pool. These venues are not identical to Hyperliquid, but they bound the revenue opportunity in regulated and crypto-adjacent trading and give a base from which to project.5
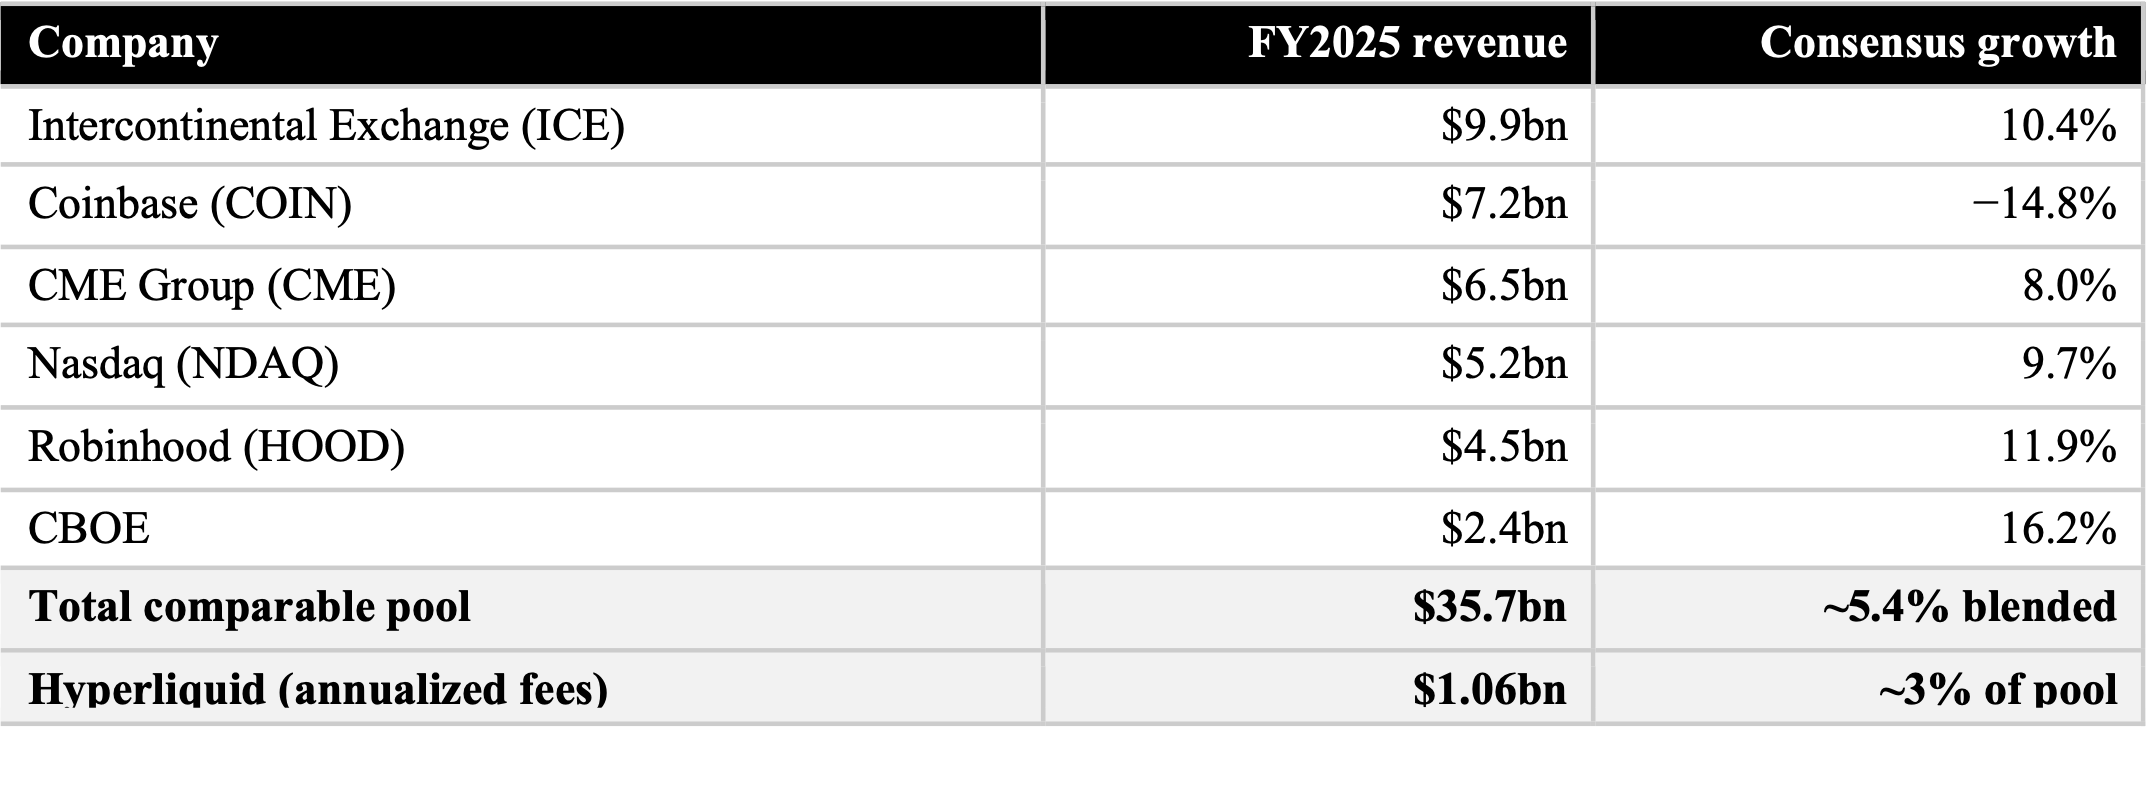
One caveat on the comparison. The arena Hyperliquid actually competes in day to day is crypto perpetuals, where it leads the on-chain field but sits behind the large centralized exchanges, and where its share moves with the incentive cycle described in Section 2. The regulated-venue pool is a useful anchor for the multiple and for the scale of the opportunity; the share trajectory itself is better understood through crypto-perpetual volume and take rate, which is the bottom-up model we flag as the next step.
Forward scenarios and a probability-weighted price target
We project the comparable revenue pool forward one year at each name’s Bloomberg consensus growth rate, to about $37.6bn, then ask what share Hyperliquid captures. The base case moves it from roughly 3% to 5% of the pool; the bull case lifts share to 7%; the bear case holds flat at today’s 3% as competition and a softer market cap any further gains. Each revenue figure converts to earnings at the historical ~83% buyback margin and carries a target multiple. The share-gain assumption also rests on a concrete forward catalyst: the CFTC’s June 2026 decision to permit regulated crypto perpetual futures in the United States opens a large new pool of onshore and institutional perpetual volume, and as the leading on-chain perpetuals venue Hyperliquid is positioned to capture part of it as that market develops. A second institutional catalyst is the arrival of US spot HYPE ETFs: Grayscale’s HYPG began trading on Nasdaq in June 2026, with Bitwise’s BHYP and 21Shares’ THYP close behind. Bitwise’s fund prices off a CF Benchmarks index, the CME CF Hyperliquid-Dollar Reference Rate, the same regulated index family that underpins the leading US spot Bitcoin and Ether ETFs. Wrapping HYPE in a regulated, index-referenced vehicle opens the token to allocators who cannot custody it on-chain, and that institutionalization is a direct demand-side support for both the price and the multiple on a go-forward basis.
On the multiples. We set target multiples well above the regulated-venue average of roughly 18x to 26x forward earnings: 40x in the bear case, 65x in the base and 75x in the bull. The justification is not only growth but the quality and efficiency of the earnings. Hyperliquid is an extraordinarily lean business: it runs on code rather than headcount, with no branch network, advertising budget, or heavy compliance and custody apparatus, so roughly 83 cents of every dollar of fees reaches token holders through the buyback. Coinbase, by contrast, converted about 19 cents of each revenue dollar into net income in 2025 ($1.3bn on $6.9bn), and Robinhood about 42 cents in a strong year ($1.9bn on $4.5bn), both carrying large operating, marketing and regulatory cost bases that scale with the business. A dollar of HYPE earnings is therefore both higher quality and more fully returned to holders than a dollar of Coinbase or Robinhood earnings, which on its own argues for a premium; set against a base case in which fees still rise about 78% year on year, several times the comps’ low-single to mid-teens growth, it is what supports multiples in the 40x to 75x range rather than the low-20s of a mature venue.
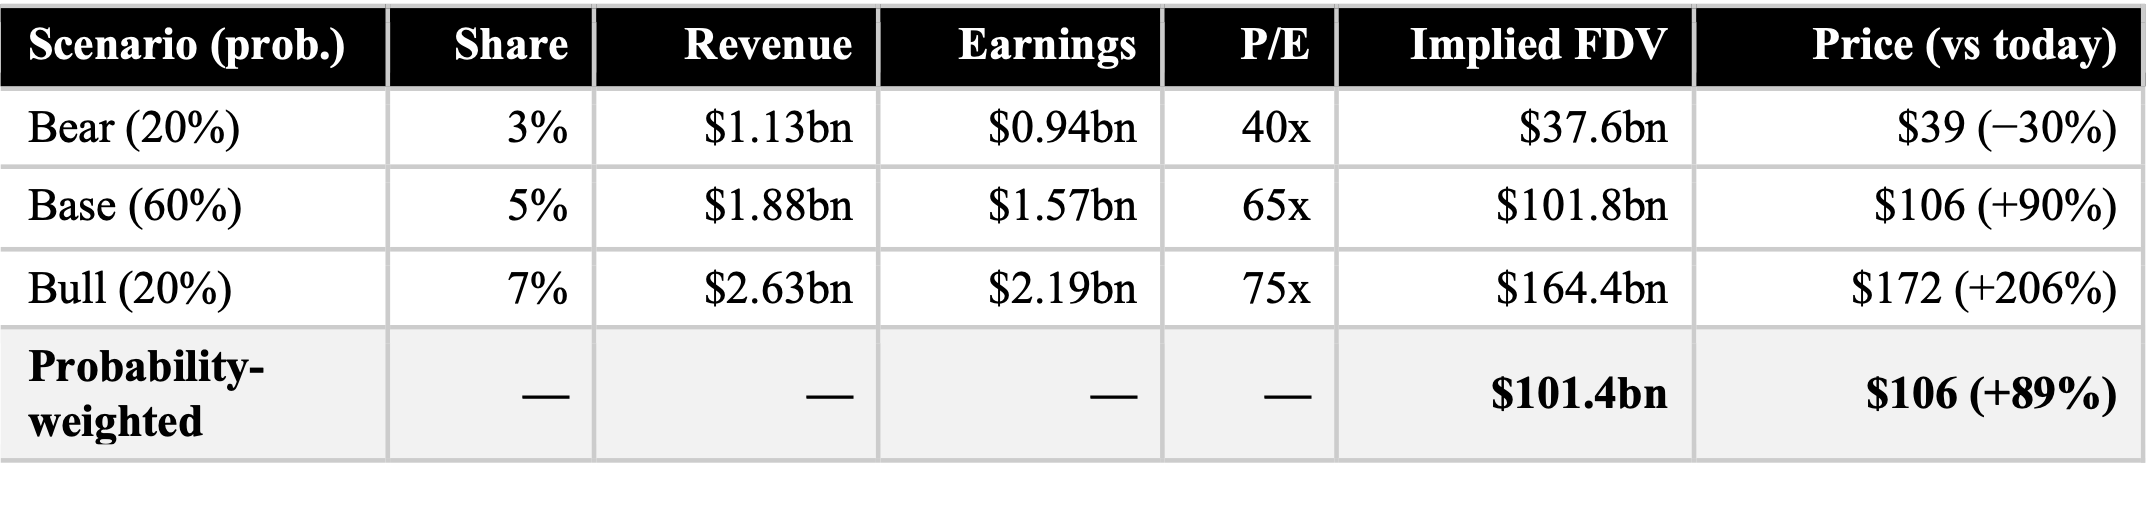
Reading the output: The probability-weighted fair value of about $101bn FDV sits roughly 89% above today. On these multiples the base case alone, at about $102bn, already implies roughly 90% upside, and the probability-weighting barely changes the headline because the bear case (about $38bn, roughly 30% downside) and the bull case (about $164bn, roughly 206% upside) offset one another around the base at the chosen weights. The distribution is wide, but with a premium multiple grounded in Hyperliquid’s margin efficiency it skews firmly to the upside. The result is most sensitive to that multiple assumption, which the prior paragraph sets out to justify, and to the bull-case weight.
Sensitivity: Two assumptions carry the result: the target multiples and the 20/60/20 weighting, and both deserve a stress test. Hold share at the base-case 5% but cut the target multiple from 65x to 40x and the base-case value falls from about $102bn to about $63bn, from roughly 90% upside to about 17%. The headline upside leans heavily on the premium multiple, which is why the margin-efficiency argument above has to carry the weight; a reader who is unconvinced by it, or who expects compression as growth normalizes, should haircut the target materially. A reader who instead assigns the bull case 10% rather than 20% still arrives at a clearly positive target, nearer 65% above today than 89%. We would rather make these levers explicit than bury them in a point estimate.
Comparison with public trading venues
Against the listed venues, Hyperliquid is the high-growth, high-multiple outlier. On FDV it trades near 61x trailing and, on base-case forward earnings, near 34x, above the regulated incumbents but on revenue growth several times theirs.6
A live disruption angle: In early June 2026, shares of CME, ICE, Nasdaq and CBOE sold off after the CFTC cleared a path for regulated crypto perpetuals through the Kalshi approval. The market is repricing the incumbents in real time for the competition Hyperliquid represents. It cuts both ways: it validates the perpetual-venue thesis, and it signals that well-capitalized regulated entrants will contest the same fee pool Hyperliquid needs to grow into. The same approval points at Hyperliquid’s own regulatory exposure, which we take up in the risks.
Conclusion
Hyperliquid is one of the most profitable businesses in crypto, and the buyback gives HYPE a cash-return mechanic most tokens lack. The bull case is powerful: if the protocol doubles its share of the revenue pool and earns a hypergrowth multiple, the token more than doubles. On fully diluted supply, the denominator we think an institution should use, the probability-weighted math points about a quarter above today, though the expected return still leans heavily on the bull tail.
The decision turns on three things resolving together: whether Hyperliquid keeps gaining share against venues now building competing products; whether the market keeps paying a hypergrowth multiple as growth normalizes; and whether the buyback can outrun the unlock schedule before it runs off in 2027. Until it does, float expands regardless of repurchases, which is the reason to underwrite on FDV. Size any position to the pace of unlocks and the durability of fee capture rather than to the headline target, and treat the bull multiple as a condition to watch rather than to assume.
Risks
Beyond the share, multiple and supply questions already covered, an institutional underwrite has to weigh several risks specific to Hyperliquid’s design.
The first is intervention and governance: the protocol has shown it will step in, as in the JELLY episode of March 2025, when validators voted to delist a market and force-close positions after suspicious activity and the foundation made most users whole, which protects the system but sits awkwardly with the idea of a neutral venue and is a discretion an underwriter should price. It is compounded by centralization, since Hyperliquid runs on a small validator set, on the order of two to three dozen against hundreds on Solana and far more on Ethereum, a concentration that creates censorship and liveness risk and forms the backdrop to the intervention point. The security record is a related concern: 2025 included several incidents, among them the JELLY manipulation, a private-key compromise in the tens of millions, and exploits in ecosystem vaults, and the shared liquidity vault also socializes losses across its depositors. Regulation cuts both ways, because the CFTC’s opening to regulated crypto perpetuals is a tailwind for the thesis but turns the same attention onto a venue offering high-leverage derivatives, leaving geographic restrictions, the treatment of the front end versus the protocol, and potential enforcement as open questions rather than settled ones. Finally, the buyback is a policy rather than a promise: holder returns depend on the Assistance Fund continuing to route nearly all fees into repurchases, which is a protocol rule, not a contractual obligation, and could change.
None of these is captured by a bear case framed only as lower market share. They are scenario-breakers rather than slow grinds, and we name them even though we do not haircut the target for them.
Disclaimer
This document is produced for informational purposes only. It is not investment advice, nor an offer or solicitation to buy or sell any asset, and it is not a research report or a recommendation. Digital assets are highly volatile and a position may lose its entire value. The figures and forward scenarios are estimates drawn from sources believed to be reliable but not guaranteed as to accuracy or completeness, and they may change without notice. The author, the firm and persons connected with them may hold or transact in HYPE or in the securities of the companies discussed, including positions inconsistent with the views expressed here. Recipients should perform their own due diligence and consult their own advisers before acting. Past performance is not indicative of future results.
Appendix A. Circulating-supply valuation
For completeness, the trailing metrics on circulating supply, about $12.5bn, against fully diluted, about $53.7bn. The gap is the unlock overhang quantified in Section 5.
Run the same probability-weighted model on circulating supply and the implied upside is far higher, because the denominator is about a quarter the size. That is the bull bound, not the central case: it assumes the buyback fully offsets future unlocks, which Section 5 shows it does not yet do. The figure in the body is the FDV one; this appendix is the upside sensitivity.
Notes
1. The Assistance Fund absorbs 97 to 99% of net protocol fees and uses them for continuous open-market HYPE purchases. Figures from the DefiLlama Hyperliquid page, snapshot June 2026.
2. Collateral-yield estimate: roughly $5bn of USDC held as margin at a 3.5 to 4% rate, with about 90% of the yield directed to the buyback, a contribution near $140 to 160m annualized and dependent on interest rates.
3. Sector volume and Hyperliquid share from DefiLlama and Artemis; the volume-to-open-interest comparison uses public exchange data. Volume share is metric-dependent, and Hyperliquid’s share on open interest is materially higher than on headline volume.
4. Over the trailing twelve months the buyback ran near $74m a month, about $0.9bn in total; through calendar 2025 it averaged about $65m a month, ranging roughly $39m to $111m, repurchasing about 21m HYPE at an average near $30 (CoinGecko buyback data). Scheduled supply is the core-contributor allocation, about 238m HYPE, vesting linearly over 24 months from early 2026, near 9.9m a month through 2027; Hyperliquid took no external venture funding, so there is no early-investor cliff.
5. Comps revenue is FY2025 net revenue (ICE, Nasdaq and CBOE report a higher gross figure that includes pass-through transaction expenses). HYPE is shown on annualized gross fees, the basis for the ~3% share.
6. Comparable multiples from stockanalysis.com, GuruFocus, Zacks and filings, June 2026. Coinbase forward earnings are cyclically depressed, which flatters its forward multiple.1. The Assistance Fund absorbs 97 to 99% of net protocol fees and uses them for continuous open-market HYPE purchases. Figures from the DefiLlama Hyperliquid page, snapshot June 2026.
2. Collateral-yield estimate: roughly $5bn of USDC held as margin at a 3.5 to 4% rate, with about 90% of the yield directed to the buyback, a contribution near $140 to 160m annualized and dependent on interest rates.
3. Sector volume and Hyperliquid share from DefiLlama and Artemis; the volume-to-open-interest comparison uses public exchange data. Volume share is metric-dependent, and Hyperliquid’s share on open interest is materially higher than on headline volume.
4. Over the trailing twelve months the buyback ran near $74m a month, about $0.9bn in total; through calendar 2025 it averaged about $65m a month, ranging roughly $39m to $111m, repurchasing about 21m HYPE at an average near $30 (CoinGecko buyback data). Scheduled supply is the core-contributor allocation, about 238m HYPE, vesting linearly over 24 months from early 2026, near 9.9m a month through 2027; Hyperliquid took no external venture funding, so there is no early-investor cliff.
5. Comps revenue is FY2025 net revenue (ICE, Nasdaq and CBOE report a higher gross figure that includes pass-through transaction expenses). HYPE is shown on annualized gross fees, the basis for the ~3% share.
6. Comparable multiples from Bloomberg and company filings, June 2026. Coinbase forward earnings are cyclically depressed, which flatters its forward multiple.
The information contained within is for educational and informational purposes ONLY. It is not intended nor should it be considered an invitation or inducement to buy or sell any of the underlying instruments cited including but not limited to cryptoassets, financial instruments or any instruments that reference any index provided by CF Benchmarks Ltd. This communication is not intended to persuade or incite you to buy or sell security or securities noted within. Any commentary provided is the opinion of the author and should not be considered a personalised recommendation. Please contact your financial adviser or professional before making an investment decision.
Note: Some of the underlying instruments cited within this material may be restricted to certain customer categories in certain jurisdictions.
Softer CPI Reprices July Hike Risk & Lifts Digital Assets
Digital assets extended their recovery over the past week as cooler US inflation prints repriced Fed expectations; the bid was broad across the large cap indices, growth factor leadership returned, stablecoin funding repriced lower, and stress stayed isolated in names hit by token-specific news.

Mark Pilipczuk
Notice of the Demising of CF Dai-Dollar Settlement Price and Spot Rate
The Administrator announces that it will demise the CF Dai-Dollar Settlement Price (DAIUSD_RR) and CF Dai-Dollar Spot Rate (DAIUSD_RTI) which are members of the CF Digital Asset Index Family.
CF Benchmarks
Addition of the Tether Gold Settlement Price and Spot Rate to the CF Digital Asset Index Family
The Administrator announces the addition of the Tether Gold Settlement Price and Spot Rate to the CF Digital Asset Index Family - Single Asset Series.
CF Benchmarks
By clicking Accept, you consent to CF Benchmarks's use of cookies.
Visit Cookie Settings to learn how CF Benchmarks uses cookies and to adjust your preferences.