
Feb 11, 2026
CF Benchmarks Newsletter Issue 100
Par
This edition marks the 100th installment of the CF Benchmarks Newsletter. Since its inception, the Newsletter has aimed to provide an accessible but institutionally grounded perspective on key developments across digital asset markets — with a particular focus on market structure, benchmark integrity, and the gradual professionalization of the asset class. Over time, the Newsletter has evolved into a place for contextualizing the key news in our space through the lens of our regulated benchmarks and governance standards, as well for expositions of the real-world institutional use cases increasingly underpinned by those benchmarks and standards. As ever, the focus in this issue remains firmly on developments within the institutional crypto landscape and how its cohort of participants are interacting with the market.
Browse all back issues here.
Parsing the Allocations Downturn

Bitcoin and Ether ETF flows have trended lower for months, with isolated pockets of gains
The deterioration of crypto price sentiment since last October has unsurprisingly been accompanied with a marked deterioration of flows into U.S.-listed ETFs in that asset class. Though the ETF complex has recorded a steady trend of reduced exposure since at least November, the tape has in fact delivered abrupt moves in both directions, as shown by Bitcoin daily net flows graphed in the Figure 1.
Figure 1: US spot Bitcoin daily net flows – Nov 2025 – Feb 2026
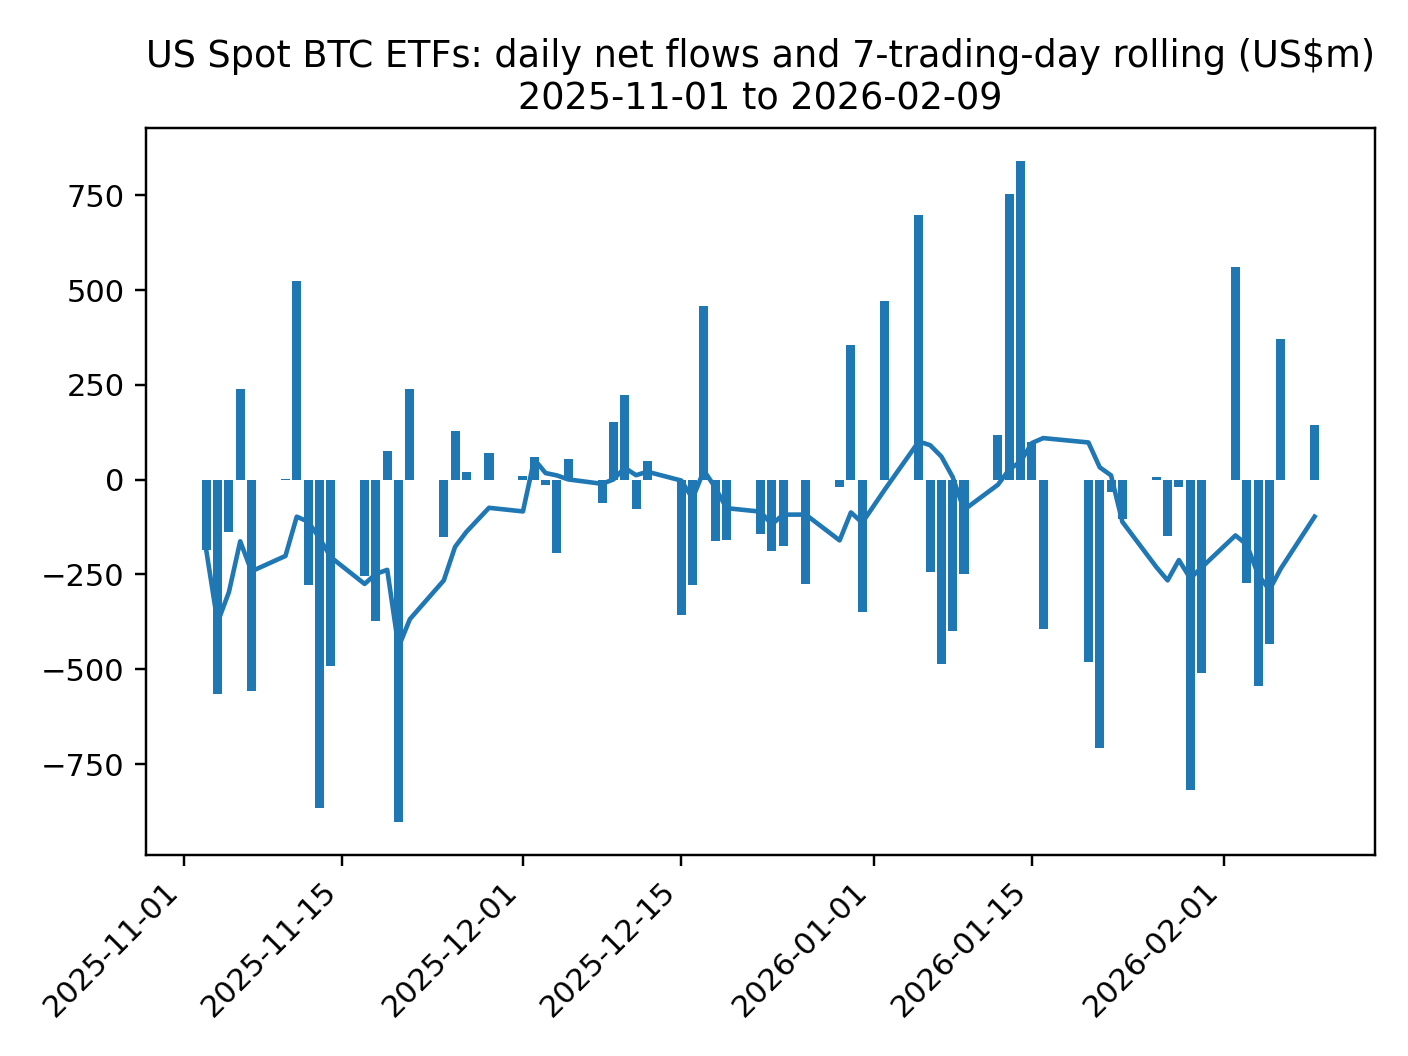
A closer examination is worthwhile given the potential for takeaways that could be indicative for the near-term trajectory of allocations from here, and even for a potential recovery of overall buying intent.
Cratering
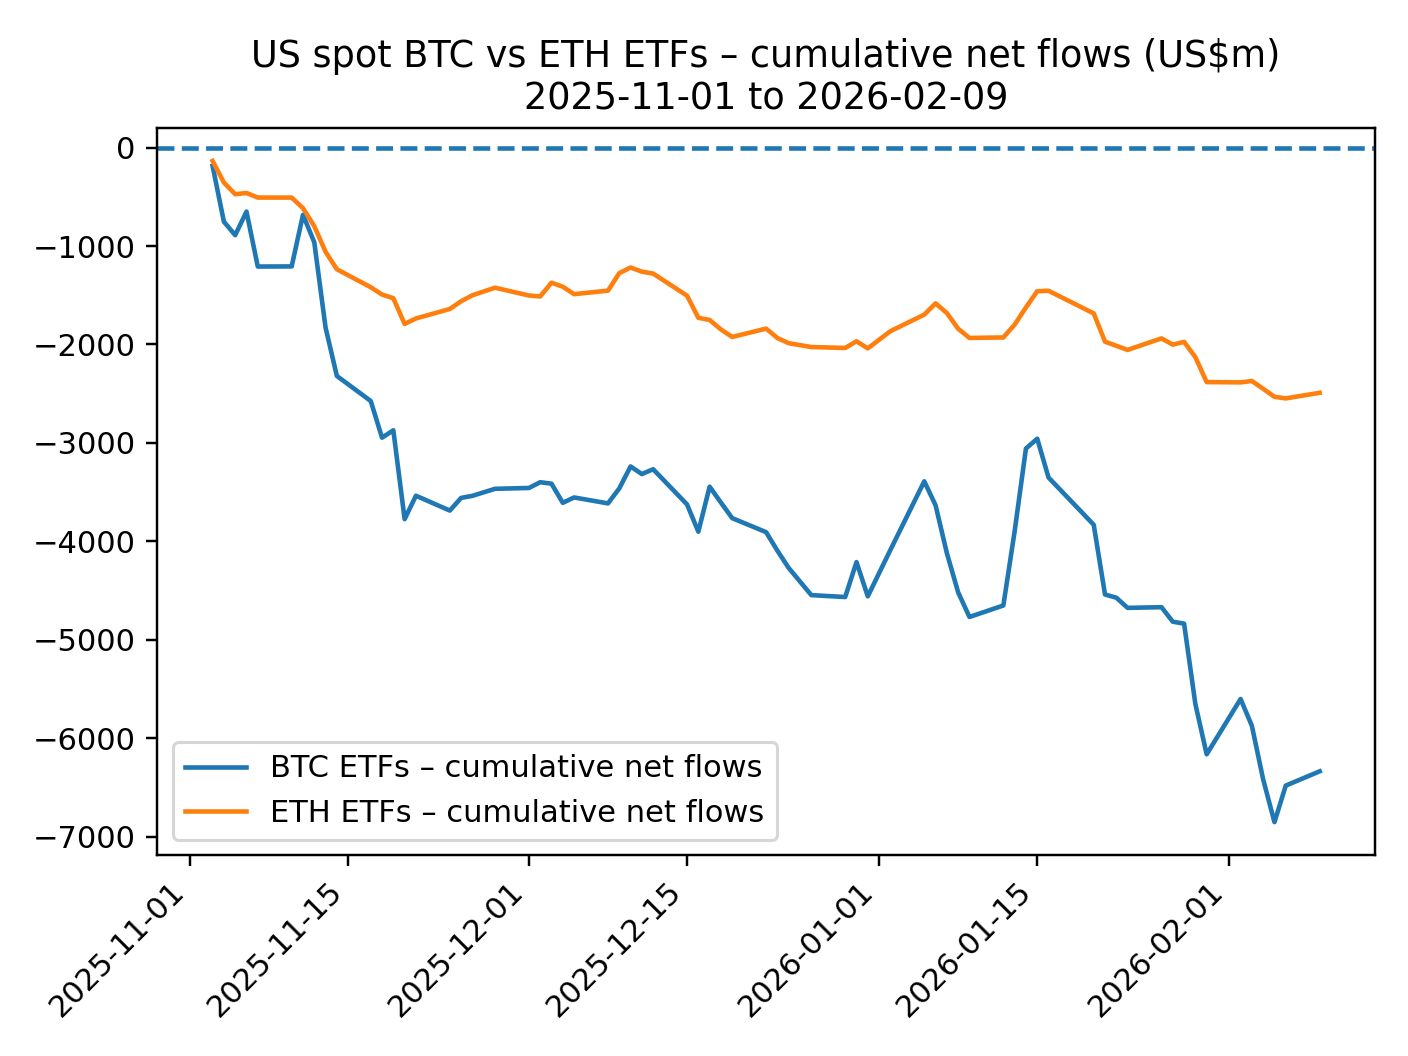
The overarching observation from November 1st, 2025, through February 9th, 2026, is that U.S. spot Bitcoin ETFs have seen around $6.3 billion of net outflows, while US spot Ethereum ETFs have shed roughly $2.5bn – reflecting several months of net exposure reduction.
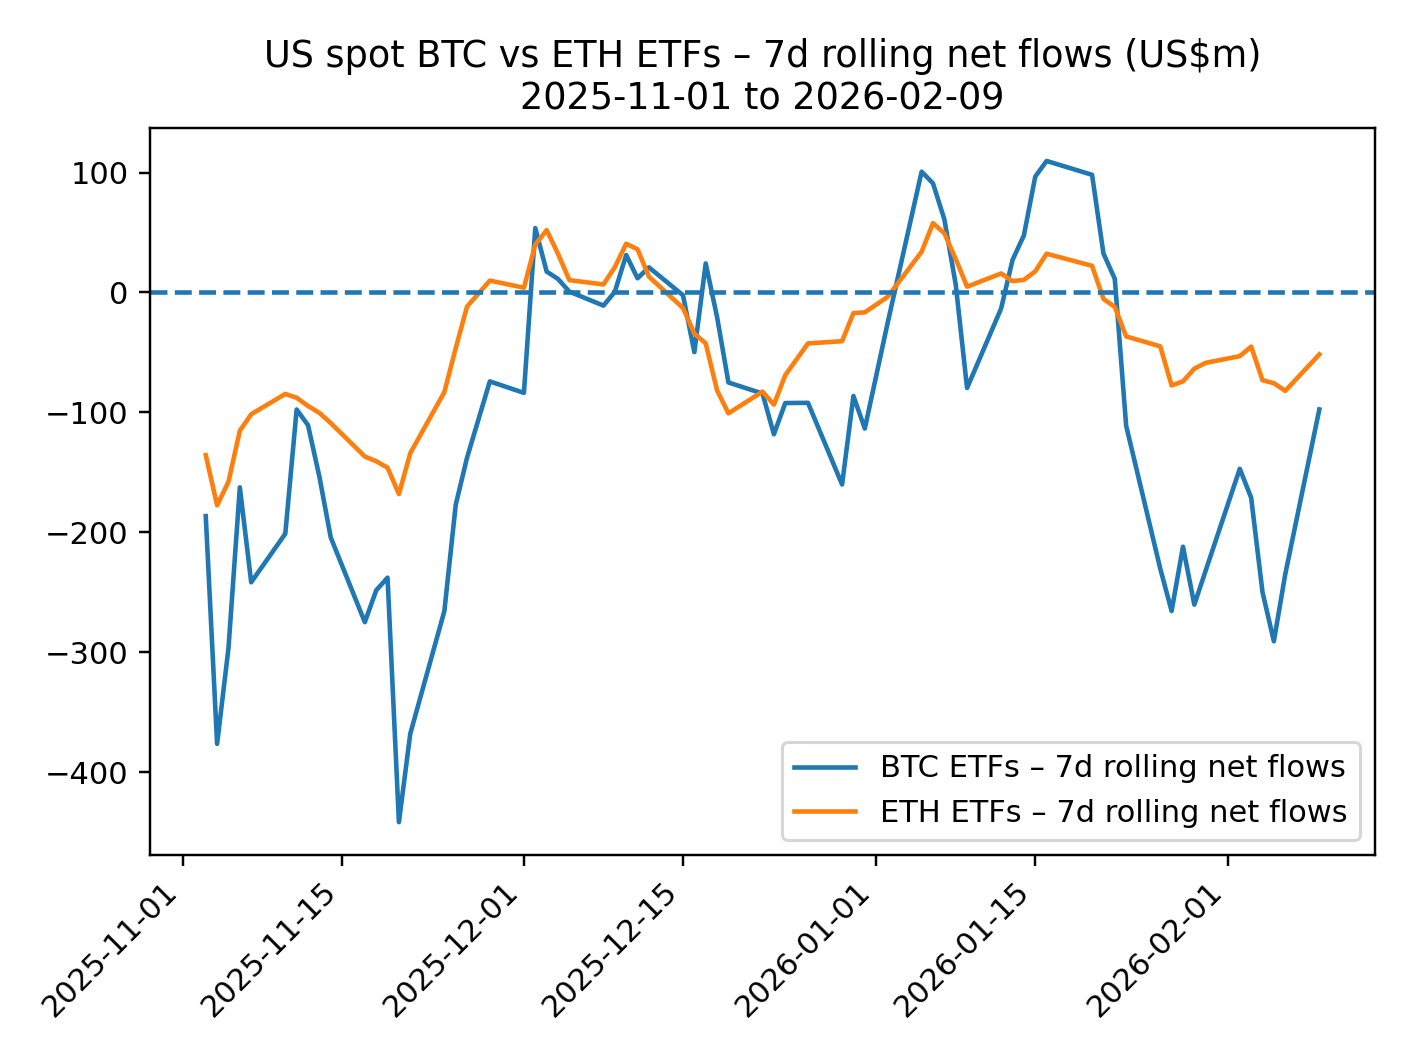
As illustrated by the rolling 7-day net flow series charted in Figure 2 below, heading into the winter, demand across both BTC and ETH ETF complexes essentially cratered for longer stretches than were balanced by renewed net allocations, with short-lived positive readings periodically surfacing, often around sharp price dislocations. Across the window, the pattern points to tactical engagement layered onto a broader withdrawal of marginal capital, with Bitcoin experiencing deeper and more persistent net outflows than Ethereum.
Figure 2: US spot Bitcoin vs. ETH ETFs – net flows – Nov 2025 – Feb 2026
Unwound
The cumulative view shown in Figure 3 reinforces the trajectory; moreover, it reveals how a meaningful portion of the exposure accumulated earlier in the cycle has already been unwound through redemptions.
Figure 3: US spot Bitcoin vs. ETH ETFs - cumulative flows - Nov 2025 - Feb 2026
More positively, with products like IBIT and FBTC and other leading funds continuing to hold tens of billions of dollars in assets even after sustained net redemptions over several months (see Table 1.) a predictable increase within pockets of the ‘popular discourse’ to write off the viability of the wrapper and even the asset class, will, at the very least, continue to look misguided for time.
Table 1: US spot Bitcoin ETFs — assets and net flow by windows
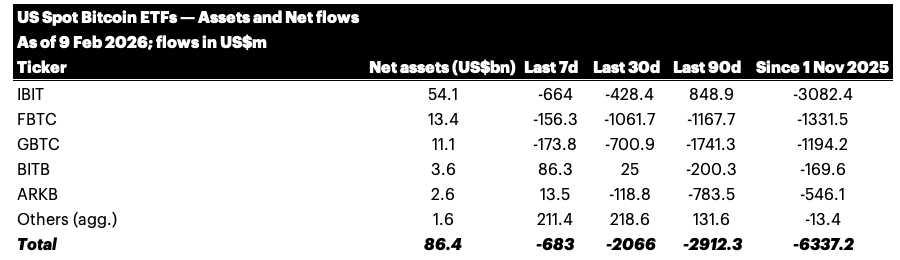
Even so, that there’s been a definitive, even aggressive, de-risking expressed through the ETF wrapper is not in doubt. Meanwhile, the most recent 7-day segment, coinciding with the sharpest bout of volatility in this phase so far, makes it clear the deallocation trend is looking sticky.
See our piece on the CME CF Bitcoin Volatility Index below for further perspectives on the recent spike of realized and implied volatility.
Ethereum Scale
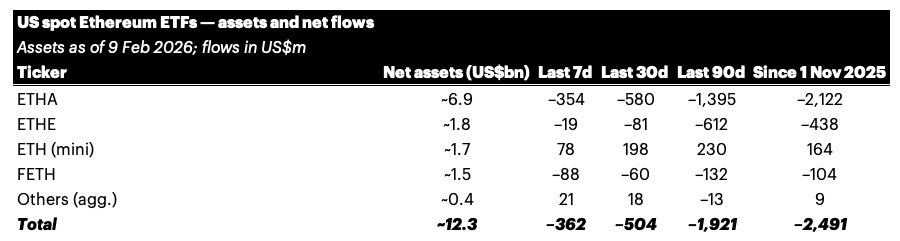
Ethereum ETFs have exhibited a related pattern at smaller scale (see Table 2). Net outflows since November have been concentrated in the largest products, particularly ETHA and the legacy ETHE trust, with partial offsets from lower-fee or structurally newer vehicles. Here too, aggregate assets remain meaningful, even as the recent flow windows continue to register net selling.
Table 2: US spot Ether ETFs - assets and net flow by windows
Asset Base
Taken together, the BTC and ETH tables portray large standing asset bases coexisting with a relatively marginal – albeit still disconcerting – negative flow profile. The configuration aligns with a consolidation phase where the core positions remain in place while incremental exposure is adjusted more cautiously through partial redemption, rebalancing, and hedging.
Theory
Alongside flows, options activity around the largest ETF tickers has drawn attention within institutional market circles. A widely circulated opinion recently speculated that some of the observed volatility and flow behavior could be linked to hedging activity or pressure on severely leveraged participants. We may be furnished with data that reveals the reality when the December 2025 quarter’s 13Fs land in a week. Regardless of the veracity of talk like that though, interpretations fit the current environment of elevated volatility and subdued marginal demand.

BlackRock Files for iShares Bitcoin Premium Income ETF
BlackRock has filed an S-1 registration statement with the SEC for the iShares Bitcoin Premium Income ETF — a vehicle designed to combine Bitcoin exposure with an options-based income strategy. The registration was submitted on January, 23rd, 2026, and, if approved, the product will be listed on Nasdaq.
Active ETF Trend Reaches Crypto
The proposed vehicle aims to provide shareholders with consistent cash distributions by incorporating a covered-call strategy alongside Bitcoin exposure. According to the filing, the fund: “seeks to reflect generally the performance of the price of bitcoin while providing premium income through an actively managed strategy of writing (selling) call options primarily on IBIT shares and, from time to time, on indices that track spot Bitcoin exchange-traded products, including IBIT.”
The filing signals a further maturation of the Bitcoin ETF landscape: the addition of a systematic yield component expands the toolkit beyond pure directional exposure into structures that target income and tailored return distributions, a design familiar to equity markets where covered-call ETFs have attracted significant capital, particularly in recent years.
Strategy and Mechanics
At its core, the premium-income ETF contemplates a covered-call overlay, where the fund maintains exposure to spot Bitcoin via a combination of Bitcoin holdings and shares of BlackRock’s existing iShares Bitcoin Trust (IBIT) earning option premiums by selling call contracts. Those premiums are intended to be distributable to investors as income.
It's a structure that's well-understood institutionally. In sideways or mildly volatile markets, systematic option overwriting is often used for the generation of regular income, while smoothing overall return volatility. Though upside tends to be partly sacrificed to the option buyer when options are exercised in strongly trending markets, exact outcomes for investors depend materially on implementation choices — strike selection, option tenor, rebalancing cadence, and the depth and liquidity of the listed options market for the underlying exposure.
Supplementary Liquidity
BlackRock’s IBIT, is the largest spot Bitcoin ETF in AuM terms and utilizes the CME CF Bitcoin Reference Rate — New York Variant (BRRNY) as its Bitcoin benchmark. This means it's one of the largest single components of the CME CF Bitcoin Liquidity Complex, the virtuous circle of assets referencing CF Benchmarks' suite of Bitcoin indices, establishing an interlocking system of liquidity, underpinning tracking, tightening spreads and enhancing efficiency. Backed by such structures, an iShares Premium Income ETF could notionally be one of the most advantageously placed of its kind.
Implications for Options and Hedging Flow
A large, systematically option-writing ETF should introduce a persistent supply of call premium into the listed derivatives ecosystem. That's partly because dealers and market-makers hedging this generation of premium will execute delta and gamma hedges across spot, futures, and options of the ETF wrapper itself. These hedges could even lead to structural demand in underlying markets, and shape implied volatility surfaces across strikes and expiries. As per other asset classes, sustained call 'overwriting' supply tends to compress premiums in targeted tenor and strike regions, with execution quality and benchmark timing influencing realized returns and transaction costs.
IBIT vs. Premium Income 'IBIT'
Rather than representing a departure from BlackRock’s crypto ETF strategy though, this filing is actually a natural extension. IBIT has become a central piece of Bitcoin allocation infrastructure, and the filing certainly shows BlackRock’s intent to innovate around that base. By broadening the suite of risk/return exposures — from pure beta via spot tracking to income-oriented overlays — the firm is catering to a wider range of institutional mandates, including those prioritizing predictable cash flow or risk-managed exposure.
Overall, in the context of broader ETF flows, this development highlights that product innovation continues alongside reallocations and net outflows in existing vehicles. Yield-oriented structures may attract a different cohort of investors or encourage existing holders to engage with Bitcoin exposure through outcomes that align with traditional portfolio income targets.
Again, such innovations are only ever countenanced with solid assurances that all necessary components – including benchmarks – work like clockwork.

CME Launches CFB-Powered Cardano, Chainlink and Lumens Futures
CME Group futures coverage now includes alt heavyweights Cardano, Chainlink and Stellar.
Three New Contracts, Two Sizes
CF Benchmarks congratulates CME Group on the latest expansion of its regulated crypto derivatives suite with the launch of Cardano (ADA), Chainlink (LINK) and Lumens (XLM) futures. The contracts are listed in both standard and micro sizes, offering participants more flexible ways to calibrate exposure and risk across three widely followed networks.
CME Group x CF Benchmarks
For CF Benchmarks, these listings extend our long-standing and exclusive partnership with CME Group. Just like all other CME Group crypto contracts, the new futures are cash-settled to CF Benchmarks-administered CME CF Reference Rates, all of which are Registered Benchmarks under the UK (and EU-aligned) Benchmarks Regulation framework, authorized by the UK FCA, and designed to provide robust, transparent settlement mechanisms aligned with institutional market requirements.
Crypto Cadence
Ultimately benefiting a large swathe of market participants, this latest batch of crypto contract launches maintains the quickened cadence of CME Group’s new digital asset listings of recent years, relative to the frequency at which the group added new crypto contracts during earlier phases of institutional adoption.
Selloff Spotlights CME CF Bitcoin Volatility Index’s (BVXS) Role as Risk Barometer
How BVXS helps lifts the lid on implied vol. when Bitcoin throws one of its curve balls
Another Toast of Value
With Bitcoin’s drawdown accelerating into February, amid fragile broader-market sentiment, crypto is once again exhibiting characteristics that are more akin to those of a high-beta expression of macro uncertainty than commensurate with its portrayal as a longer-term store of value and potential hedge against monetary debasement.
Using standard means of quantifying this week’s drawdown relative to recent sell-offs we can compile a comparative list of market routs, per below.
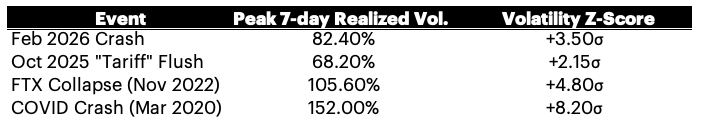
The suggestion is that although the latest sell-off does not currently read as being as extreme as 2020’s ‘COVID Crash’, or the one triggered by FTX’s implosion, at 3.5 sigma, the ‘speed’ of the most recent crash can certainly mark it as a traumatic episode for the market.
Measuring Air Pockets
The pace of such moves and reflexive dynamics that tend to develop when liquidations meet thinning liquidity – often characterized by participants as ‘air pockets’ – typically shifts attention from narratives about spot to the forward price of uncertainty: the premium investors will pay today for convexity and protection over the next month. For highly regulated institutional operators though, the availability of benchmarks suitable for assessment of such convexity and premia is limited.
BVXS’s Role
That is the purpose of the CME CF Bitcoin Volatility Index – the 30-day constant maturity measure of implied volatility, based on CFTC-regulated Bitcoin and Micro Bitcoin options contracts traded on CME Group’s marketplace.
This Week’s Spike
In this week's case, to get an idea of how eye-watering the upsurge of implied volatility has been, we can begin by noting the relatively moderate BVXS print at 55.01 on February 4th. That was followed by BVX spiking to as high as 90.76 on February 5th, at 21:40:30 GMT.
In fast markets, the relationship between a live reading and a daily settlement rate provides a useful gauge of repricing tempo. BVX will reflect the immediate clearing price of protection as conditions shift intraday. BVXS provides the benchmarked daily reference rate that risk owners can carry into reporting and governance artifacts.
Institutional-Grade Methodology
BVXS earns that institutional role through its construction. The settlement methodology aggregates intraday BVX observations across the day using time partitioning and volume-weighted averages, then equally weights the partition averages into a single daily settlement value. The design supports a benchmark-quality rate that remains grounded in traded options inputs while providing a stable daily reference point.
The information contained within is for educational and informational purposes ONLY. It is not intended nor should it be considered an invitation or inducement to buy or sell any of the underlying instruments cited including but not limited to cryptoassets, financial instruments or any instruments that reference any index provided by CF Benchmarks Ltd. This communication is not intended to persuade or incite you to buy or sell security or securities noted within. Any commentary provided is the opinion of the author and should not be considered a personalised recommendation. Please contact your financial adviser or professional before making an investment decision.
Note: Some of the underlying instruments cited within this material may be restricted to certain customer categories in certain jurisdictions.
Changes to the Token Market Price Benchmarks Series - Market Prices – 21 July 2026
The Administrator has confirmed changes to the Token Market Price Family for the period 14 July 2026 to 21 July 2026.

CF Benchmarks
Softer CPI Reprices July Hike Risk & Lifts Digital Assets
Digital assets extended their recovery over the past week as cooler US inflation prints repriced Fed expectations; the bid was broad across the large cap indices, growth factor leadership returned, stablecoin funding repriced lower, and stress stayed isolated in names hit by token-specific news.
Mark Pilipczuk
Notice of the Demising of CF Dai-Dollar Settlement Price and Spot Rate
The Administrator announces that it will demise the CF Dai-Dollar Settlement Price (DAIUSD_RR) and CF Dai-Dollar Spot Rate (DAIUSD_RTI) which are members of the CF Digital Asset Index Family.
CF Benchmarks
By clicking Accept, you consent to CF Benchmarks's use of cookies.
Visit Cookie Settings to learn how CF Benchmarks uses cookies and to adjust your preferences.