
Jun 30, 2025
CF Benchmarks launches CF Factor Intelligence; enabling actionable insights from our validated model
CF Benchmarks is excited to announce the introduction of CF Factor Intelligence: providing public access to the data sets based on our proprietary Factor Data for Digital Assets—powered by institutional‑grade, quantitatively validated crypto market factors.
The Data behind the Model
In November 2024, CF Benchmarks published the first institutional‑grade factor model for digital assets, confirming that systematic risk premia long observed in equities and bonds are also present—and measurable—in crypto markets.
Building on our initial research that culminated in publication of the research paper “A Factor Model for Digital Assets”, we are now making components of the underlying model and data sets available online, within a brand-new data product suite, CF Factor Intelligence, enabling institutional investors to measure, attribute and allocate in crypto with the same analytical discipline applied to traditional assets.
Recap
As a reminder, note that our analysis was based on three decades of academic and practitioner research, from Fama–French through to modern smart‑beta frameworks, extending familiar concepts into a nascent asset class.
We identified seven statistically significant factors—Market, Size, Value, Momentum, Growth, Downside Beta and Liquidity—which together explained more than 45% of crypto return variation.
In short, CF Benchmarks' research closed a methodological gap for risk managers and asset allocators seeking rigor in their digital‑asset exposure comparable to insights that are possible by deployment of factor-based methodologies in the realm of traditional market assets.
A recap of the factors underlying our Factor Model for Digital Assets, together with their rationale, and details of their calculation, is provided in the table below.
Table 1
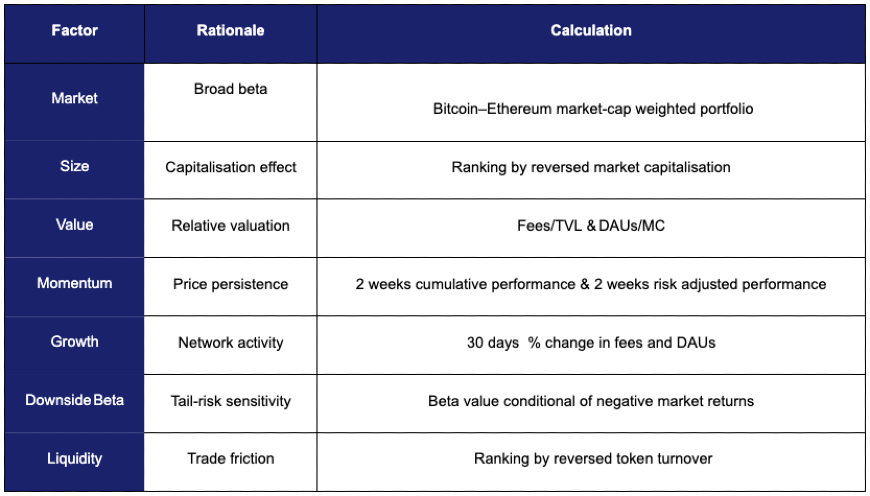
Key to abbreviations
- DAU – Daily Active Users
- TVL – Total Value Locked
- MC – Market Capitalisation
Ready for integration
The rollout of the CF Factor Data Series within CF Factor Intelligence means institutional investors now have access to the underlying data of the factor model validated by CF Benchmarks. Investors can now confidently integrate CF Benchmarks' digital asset factors within portfolio allocation processes, risk modeling frameworks, and other critical investment scenarios, adopting heuristics similar to the ones institutional investors have grown accustomed to when investing in traditional markets.
The datasets are published daily, ready for delivery via API or recurring reports.
Initial release: what's included
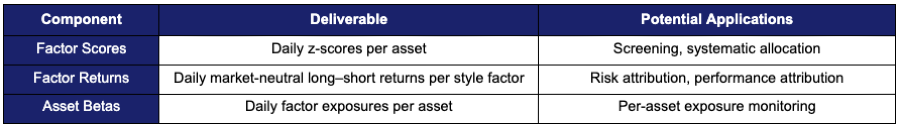
The dataset provides a comprehensive set of building blocks designed for immediate integration into professional workflows
Dataset components, their respective deliverables, and potential applications are summarized in the table below.
Table 2
Data architecture and governance
CF Benchmarks applies the same rules-based rigor it applies to the calculation, publication and administration of its regulated pricing sources to the collection, processing and publication of factor data.
Multi‑venue price capture – Price data are sourced from multiple regulated spot exchanges.
Descriptor validation – The underlying descriptor data were sourced from smart contract parsers and blockchain nodes, and subsequently subjected to comprehensive validation, including assessments across multiple rebalancing frequencies and diverse asset universes to ensure methodological robustness.
Governance – Factor definitions are subject to the same standards of governance, replicability, representativeness and market integrity that CF Benchmarks applies to all of its pricing sources and data as a regulated Benchmark Administrator under UK BMR.
Early observations from the dataset
We provide three illustrative views derived from the CF Factor Intelligence datasets below. Fully interactive illustrations are available in the dashboard at our CF Factor Intelligence product page.
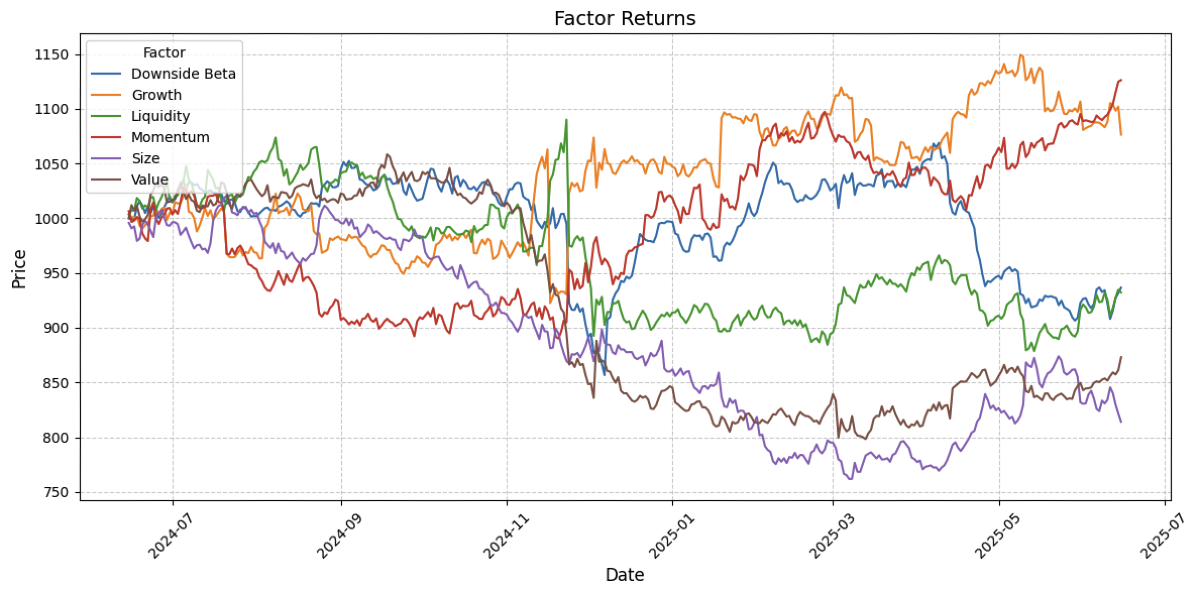
Figure 1 illustrates the cumulative performance of each factor between January 2024 and June 2025.
Growth was the strongest‑performing factor over the period, while Size lagged amid a rotation toward larger‑capitalization assets.
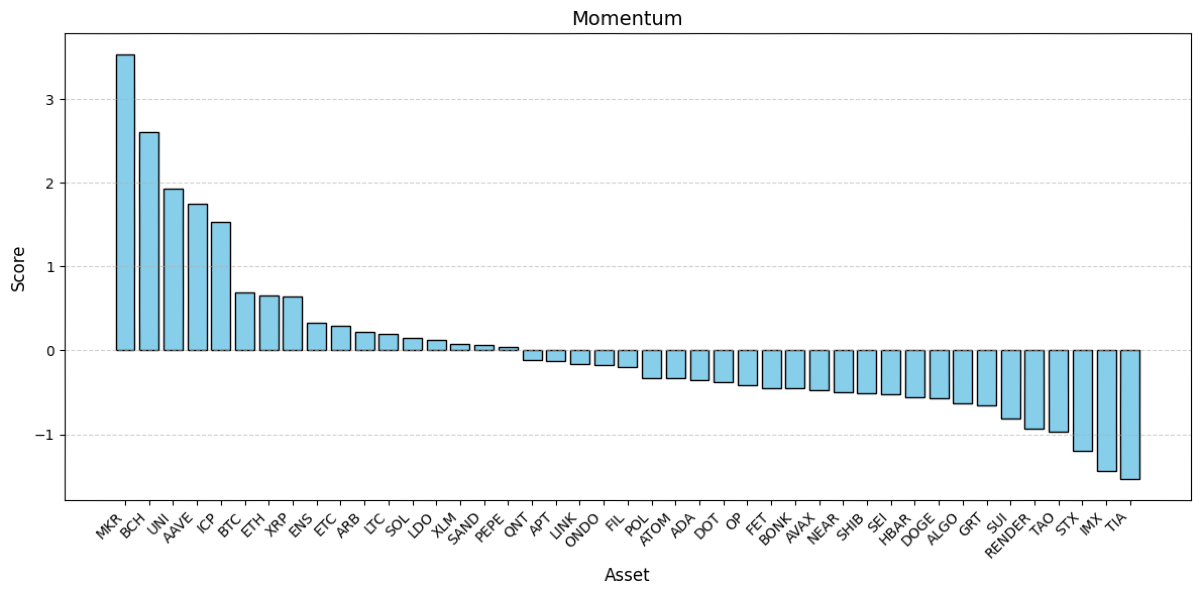
Figure 2 presents Momentum factor scores for a cross-section of digital assets. These scores quantify the relative strength of the Momentum factor for each asset, enabling clear comparison of how individual assets are positioned with respect to this style factor.
In this case, MKR and BCH register the highest Momentum scores, reflecting strong recent price performance and positive investor sentiment. Conversely, IMX and TIA exhibit the lowest scores, indicating weaker Momentum and potential underperformance relative to their peers in the short term.
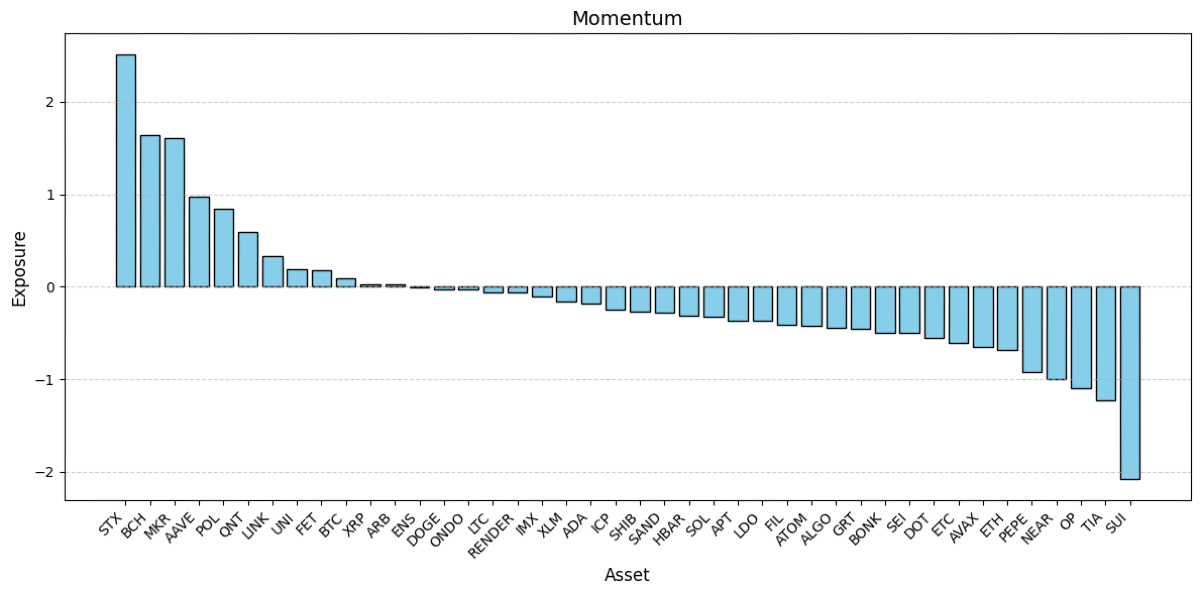
Last but not least, Figure 3 presents the estimated Momentum factor exposures (or betas) for individual digital assets. These values are derived from rolling time-series regressions using three years of daily returns, quantifying each asset’s historical sensitivity to the Momentum factor.
Assets such as MKR and BCH show the highest positive loadings, indicating they have consistently co-moved with the Momentum factor. In contrast, assets like SUI exhibit significantly negative exposures, suggesting they tend to behave in opposition to the Momentum factor, and could potentially serve as natural hedges within a factor-based allocation framework.
CF Factor Intelligence in action
The Digital Asset Factors validated by CF Benchmarks exhibit significant risk premia and explanatory power for digital asset returns. As such, a wide variety of use cases is indicated by the deployment of the underlying datasets—now available for public use. We have summarized some of the key potential applications below.
- Risk managers: can utilize factor returns to decompose portfolio risk and identify the key drivers of performance and volatility
- Quantitative funds: are able to develop trading signals based on factor data
- Portfolio managers: can analyze factor tilts to optimize exposures and mitigate unintended risk concentrations
- ETF and index providers: can construct smart beta or style-based products
Conclusion
The arrival of CF Benchmarks’ CF Factor Intelligence data marks a practical inflection point for factor-based digital‑asset investing. We have moved from demonstrating that systematic drivers exist in crypto markets, to equipping investors with the tools needed to observe, attribute and manage those drivers in real time. By combining validated crypto market factors with a framework for their deployment, this release bridges theory and practice: factor scores and exposures translate market hypotheses into quantitative signals; factor returns illuminate risk premia; and our screened universe grounds every calculation in liquid, investable assets. Just as style factors reshaped equity and credit investing over the past three decades, this toolkit will inform how institutions quantify risk exposures, guide portfolio construction, and attribute performance in crypto. We look forward to seeing how researchers, portfolio managers and product teams integrate these tools and push the conversation forward.
Discover more
Click the links below to access the CF Factor Intelligence dataset and to explore CF Benchmarks' Factor Model for Digital Assets further.
- Explore CF Factor Intelligence charts
- Read our launch article: CF Benchmarks introduces first Institutional-grade Factor Model for Digital Assets (November 2024)
- Download the research paper: 'A Factor Model for Digital Assets' (November 2024)
For further information please contact us at [email protected].
The information contained within is for educational and informational purposes ONLY. It is not intended nor should it be considered an invitation or inducement to buy or sell any of the underlying instruments cited including but not limited to cryptoassets, financial instruments or any instruments that reference any index provided by CF Benchmarks Ltd. This communication is not intended to persuade or incite you to buy or sell security or securities noted within. Any commentary provided is the opinion of the author and should not be considered a personalised recommendation. Please contact your financial adviser or professional before making an investment decision.
Note: Some of the underlying instruments cited within this material may be restricted to certain customer categories in certain jurisdictions.
Changes to the Token Market Price Benchmarks Series - Market Prices – 21 July 2026
The Administrator has confirmed changes to the Token Market Price Family for the period 14 July 2026 to 21 July 2026.

CF Benchmarks
Softer CPI Reprices July Hike Risk & Lifts Digital Assets
Digital assets extended their recovery over the past week as cooler US inflation prints repriced Fed expectations; the bid was broad across the large cap indices, growth factor leadership returned, stablecoin funding repriced lower, and stress stayed isolated in names hit by token-specific news.
Mark Pilipczuk
Notice of the Demising of CF Dai-Dollar Settlement Price and Spot Rate
The Administrator announces that it will demise the CF Dai-Dollar Settlement Price (DAIUSD_RR) and CF Dai-Dollar Spot Rate (DAIUSD_RTI) which are members of the CF Digital Asset Index Family.
CF Benchmarks
By clicking Accept, you consent to CF Benchmarks's use of cookies.
Visit Cookie Settings to learn how CF Benchmarks uses cookies and to adjust your preferences.